KIC 8462852 Hereford Arizona Observatory (HAO) Photometry Observations #12
Bruce Gary, Last updated: 2022.05.17, 00 UT

I have discontinued observations of KIC846 for this observing season. My plan is to write a "report" summarizing my interpretation of what was found from the photometric observations reported on this web page. Before doing this "I need a break" - so maybe in February I'll have a PDF for download from this web page.
_______________________________________________________________________

A 1 % dip recovered a little but is now persisting at 0.5 %. I don't think the fade pattern is similar to the pattern predicted 4 years ago. This probably invalidates the prediction of a return of the Kepler D1540 fade pattern, and hence a repudiation of the 1601-day periodicity.

We're beginning the observing window for a return of the Kepler D1540 fade pattern that was predicted 4 years ago to occur this month (Bourne, Gary and Plakhov, 2017). If it repeats it should be possible to use g' and i' measurements to determine whether the entire fade is caused by an optically thin dust cloud or an optically thick one (based on ratios of depths at these two bands). If the central portion is produced by a large planet (or small star, such as a brown dwarf), it the central part will be optically thick (same depth at both bands) and the flanks (ring system) could be optically thin (depth at i' ~ 40 % of depth at g' band). If this fade structure is a "no show" then we will be inclined to disbelieve in the 1601-day periodicity and the interpretation of an association between the D1540 dip structure and what was observed 1601 days later, as described in Bourne, Gary and Plakhov (2017).


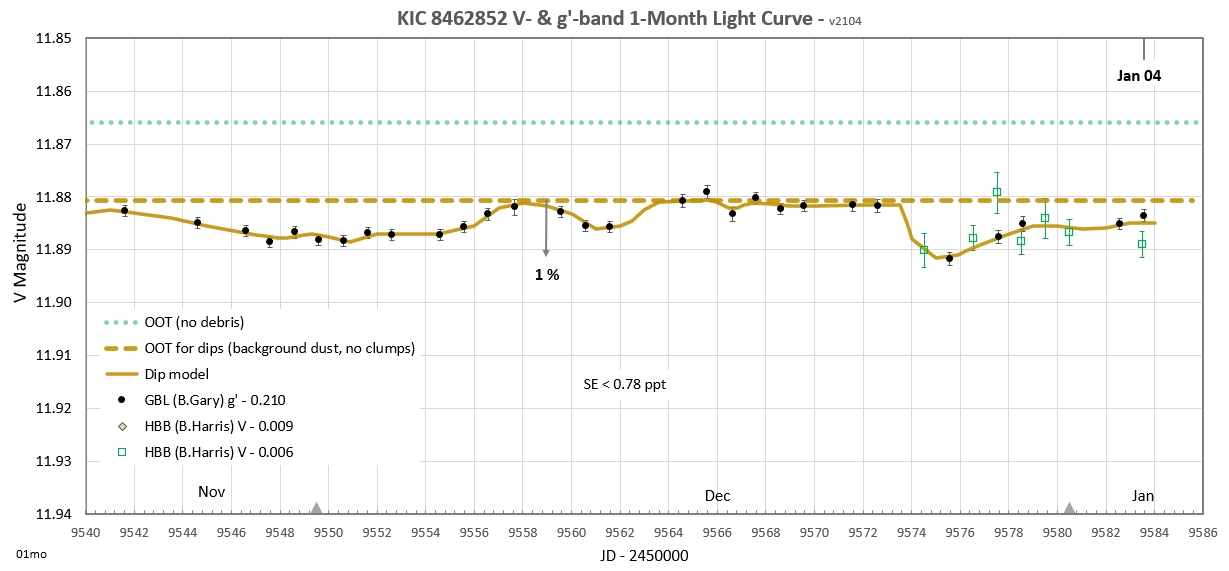
Figure 0.1. V and (offset) g' mag's for the last month.


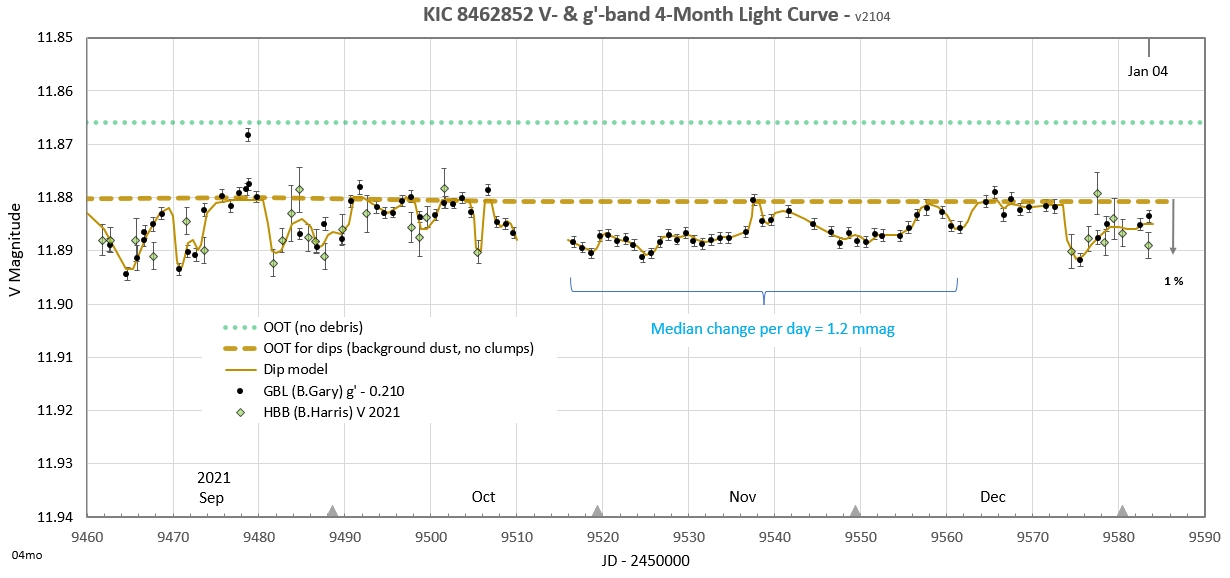
Figure 0.2. Same data but showing a prediction made 4 years ago (return of Kepler D1540).


Figure 0.3. HAO g', r' & i' mag's
for the last month with a "prediction" (by Bourne, Gary & Plakhov, 2017) for the return of Kepler's D1540 fade (a ringed planet).

PREDICTION: The present pattern will reverse itself and reveal a symmetry about JD4 ~ 9520. This is what would happen if we're dealing with one big dust cloud that is optically thick at the center and is optically thin on ingress and egress sides.
        ___________________________________________________________________________________________________________________________________

This observing season continues a trend of more frequent dips of lower depth than the year before. When Kepler was observing (8 to 12 years ago) dips were rare, but when they occurred they were usually deep. When ground-based measurements first showed dip activity (2017 May), the dips were 1.5 to 3 %, and this was exciting. Every observing season since then as seen lower depth dips, and more of them. During the present observing season we have the most dips per month ever, and they're less deep than ever (~0.5 to 1.0 %). This pattern can be understood as a natural consequence of dips being produced by dust clouds resulting from a cascade of collisions that started with one big collision 10 years ago (in 2011). This "collision cascade model" predicts the following 3 patterns for dips on successive orbits (imagine orbit P = 776 days): 1) a group of dips will be spread out over a longer date interval, 2) there will be more dips per month, and 3) dips will be less deep. This pattern can already be seen. I therefore predict that the next several months will be like the last several months: lots of 0.5 to 1.0 % dips and nothing more dramatic.

Since early 2021 the "long timescale" level has been ~ 1 % below the "complete clearing" level (defined as no debris of any timescale). 
The only "complete clearing" occurred in late 2019.

I continue to be impressed by the stark difference in dip activity between the early Kepler data and this observing season. Here's an example of the difference:


Figure 0.3. Comparing dip activity for early Kepler and recent HAO data (same x- and y-scales).

Whereas the Kepler data is within 0.1 % of unity 94 % of the time, the HAO data is within the same range a mere 24 % of the time. (If the next 260 days of Kepler data had been chosen the difference would have been more dramatic). The fact that there was ANY dip activity before the several deep dips near the end of the Kepler observing time might be due to the fact that there was residual activity from a collision that occurred centuries ago.
            ___________________________________________________________________________________________________________

This observing season might provide a test of two periodicity predictions made a few years ago: 1601 days by Rafik Bourne and 1574 days by Gary Sacco. The following table may be useful in evaluating whether either of these two periodicities have support by this year's observations:

Table 1. Predictions for 2021 Observing Season Based on Competing Periodicities (1574 vs 1601 days)
Kepler Name Depth
JD4
2 x 1574
2x1601
Date for 1574
Date for 1601
Result for 1574
Result for 1601
D800
16 %
5626
8774
8828
2019 Oct 18
2019 Dec 11
1 % dip 8779
(eh?)
 2 % broad dip
(eh?)
D1520
21 %
6353
9501
9555
2021 Oct 14
2021 Dec 07
1 % dip Oct 18
(sort of good)
Nothing.
D1540
3 %
6373
9521
9575
2021 Nov 03
2021 Dec 27
Nothing
 Not what was expected
D1570
8 %
6401
9549
9603
2021 Dec 01
2022 Jan 24
Nothing
 (Won't assess)

So far this observing season there have been no dips exceeding 1.4 %. If one assumes that the same pattern of dips should repeat every 1574 or 1601 days then it could be said that support for the 1574 day periodicity is lacking, and it's too early to assess the 1601 day prediction. However, this is a too simplistic expectation. As stated above, we should think in terms of dip structure evolving on orbital timescales, such that 1) dip depth should be smaller each orbit, 2) there should be more of them, and 3) they should be spread out over greater date regions.
Keep this in mind for the following.

Here's my subjective assessment of the Gary Sacco 1574-day prediction: there is very little evidence for any of the 4 major Kepler dips repeating. As for the presence of an enhanced level of dipping for the interval JD4 = 9501 to 9549, I don't see any evidence for that. The only thing unusual for that date region is the presence of a uniform fade of ~ 0.8 %.

My subjective assessment of the Rafik Bourne & Bruce Gary 1601-day periodicity will have to wait until January. 

In an article submitted to MNRAS on 2017 Nov by Bourne, Gary and Plakhov (link) we made the following predictions:


Prediction 1 is partially confirmed. An abrupt 2 % rise in brightness began 4 months after this window of dates (on 2018 Apr 7). Prediction 2 will be evaluated later this year. Prediction 3 is a failure (a U-shaped fade of ~ 3 %, lasting up to 2 years, did not occur this year). Prediction 4 will be evaluated later this year, but so far this prediction is a failure. By the way, in this article we neglected to predict a fade corresponding to the return of the Kepler D800 dip (listed in above table as JD4 = 8828); there was indeed a significant dip centered on this date (as shown in Fig 1c, below). The reduction of D800 depth and increase in duration could be easily explained using an orbit shear argument (see Fig. 6.11 in "Speculations about physical model", at link below, for description).
            _______________________________________________________________________________________________________________

"Tabby's Star" continues to puzzle everyone!
We don't even know what's creating the dust clouds that produce brightness variations. The best guess is collision cascades model, but we really don't even know that for sure. We'll be handicapped in understanding this star system until a periodicity is established. About the only thing we can be sure of is that variability exists on a range of timescales. There are slow changes, with timescales of many months to many years, and faster changes, with timescales of less than a day to several days (referred to as "dips"). The dips have smaller depths at longer wavelengths, and this is surely evidence for the presence of a small size component of dust (< 0.5 micron radius).  This is still true for the 2021 observing season dips. We have some evidence for the long timescale variations to exhibit the same wavelength dependence. This is just a tentative result because we haven't yet established the "complete clearing" level. I continually hope to observe such a clearing again, to verify the earlier tentative result for a "complete clearing" level in late 2019.
_____________________________________________________________________________________________________________________________________ 

Links on this web page

    Basic info for KIC846  
    Long timescale variations (based on AAVSO and other sources)
    g', r' & i' magnitudes vs. date
  
  List of observing sessions (for the 2021 observing season)
    DASCH trend?
    Finder image (showing my ref stars)     

    References    

Links on other web pages
 

    HAO precision explained (580 ppm) 
    DASCH comment  

  This is the 12th web page devoted to my observations of Tabby's Star for the date interval 2021.10.29 to 2022.01.04.
 The 13th web page is located at http://www.brucegary.net/ts13/ 


  Go back to 11th of 12 web pages  (for dates 2021.04.25 to 2021.10.22)
  Go back to 10th of 12 web pages  (for dates 2020.09.27 to 2020.12.20) 
  Go back to  9th of 12 web pages  (for dates 2019.01.20 to 2020.01.11) 
  Go back to  8th of 12 web pages  (for dates 2018.10.10 to 2019.01.19)
  Go back to  7th of 12 web pages  (for dates 2018.08.12 to 2018.10.04)
  Go back to  6th of 12 web pages  (for dates 2018.02.25 to 2018.08.01)
  Go back to  5th of 12 web pages  (for dates 2017.11.13 to 2018.01.03)

  Go back to  4th of 12 web pages  (for dates 2017.09.21 to 2017.11.13)
  Go back to  3rd of 12 web pages  (for dates 2017.08.29 to 2017.09.18)
  Go back to  2nd of 12 web pages  (for dates 2017.06.18 to 2017.08.28)
  Go back to  1st of 12 web pages  (for dates 2014.05.02 to 2017.06.17)

    Reference Star Quality Assessment  (the 10 best stars out of 25 evaluated)  

Basic Info for KIC846

RA/DE = 20:06:15.44 +44:27:24.9
V-mag = 11.85, g'-mag =12.046, B-V = +0.51 (APASS)
Spectral type: F3V
T_eff = 6750 K
R = 1.58 R_sun (1.10e+6 km)
M = 1.43 M_sun (2.84e+30 Kg)
Observing season centered on Jul 24

Long Timescale Variations


Figure 1b.
A 14-month LC of ground-based observations that are in the "public domain" (and are good quality), normalized to the V magnitude scale of observer HBB.


Figure 1c.
A 2-year LC of ground-based observations that are in the "public domain" (such as from AASVO), normalized to the V magnitude scale of observer HBB.


Figure 1d. A 5-year light curve for V- and g'-band measurements (including magnitude offsets to achieve internal consistency).
.

Figure 1e.
15 years of space-based and ground-based observations that are in the "public domain" (such as from AASVO), normalized to the V magnitude scale of observer HBB. (The Kepler data are from Montet and Simon, 2016, which omits dips). 

The next paragraphs are a highly speculative attempt to explain the above brightness variations.

Imagine that Tabby's Star is orbited by a Jupiter-class planet that has recently been perturbed into an eccentric orbit that brought its periapsis into the region of an asteroid belt. Occasional asteroid/planet collisions produced a ring of debris centered on the planet orbit. Due to Keplerian orbit shear the debris is approximately uniform along the entire planet orbit. Imagine that this debris is in a torus-shaped orbit that is in approximate coincidence with the planet's orbit. The torus material could have a period of > 15 years. This debris ring produces long timescale brightness variations (e.g., months to years). On shorter timescales it is smooth, and I will refer to it as the "OOT for dips."

Now imagine that because this Jupiter-class planet enters the asteroid belt during its periapsis some asteroid orbits are perturbed, producing occasional asteroid/asteroid collisions. The debris produced by these collisions will orbit with a period similar to those of the asteroids (e.g., ~ 2 years). Due to radiation pressure from the star these dust clouds won't last long. Because of their shorter lifetimes (e.g., years) they won't have accumulated much Keplerian orbit shear, so during their lifetime they will be small clumps of dust. They orbit faster than the planet, and due to this, plus their smaller size, they transit the star on short timescales (e.g., a day to a week). These are the "dips" that are with respect to the "OOT for dips" level.

Both components of fading will be superimposed upon each other. On rare occasions the outer belt, or torus (that produces long timescale fades), will have clearings, allowing us to determine the true brightness of
Tabby's Star. I think this happened in late 2019. This unobstructed view corresponds to a brightness level shown in the my graphs by the green dotted line labeled "OOT (no debris)." 


Figure 1f. Illustration of two components of fading: outer orbit torus (long timescale) and inner orbit dips (short timescale).

In theory, the "torus" component of long timescale variations can differ at different observing wavelengths. This is because each wavelength is sampling a small range of particle sizes, and each part of the torus can have a distinct "particle size distribution." Whether this occurs in practice for the KIC846 torus is another matter that we might eventually be able to establish.
 
HAO g', r' and i' Mag's vs. Date


Figure 2a. A 4-month LC of HAO g' and r' magnitudes. The dotted traces are an attempt to represent the component of slow variations (timescale of months). The fast variations, or dip structure, is superimposed upon the slow variations.   


Figure 2b
HAO g', r' and i'-magnitudes for the past 14 months. The horizontal dashed lines are suggestions for OOT levels, set to the brightest magnitudes observed during the past 3 years (when I began observing in three bands).


Figure 2c. HAO g', r' and i'-magnitudes for the past two years. The r' and i' model traces are departures from the respective OOT levels multiplied by the g'-mag departures from the g' OOT level. The multipliers for r' band and i' band are 0.60  and 0.35. In other words, the r' and i' fade amounts are 60 and 35 % of the g' fade amounts. The slow variations are more noticeable in this graph.

The overall conclusion from these observations is that both the short-timescale dipping and long-timescale variations are caused by dust clouds dominated by small particles!

List of Observations (for all earlier observations, before 2021 May, go to link)

2022.01.04  
2022.01.03  
2021.12.30  
2021.12.29  
2021.12.27  
2021.12.24  
2021.12.23  
2021.12.21  
2021.12.20  
2021.12.19  
2021.12.18  
2021.12.17  
2021.12.16  
2021.12.13  
2021.12.12  
2021.12.11  
2021.12.09  
2021.12.08  
2021.12.07  
2021.12.06  
2021.12.04  
2021.12.03  
2021.12.02  
2021.12.01  
2021.11.30  
2021.11.29  
2021.11.28  
2021.11.26  
2021.11.23  
2021.11.21  
2021.11.20  
2021.11.19  
2021.11.18  
2021.11.16  
2021.11.15  
2021.11.14  
2021.11.13  
2021.11.12  
2021.11.11  
2021.11.10  
2021.11.09  
2021.11.08  
2021.11.07  
2021.11.06  
2021.11.05  
2021.11.04  
2021.11.03  
2021.11.02  
2021.11.01  
2021.10.31  
2021.10.30  
2021.10.29  
2021.10.22  

Daily Observing Session Information (most recent at top)


2022.01.04  


2022.01.03  


2021.12.30  


2021.12.29  


2021.12.27  


2021.12.24  


2021.12.23  


2021.12.21  


2021.12.20  


2021.12.19  


2021.12.18  


2021.12.17  


2021.12.16  


2021.12.13  


2021.12.12  


2021.12.11  


2021.12.09  


2021.12.08  


2021.12.07  


2021.12.06  


2021.12.04  


I'm suspending processing of r' or i' image sets (I need a break).

2021.12.03  


2021.12.02  


2021.12.01  


2021.11.30  


2021.11.29  


2021.11.28  


2021.11.26  


2021.11.23  


Disregard the first set of measurements; they were made with a shorter exposure and must not share the same systematics as the longer exposures.


2021.11.21  


2021.11.20  


2021.11.19  


2021.11.18  


2021.11.16  


2021.11.15  


2021.11.14  


2021.11.13  


2021.11.12  


2021.11.11  


2021.11.10  


2021.11.09  


2021.11.08  


2021.11.07  


2021.11.06  

Clouds were ever-present, so data quality is questionable.


2021.11.05  


2021.11.04  


2021.11.03  


2021.11.02  


2021.11.01  


2021.10.31  


2021.10.30  


2021.10.29  


2021.10.22  


Alleged Century Trend

It has been suggested that during the last centtury KIC846 has faded. This allegation is based on (ongoing) readings
performed at Harvard of an archive of photographic plates. Here are the measurements that the alleged fading trend is based on:


Figure 99. DASCH data with horizontal line fits for date intervals corresponding to before and after the "Menzel gap." The STDEV for these two date intervals is 0.19 and 0.12 mag. The DASCH measurements are of plates with mostly blue response. New plates were used after the Menzel gap, with a different spectral sensitivity; also, some lenses were changed. The set of dots on the right are HAO V-band (and g'-band) measurements (N = 227) with a 0.32 mag adjustment (to place them close to the DASCH B-mag values).

If you see a trend in KIC846 brightness then you have a better imagination than me.

Finder Image
 

Figure 5.1. Finder image showing the 17 reference stars that I use. KIC846 is in the blue square. FOV = 15.6 x 10.5 'arc, NE at upper-left.


Data Exchange Files

    HAO g' & HAO r' & HAO i' (Bruce Gary, AZ, USA) 
    AAVSO HBB V & HBB B (Barbara Harris, FL, USA)
    AAVSO HJW V & HJW B (John Hall, CO, USA)
    AAVSO DFS V & DFS B (Dufoer Sjoerd, Belgium)
    AAVSO SGEA V & SGEA B (?)
    more to come ...


My Collaboration Policy

At my age of 80 I'm entitled to have fun and avoid work. Photometric observing and figuring things out are fun. Writing papers is work. So if anyone wants to use any of my observations for a publication you're welcome to do so. But please don't invite me for co-authorship!

My light curve observations are "in the public domain." This means anyone can and may download my LC observations, and use (or misuse) any of that data for whatever purpose. If my data is essential to any publication just mention this in the acknowledgement section.
 

References

    Gonzalez, M. J. Martinez and 15 others, 2108, "High-Resolution Spectroscopy of Boyajian's Star During Optical Dimming Events," arXiv:1812.06837
    Wright, Jason T., "A Reassessment of Families of Solutions to the Puzzle of Boyajian's Star," arXiv  (a 1.1-page paper)
    Schaefer, Bradely E., Rory O. Bentley, Tabetha S. Boyajian and 19 others, 2018, "The KIC 8462852 Light Curve From 2015.75 to 2018.18 Shows a Variable Secular Decline," submitted to MNRAS, arXiv 
    Bodman, Eva, Jason Wright, Tabetha Boyajian, Tyler Ellis, 2018, "The Variable Wavelength Dependence of the Dipping event of KIC 8462852," submitted to AJ, arXiv.
    Bodman, Eva, 2018, "The Transiting Dust of Boyajian's Star," AAS presentation, link 
    Yin, Yao and Alejandro Wilcox, 2018, "Multiband Lightcurve of Tabby's Star: Observations & Modeling," AAS presentation, link (navigate down, etc)
    Sacco, Gary, Linh D. Ngo and Julien Modolo, 2018, "A 1574-Day Periodicity of Transits Orbiting KIC 8462552," JAAVSO, #3327, link
    Boyajian, Tabetha S. and 198 others, 2018, "The First Post-Kepler Brightness Dips of KIC 8462852," arXiv 
    Deeg, H. J., R. Alonso, D. Nespral & Tabetha Boyajian, 2018, "Non-grey dimming events of KIC 8462852 from GTC spectrophotometry" arXiv 
    Bourne, R., B. L. Gary and A. Plakhov, 2018, "Recent Photometric Monitoring of KIC 8462852, the Detection of a Potential Repeat of the Kepler Day 1540 Dip and a Plausible Model," MNAS;  arXiv:1711.10612     
    Bourne, Rafik and Bruce Gary, 2017, "KIC 8462852: Potential repeat of the Kepler day 1540 dip in August 2017," submitted to AAS Research Notes, preprint: arXiv:1711.07472
    Xu, S., S. Rappaport, R. van Lieshout & 35 others, 2017, "A dearth of small particles in the transiting material around the white dwarf WD 1145+017," approved for publication by MNRAS link, preprint arXiv: 1711.06960 
    Gary, Bruce and Rafik Bourne, 2017, "KIC 8462852 Brightness Pattern Repeating Every 1600 Days," published by Research Notes of the AAS at link; preprint at arXiv:1711.04205
    Gary, B. L., S. Rappaport, T. G. Kaye, R. Alonso, J.-F. Hambsch, 2017, "WD 1145+017 Photometric Observations During Eight Months of High Activity", MNRAS, 2017, 465, 3267-3280; arXiv
    Neslusan, L. and J. & Budaj, 2016, "Mysterious Eclipses in the Light Curve of KIC8462852: a Possible Explanation, arXiv: 1612.06121v2  (a "tour de force"; I highly recommend this publication)
    Neslusan & Budaj web site with animation of their way of explaining Kepler D1540 dip:  http://www.astro.sk/~budaj/kic8462.html
    Wyatt, W. C., R. van Lieshout, G. M. Kennedy, T. S. Boyajian, 2017, "Modeling the KIC8462852 light curves: compatibility of the dips and secular dimming with an exocomet interpretation," submitted to MNRAS, arXiv  
    Grindlay interview about Schaefer's assertion that KIC846 exhibited a century long fade using DASCH data: link
    Hippke, Michael and Daniel Angerhausen, 2017, "The year-long flux variations in Boyajian's star are asymmetric or aperiodic," submitted to ApJL, arXiv 
    Sacco, G., L. Ngo and J. Modolo, 2017, "A 1574-day Periodicity of Transits Orbiting KIC 8462852," arXiv
    Rappaport, S., B. L. Gary, A. Vanerdurg, S. Xu, D. Pooley and K. Mukai, 2017, "WD 1145+017: Optical Activity During 2016-2017 and Limits on the X-Ray Flux," arXiv, Mon. Not. Royal Astron. Soc.
    Steele, I. A. & 4 others, 2017, "Optical Polarimetry of KIC 8462852 in May-August 2017,"MNRAS (accepted), arXiv.
    Simon, Joshua D., Benjamen J. Shappee and 6 others, "Where is the Flux Going? The Long-Term Photometric Variability of Boyajian's Star," arXiv:1708.07822 
    Meng, Huan Y. A., G. Rieke and 12 others (including Boyajian), "Extinction and the Dimming of KIC 8462852," arXiv: 1708.07556  
    Sucerquita, M., Alvarado-Montes, J.A. and two others, "Anomalous Lightcurves of Young Tilted Exorings," arXiv: 1708.04600   Also: New Scientist link and Universe Today link.
    Rappaport, S., A. Vanderburg and 9 others, "Likely Transiting Exocomets Detected by Kepler," arXiv: 1708.06069 
    Montet, Benjamin T. and Joshua D. Simon, 2016, arXiv 
    Boyajian et al, 2015, MNRAS, "Planet Hunters X. KIC 8462852 - Where's the flux?" link
    Ballesteros, F. J., P. Arnalte-Mur, A. Fernandez-Soto and V. J. Martinez, 2017, "KIC8462852: Will the Trojans Return in 2011?", arXiv
    Washington Post article, 2015.10.15: link
    AAVSO Campaign Notice requesting KIC646 observations
    AAVSO LC Generator https://www.aavso.org/data/lcg (enter KIC 8462852)
    Web page tutorial: Tips for amateurs observating faint asteroids (useful for any photometry observing)
    Book: Exoplanet Observing for Amateurs, Gary (2014): link (useful for any photometry observing) 
    wikipedia description of Tabby's Star  
    My web pages master list, resume


    B L G a r y at u m i c h dot e d u    Hereford Arizona Observatory    resume 
 
This site opened: 
2021.10.29. 
Nothing on this web page is copyrighted.