KIC 8462852 Hereford Arizona Observatory Photometry Observations #9
Bruce Gary, Last updated: 2020.10.05 23 UT

The current dip is the 7th one deeper than 0.5 % since Oct 20 (a mere 10 weeks ago). The "dip activity level" was quite high, averaging ~ 2.0 % a couple weeks ago, but appears to be recovering (depth now is < 0.5 %). If all dips were moved in time to the same date (and assuming they were all produced by dust clouds with low optical depth), they would produce a single dip (with an assumed typical width) having a depth of 11 %! In other words, the dip activity during the past 10 weeks has been comparable to the dip activity two years ago, or even 7 years ago when Kepler was observing. It's just that the recent set of 7 dips are spread-out, as if they were produced many years ago at one orbit location and have been spreading apart ever since. End of observing season, so no more observations for a few months.
_____________________________________________________________________________________________________________________________________ 

Links on this web page

    g', r' & i' magnitudes vs. date (for last 2 months & last year) 
  
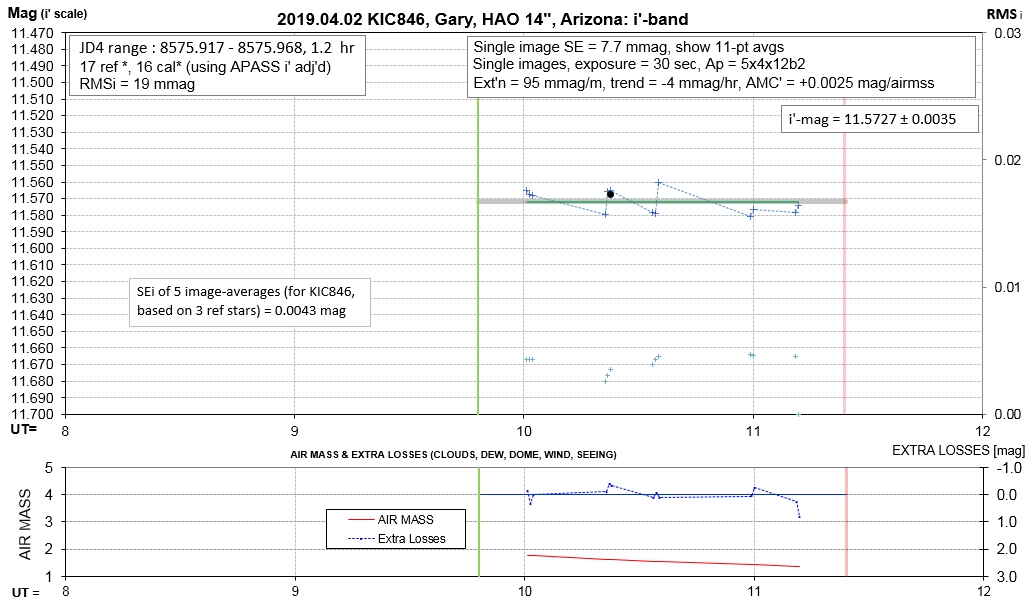
  List of observing sessions (starting 2019 Oct 04)
    Mag/mag scatter diagrams  (r' vs. g')
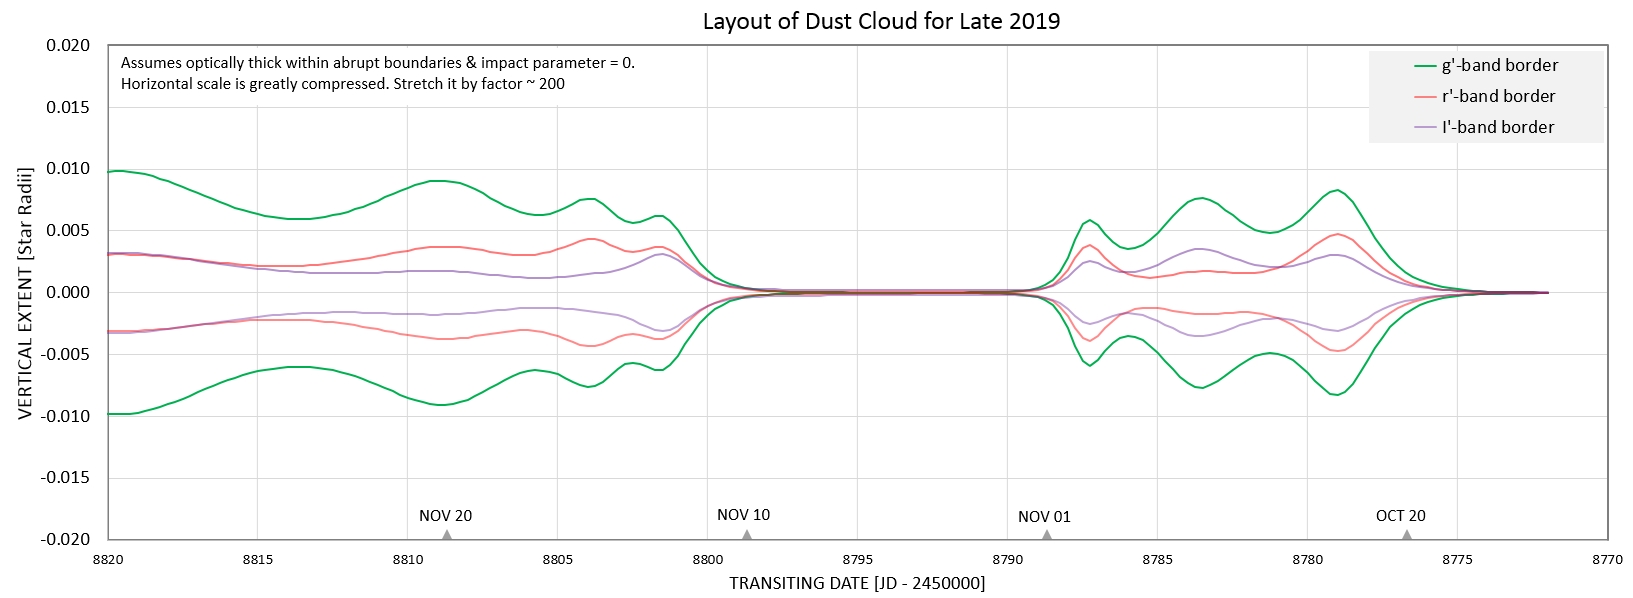
    Dust cloud layout (for each band)  
    u' attempt (unexplained failure to achieve usable SEs)
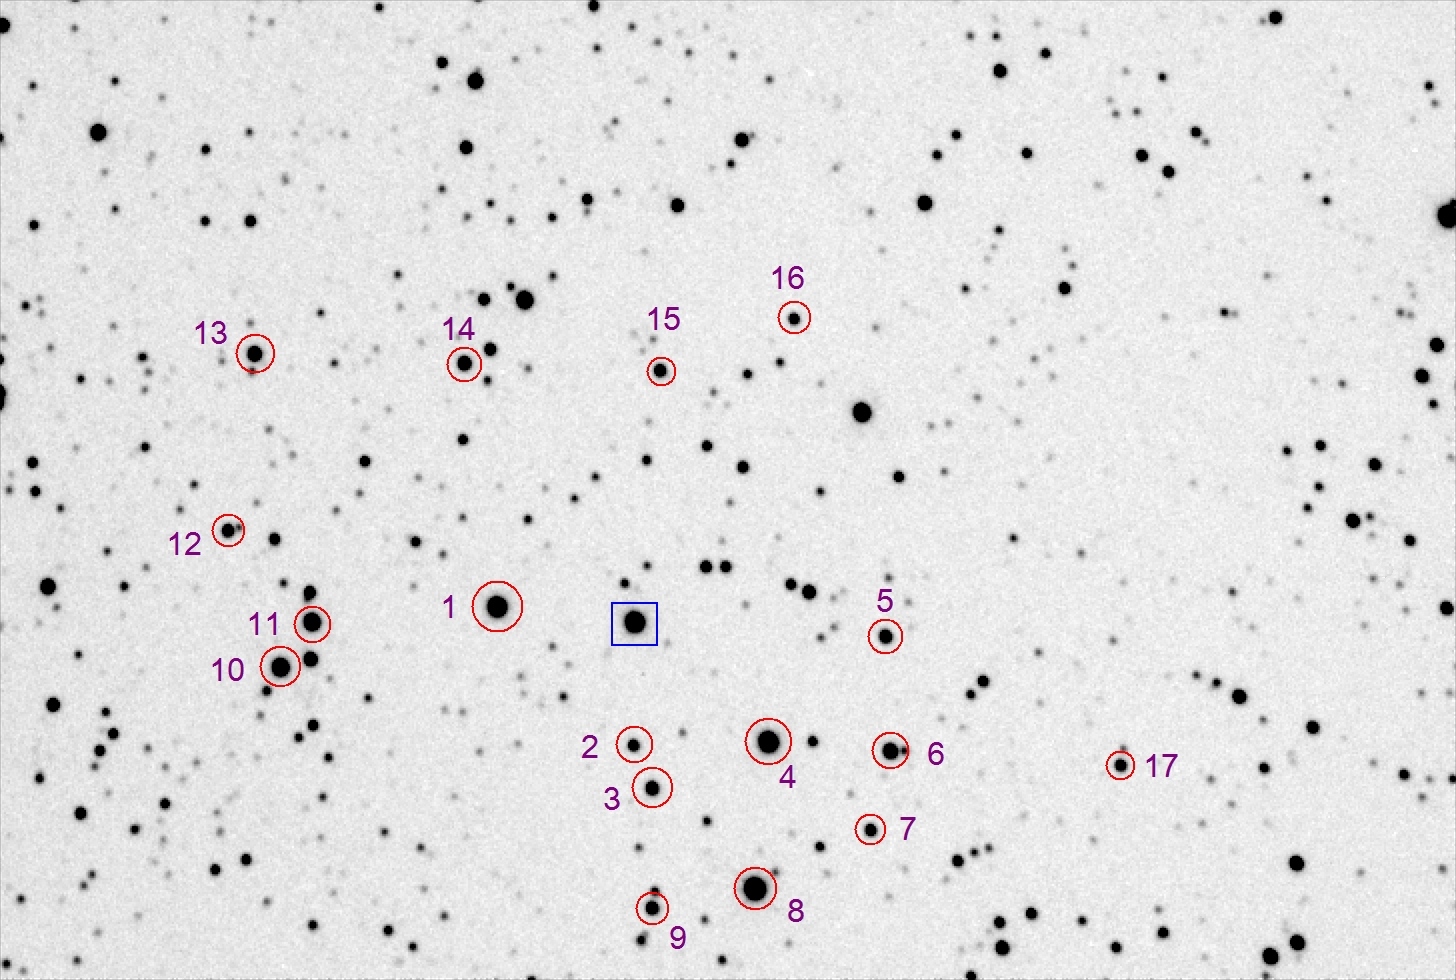
    Finder image (showing my ref stars) 
    The Big Picture .
    My collaboration policy
    References    

Links on another web page
 

    Comparison with AAVSO observations   
    HAO precision explained (580 ppm) 
    DASCH comment  

    This is the 9th web pages devoted to my observations of Tabby's Star for the date interval 2019.10.20 to 2020.01.11.
  The 10th edition (for 2020.09.27 and later) is available at http://www.brucegary.net/ts10/

  Go back to 8th of 9 web pages  (for dates 2018.10.10 to 2019.01.19)
  Go back to 7th of 9 web pages  (for dates 2018.08.12 to 2018.10.04)
  Go back to 6th of 9 web pages  (for dates 2018.02.25 to 2018.08.01)
  Go back to 5th of 9 web pages  (for dates 2017.11.13 to 2018.01.03)

  Go back to 4th of 9 web pages  (for dates 2017.09.21 to 2017.11.13)
  Go back to 3rd of 9 web pages  (for dates 2017.08.29 to 2017.09.18)
  Go back to 2nd of 9 web pages  (for dates 2017.06.18 to 2017.08.28)
  Go back to 1st of 9 web pages  (for dates 2014.05.02 to 2017.06.17)

    Reference Star Quality Assessment  (the 10 best stars out of 25 evaluated)  
 
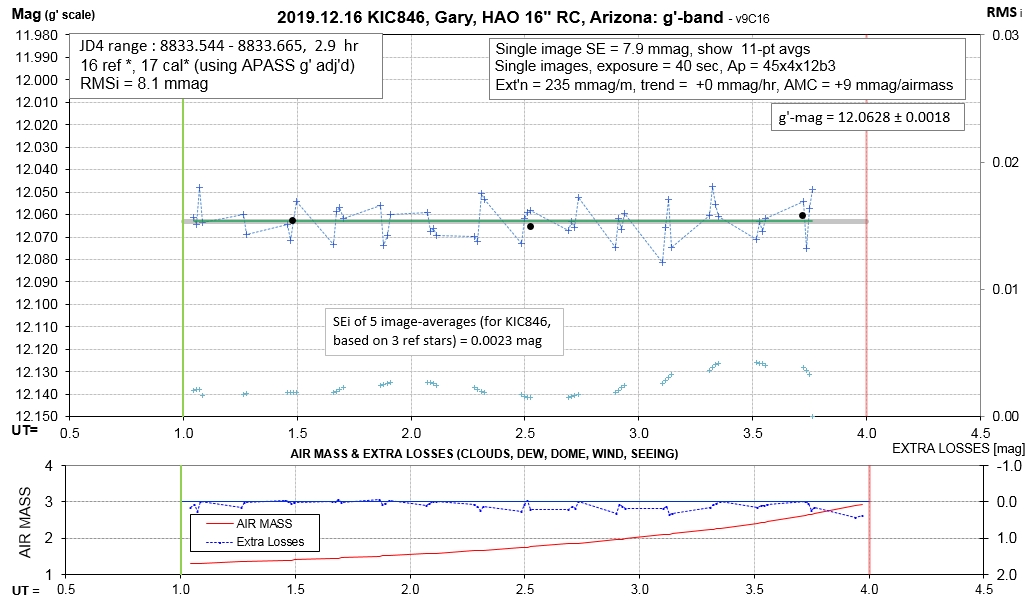
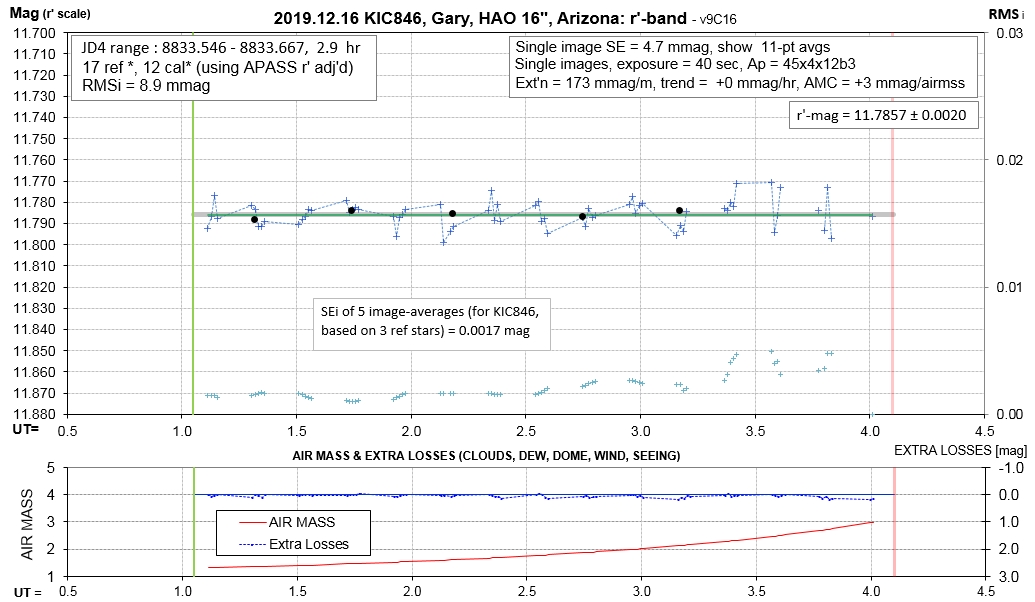
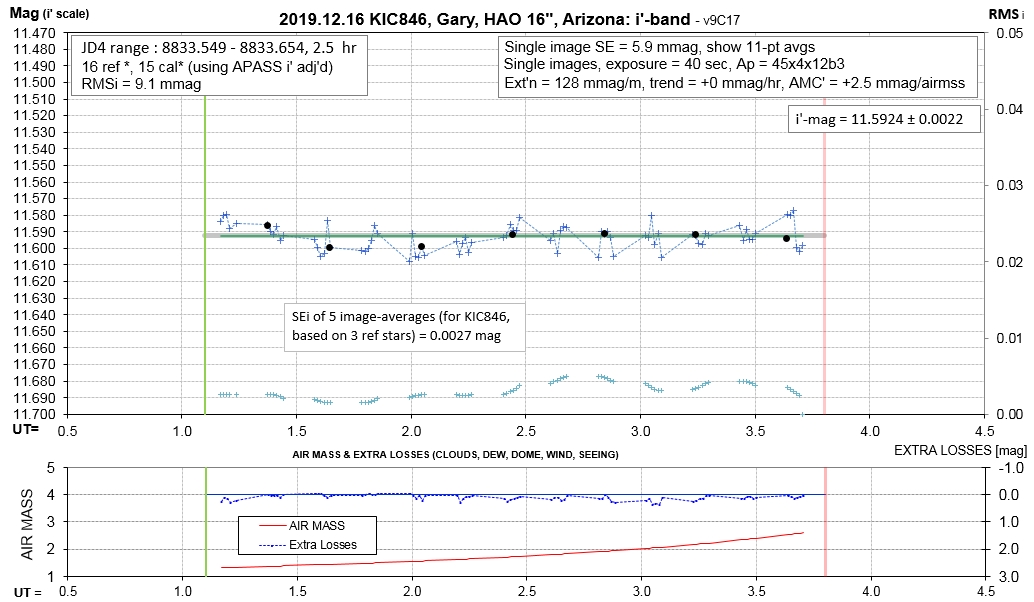
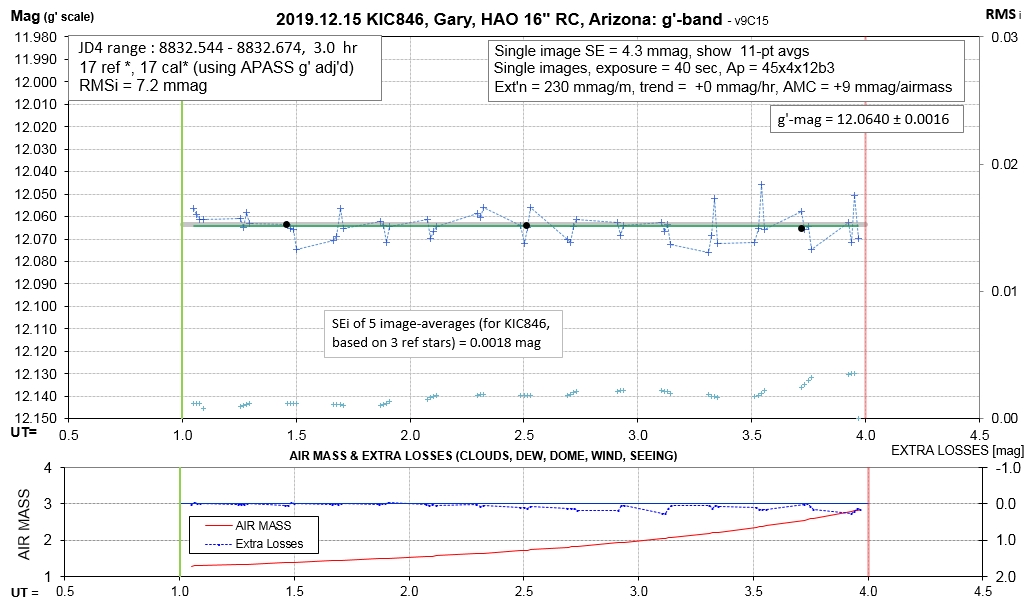
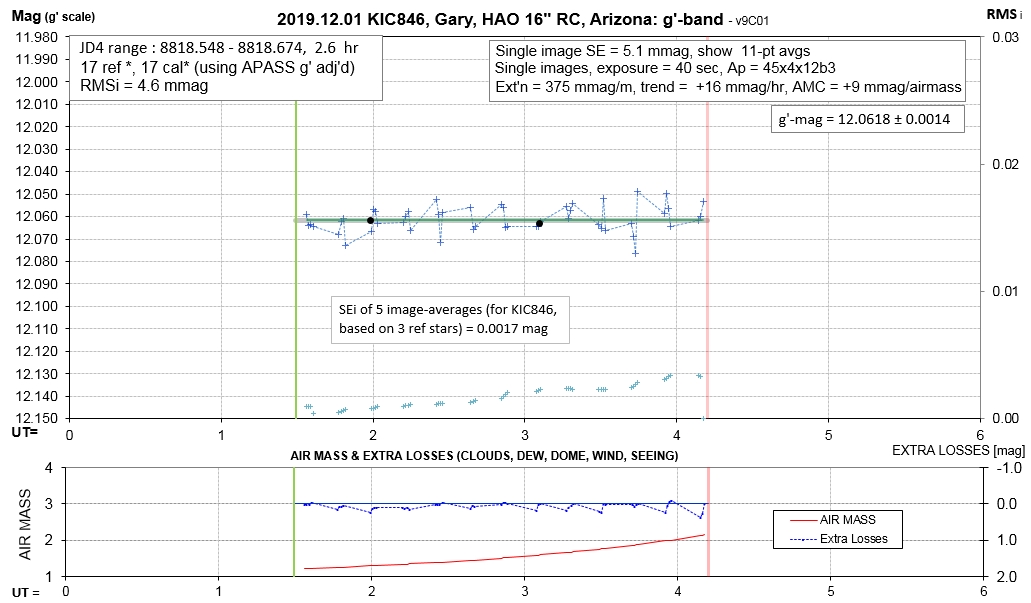
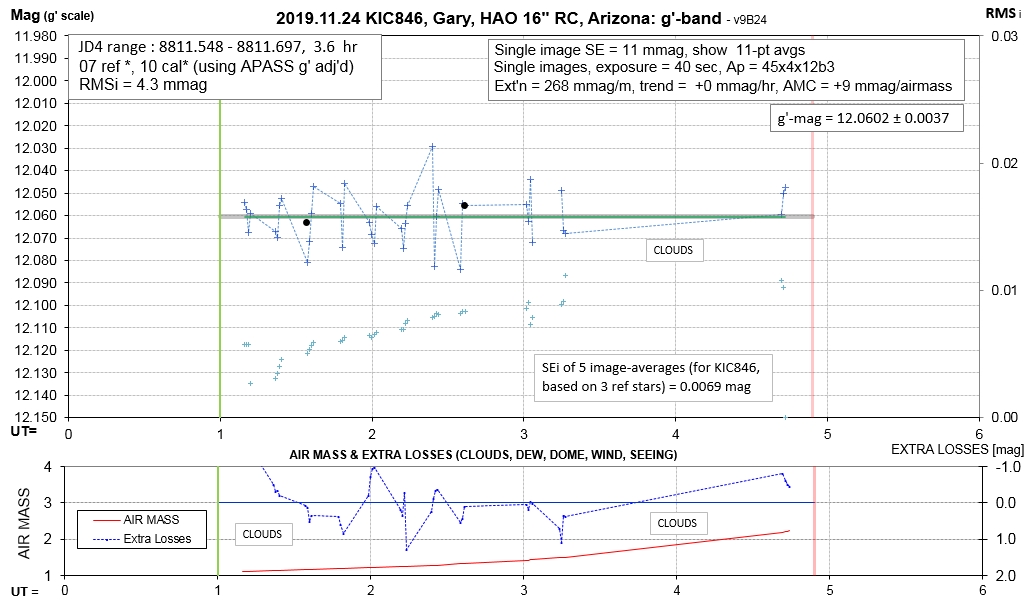
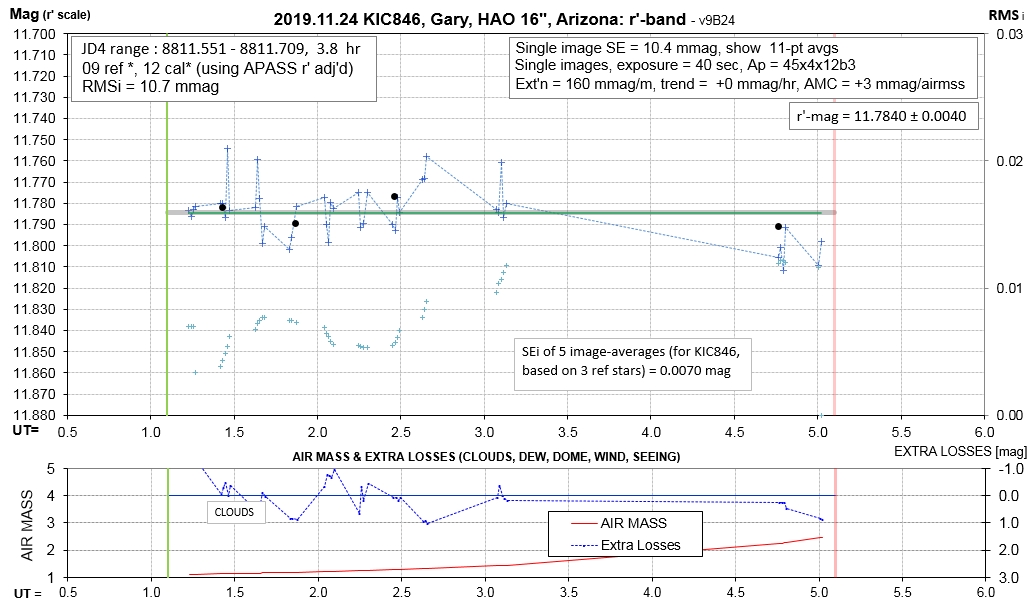
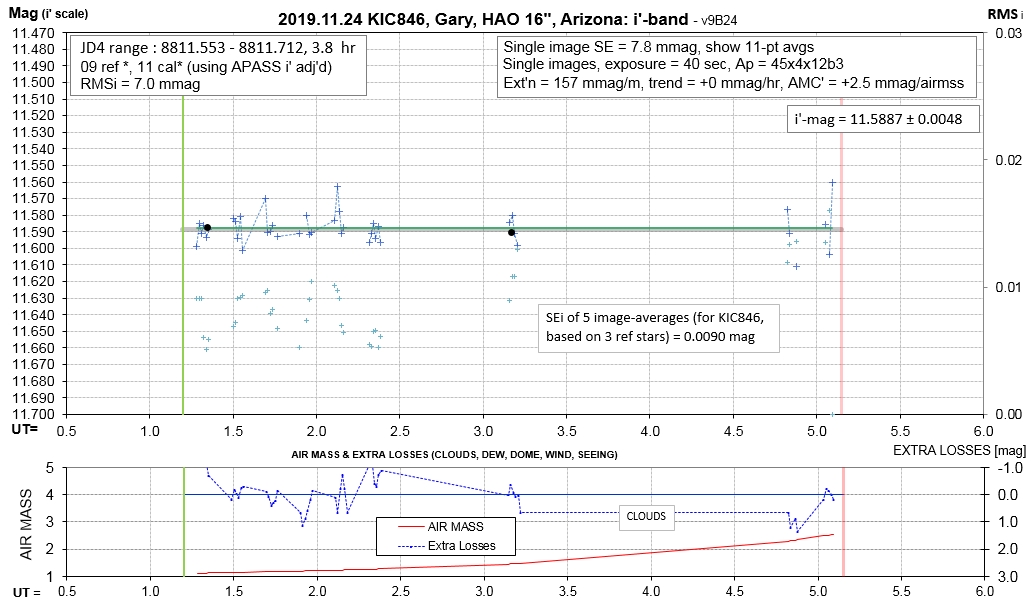
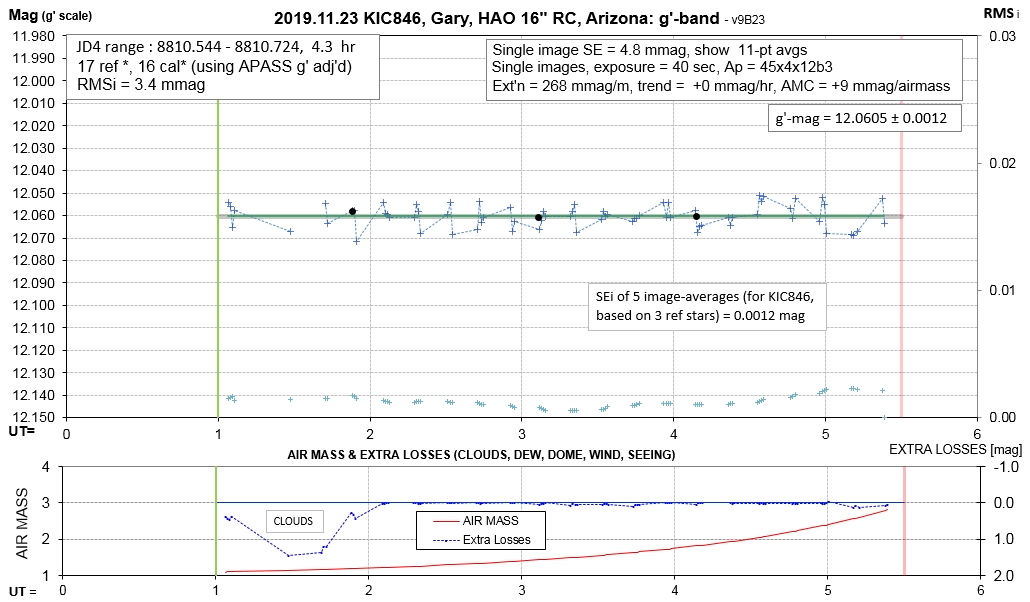
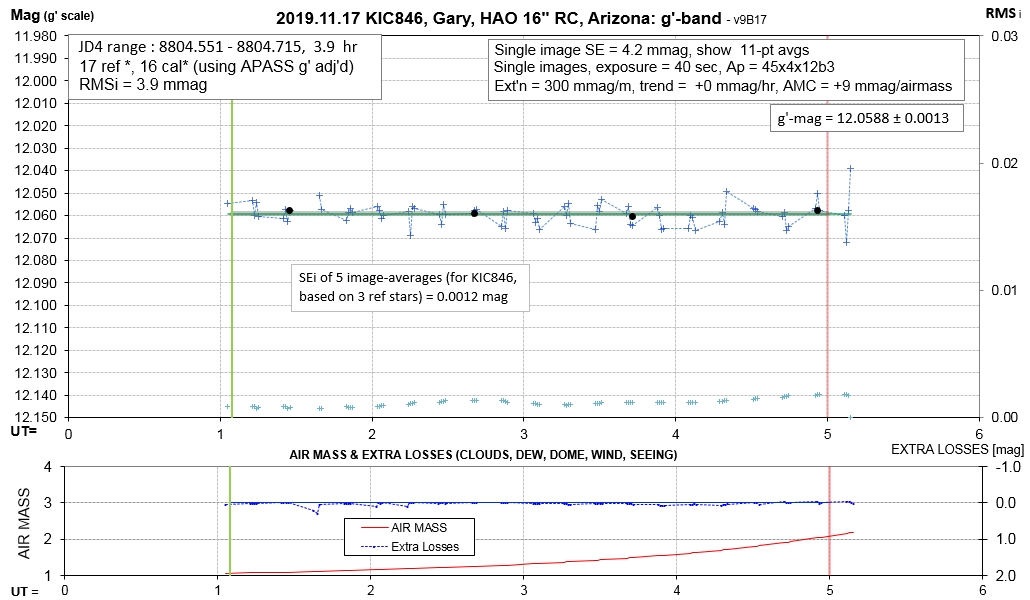
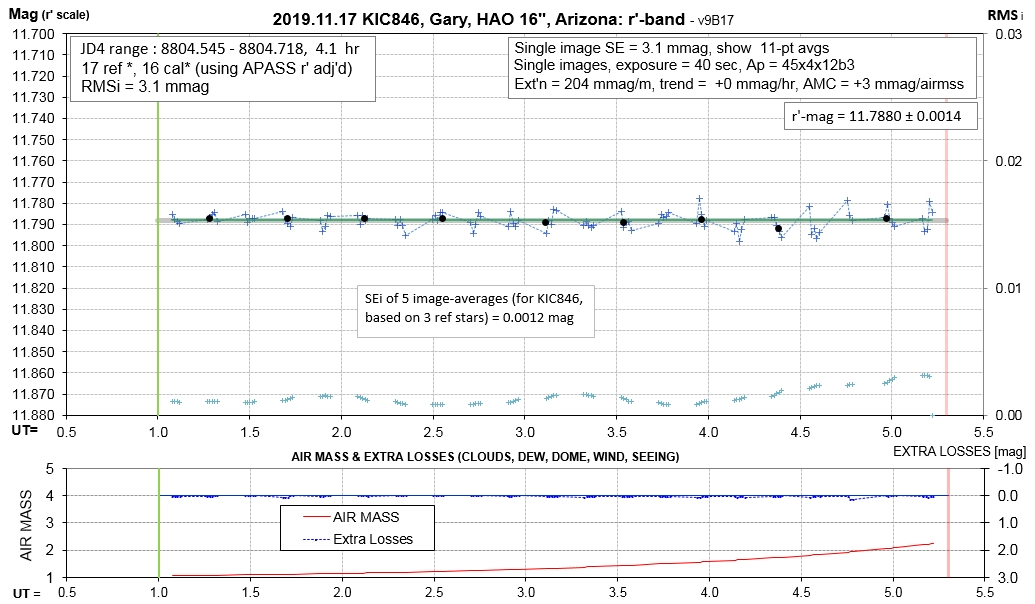
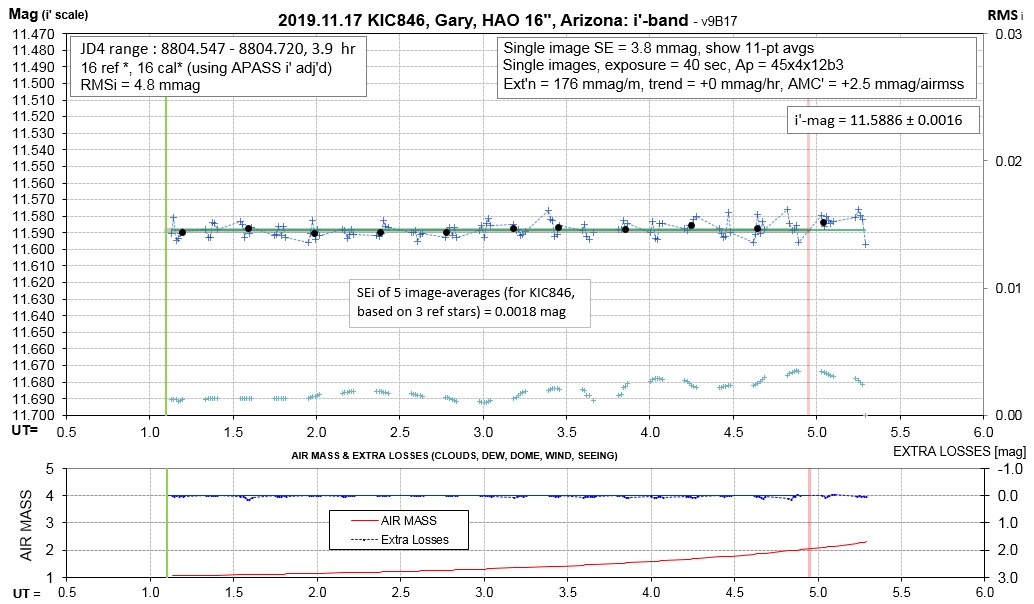
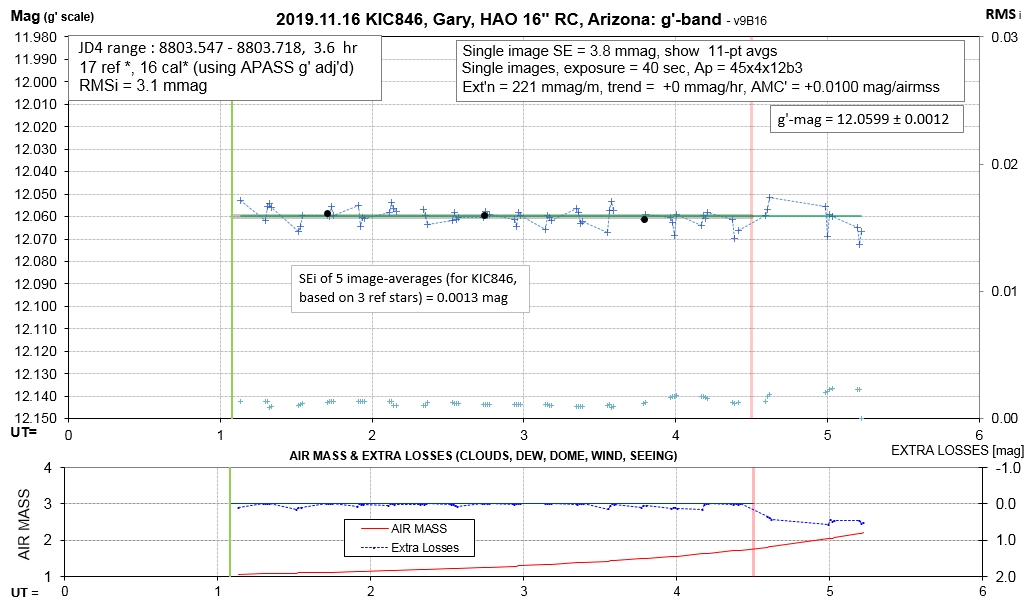
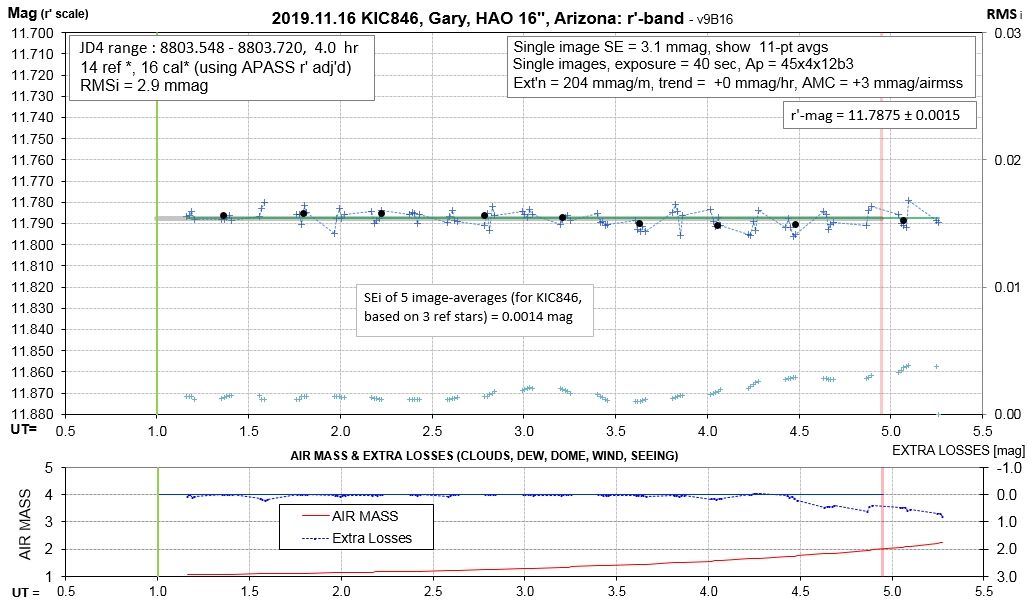
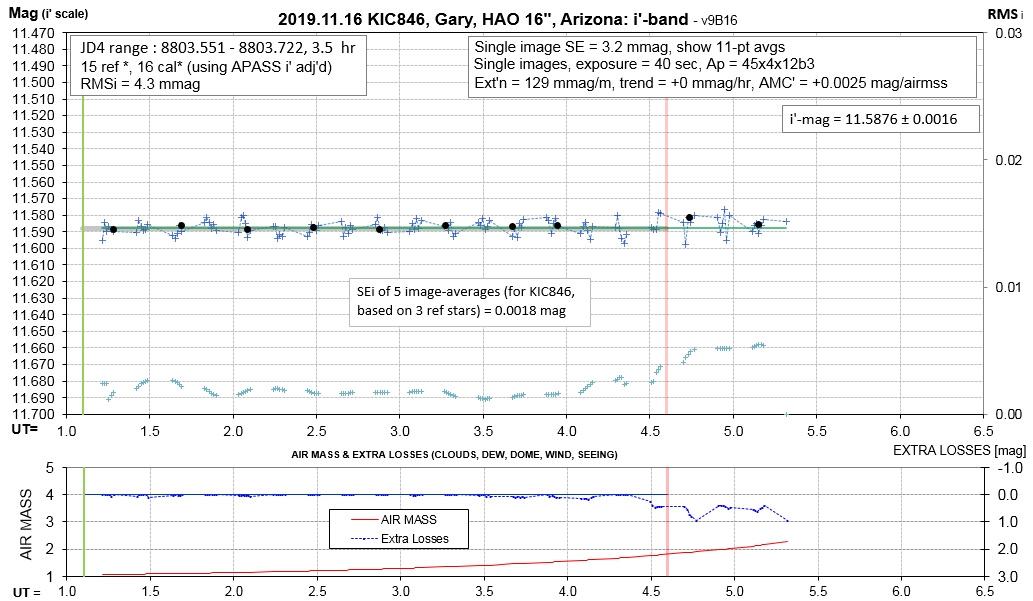
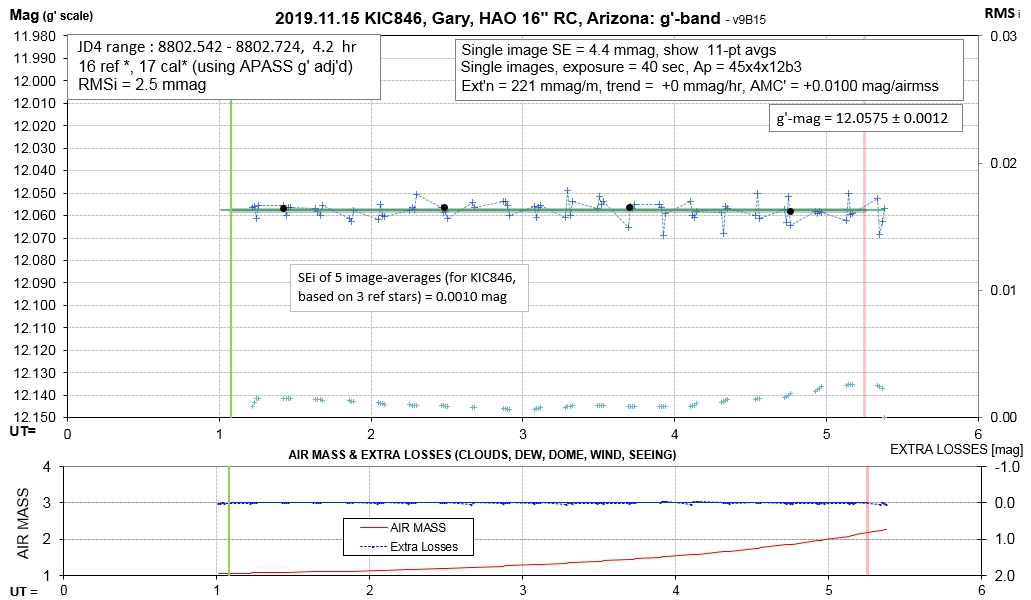
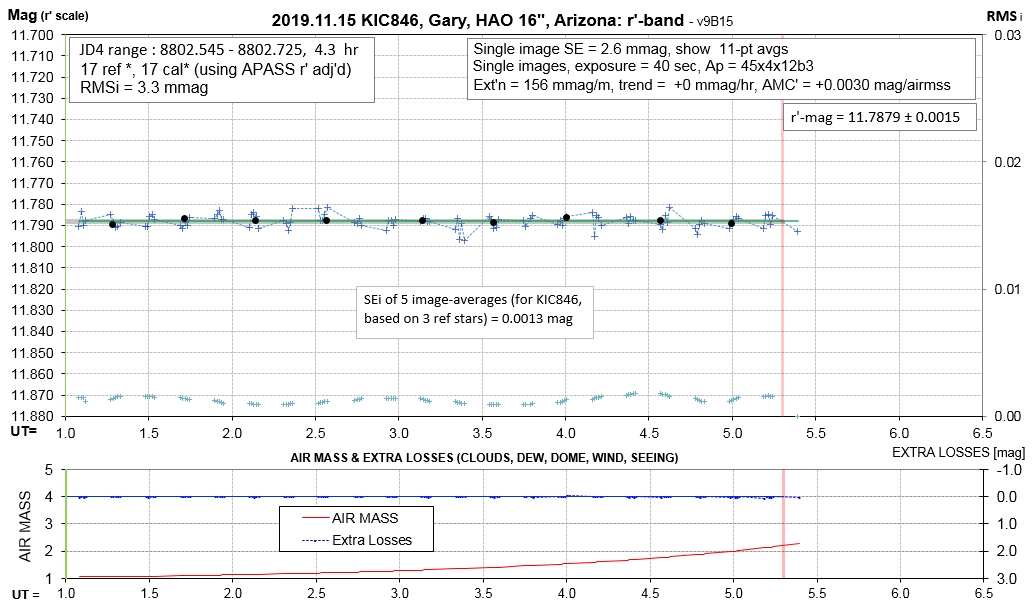
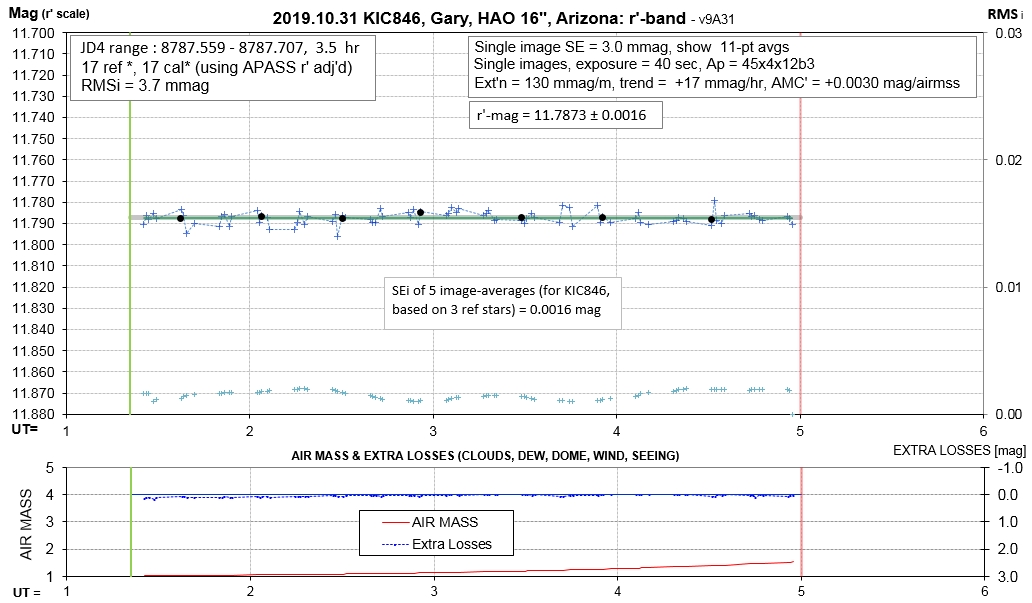
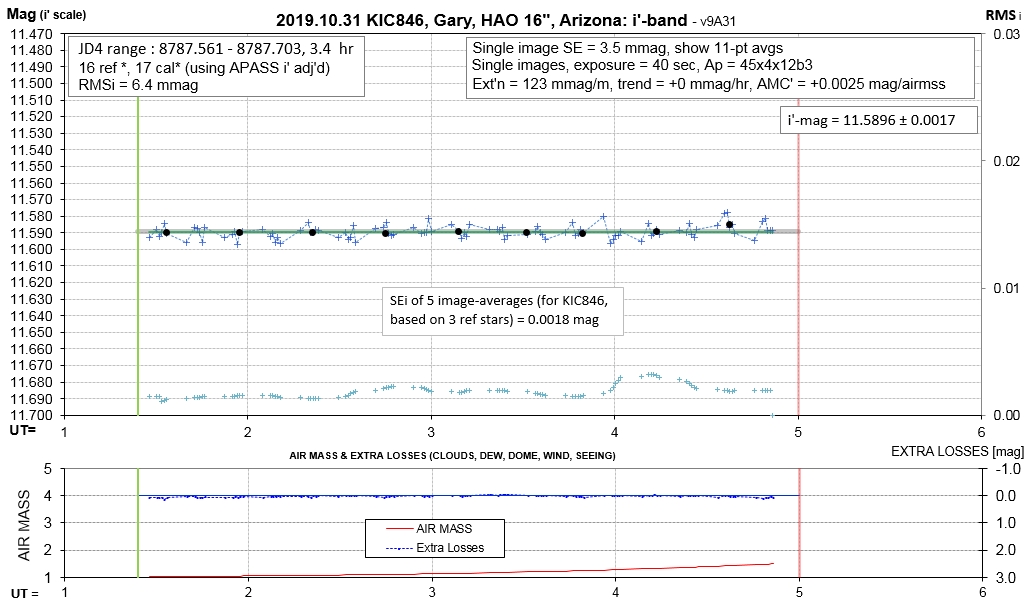
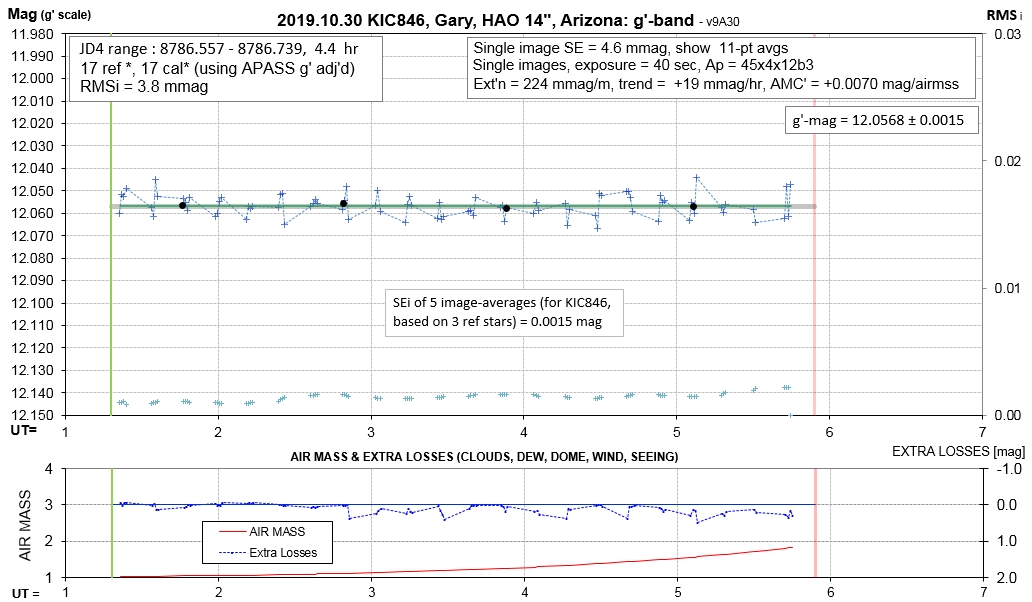
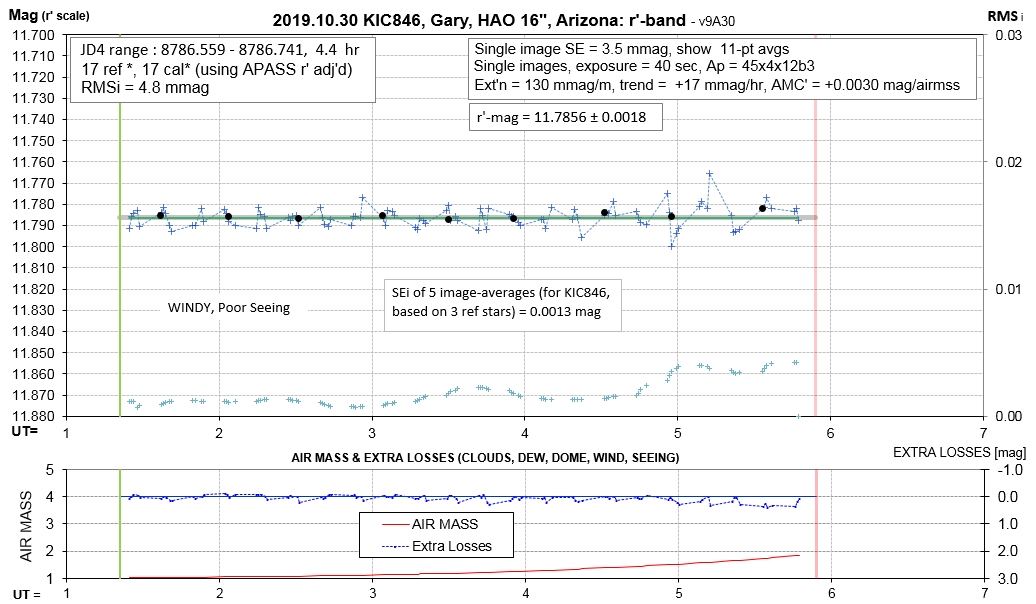
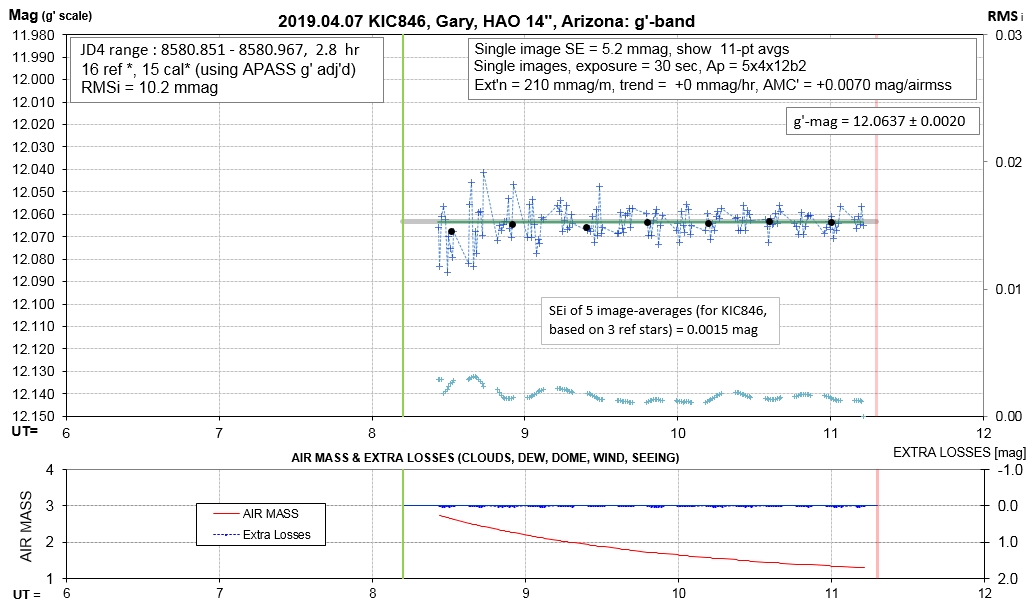
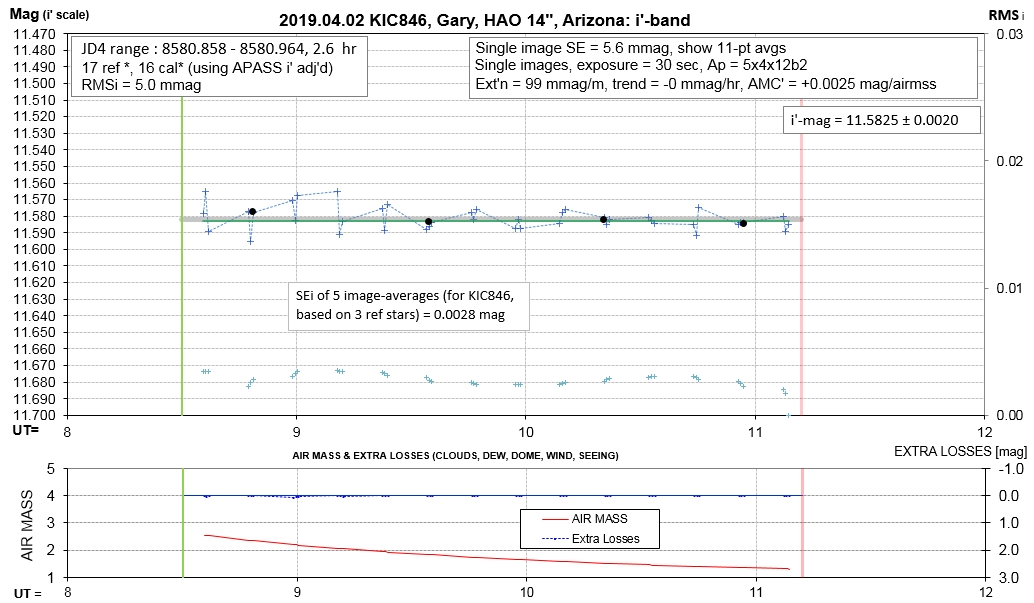
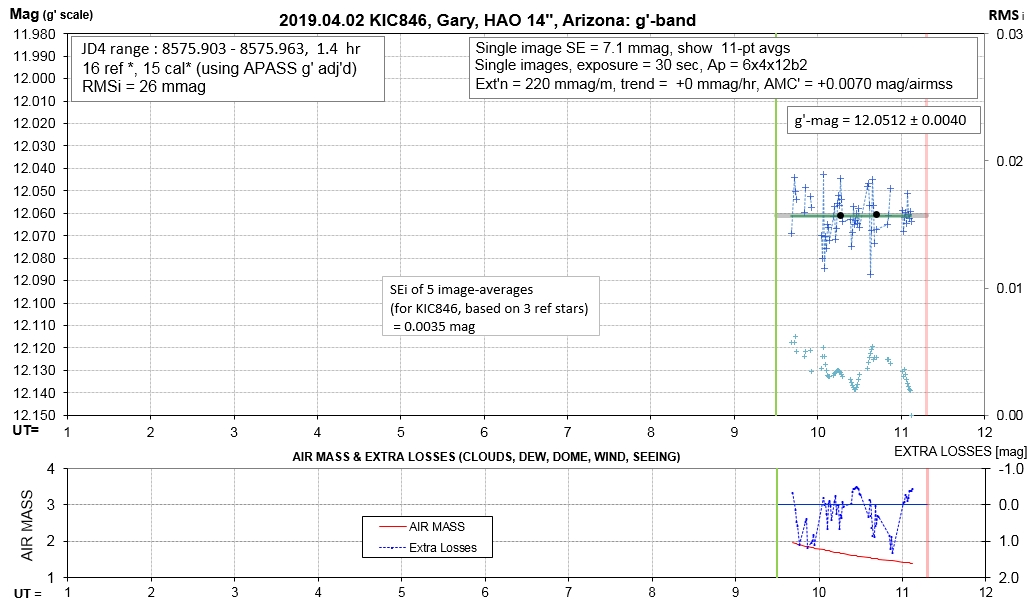
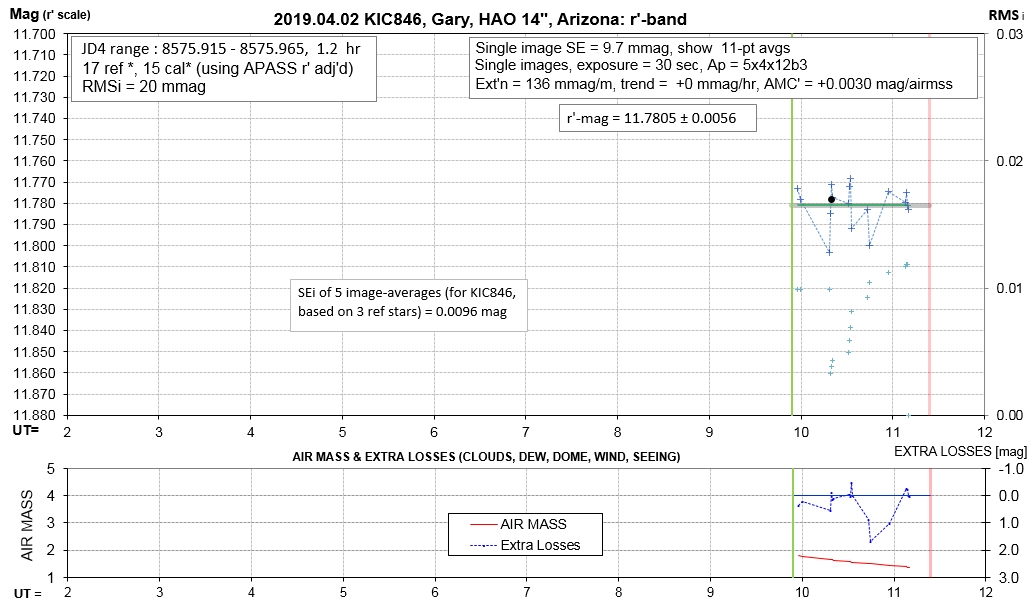
g', r' and i' Mag's vs. Date


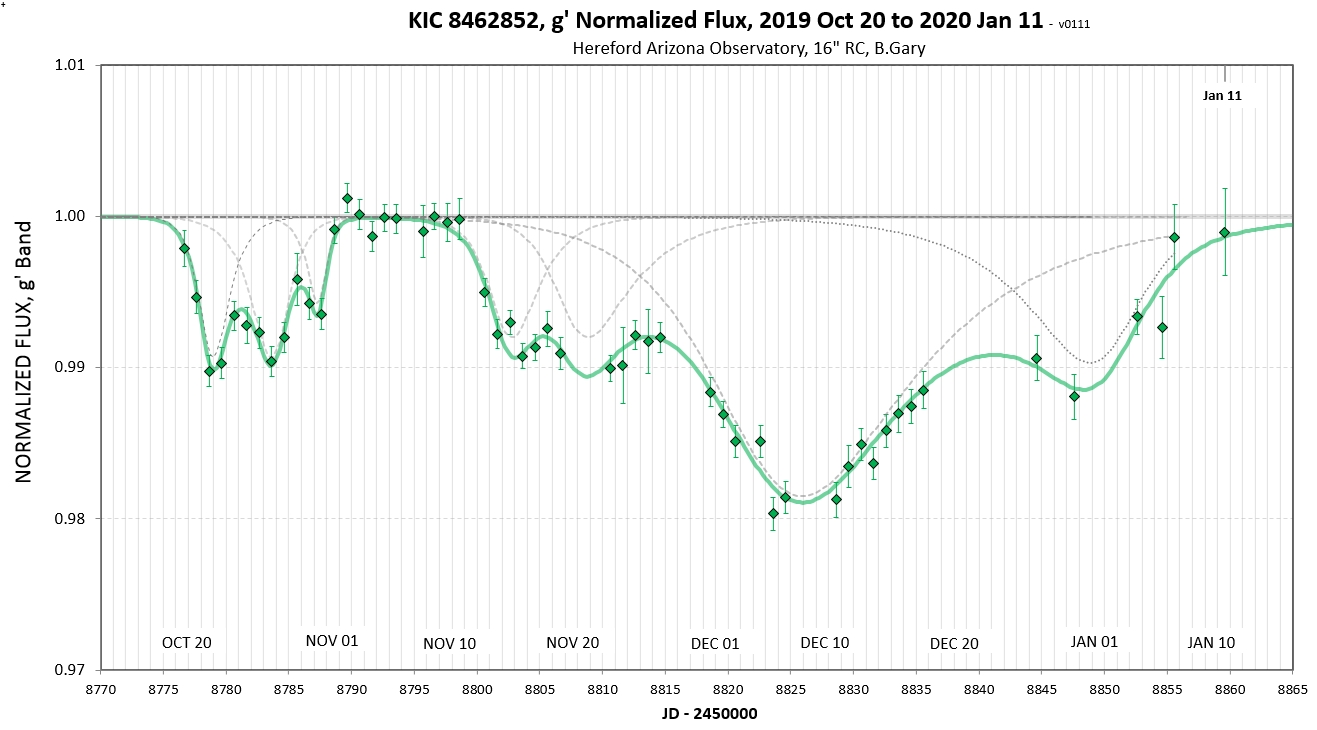
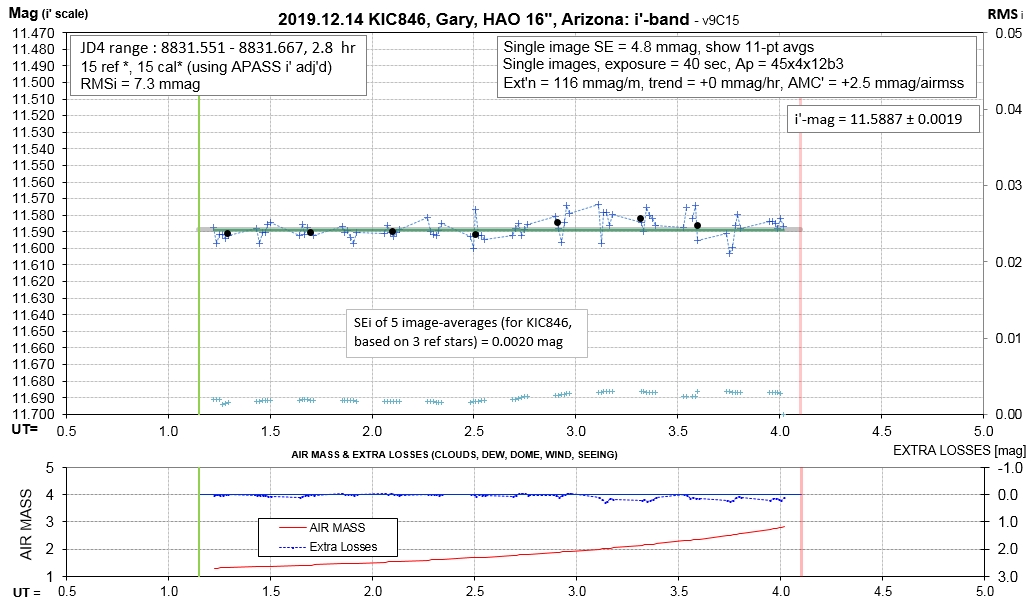
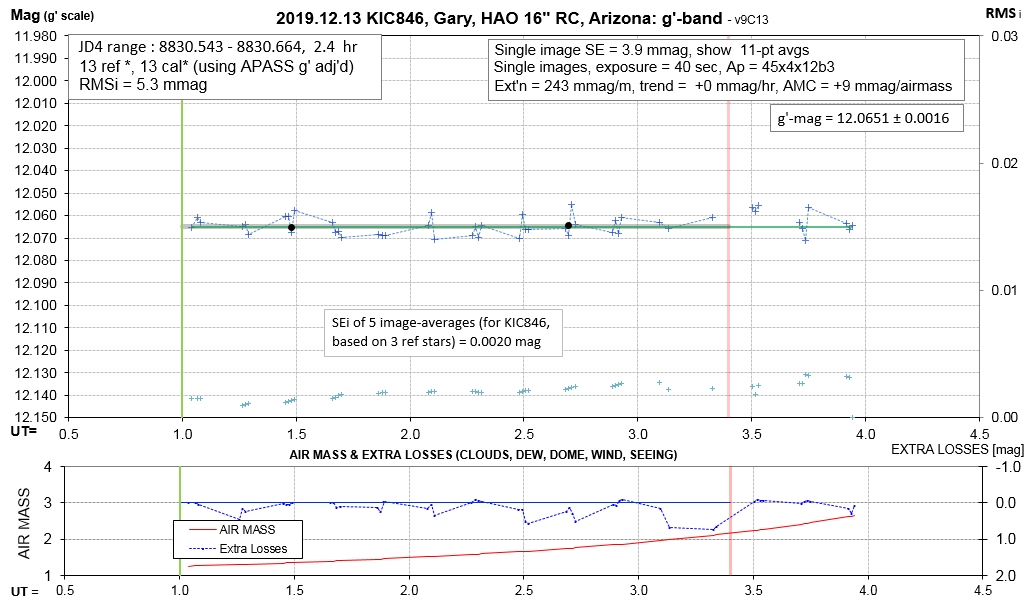
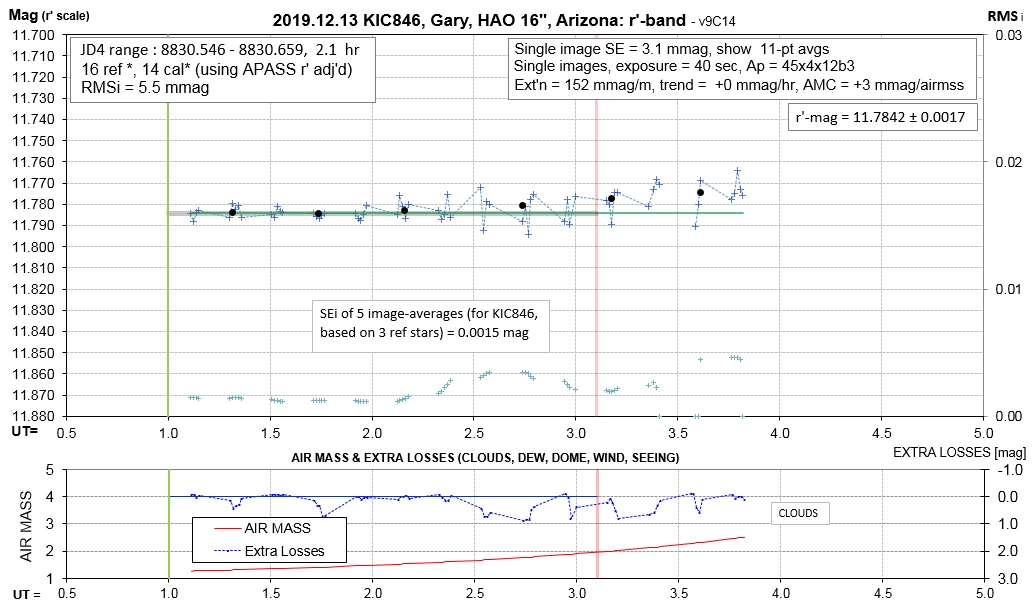
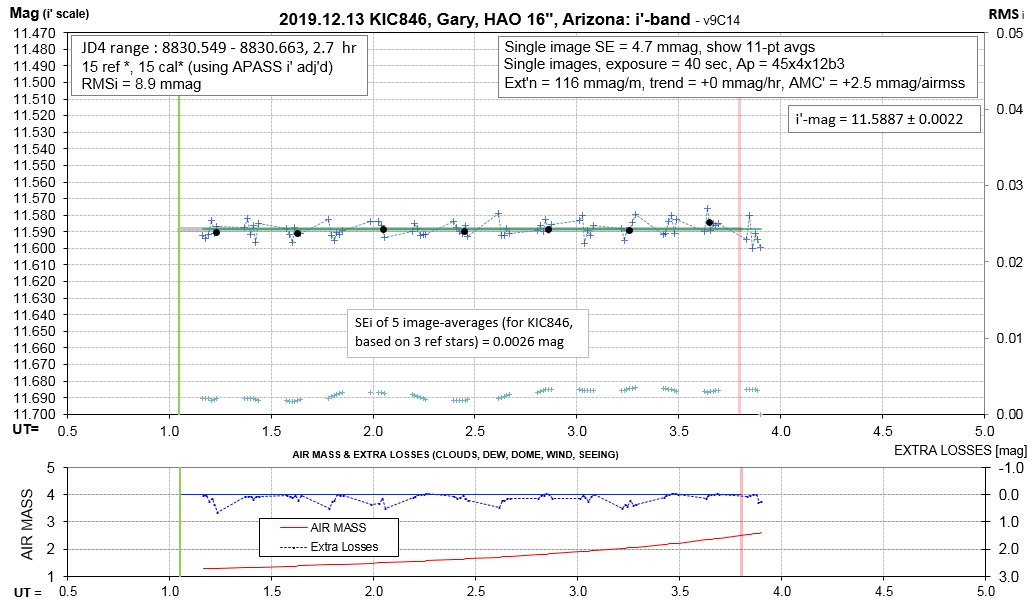
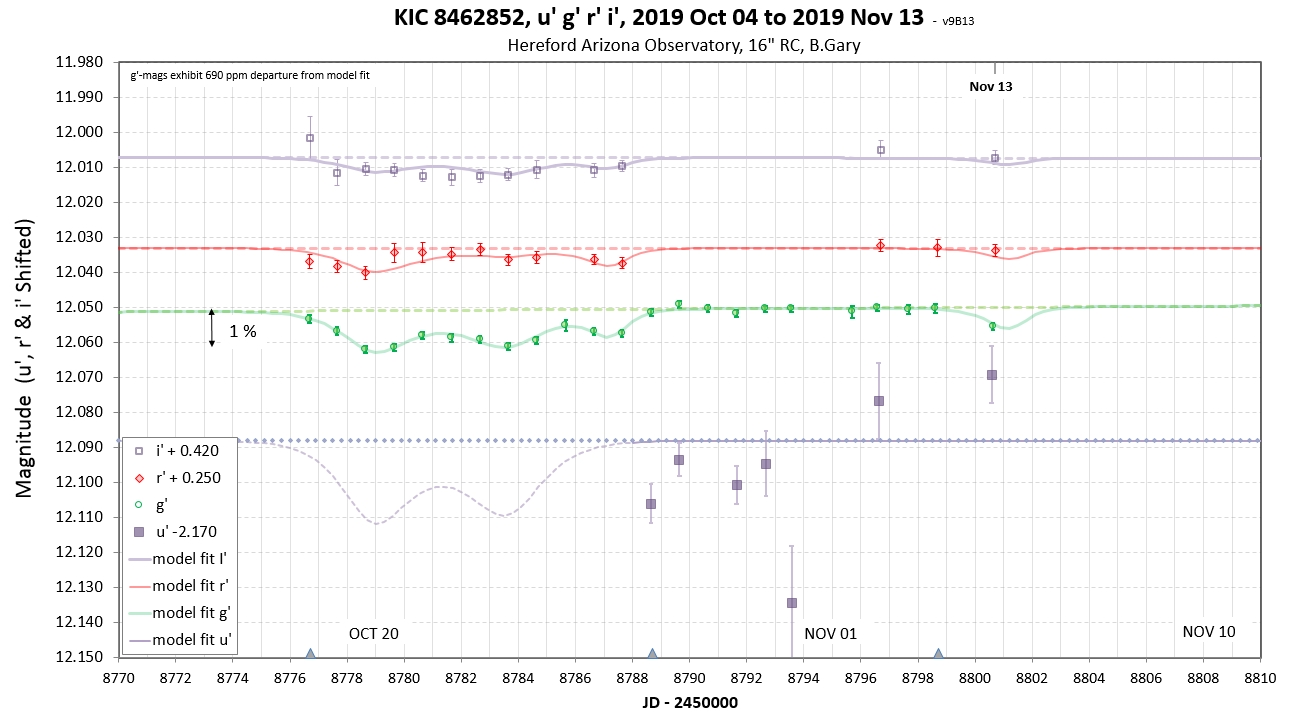
Figure 1a. The light gray dashed traces show the individual "asymmetric hypersecant" (AHS) functions used to fit the observations. The green trace is the sum of the AHS functions. Since 6 AHS functions are used to fit the observations we are supposed to imgine that 6 dust clouds passed through the line-of-sight to the star during this 2-month interval.


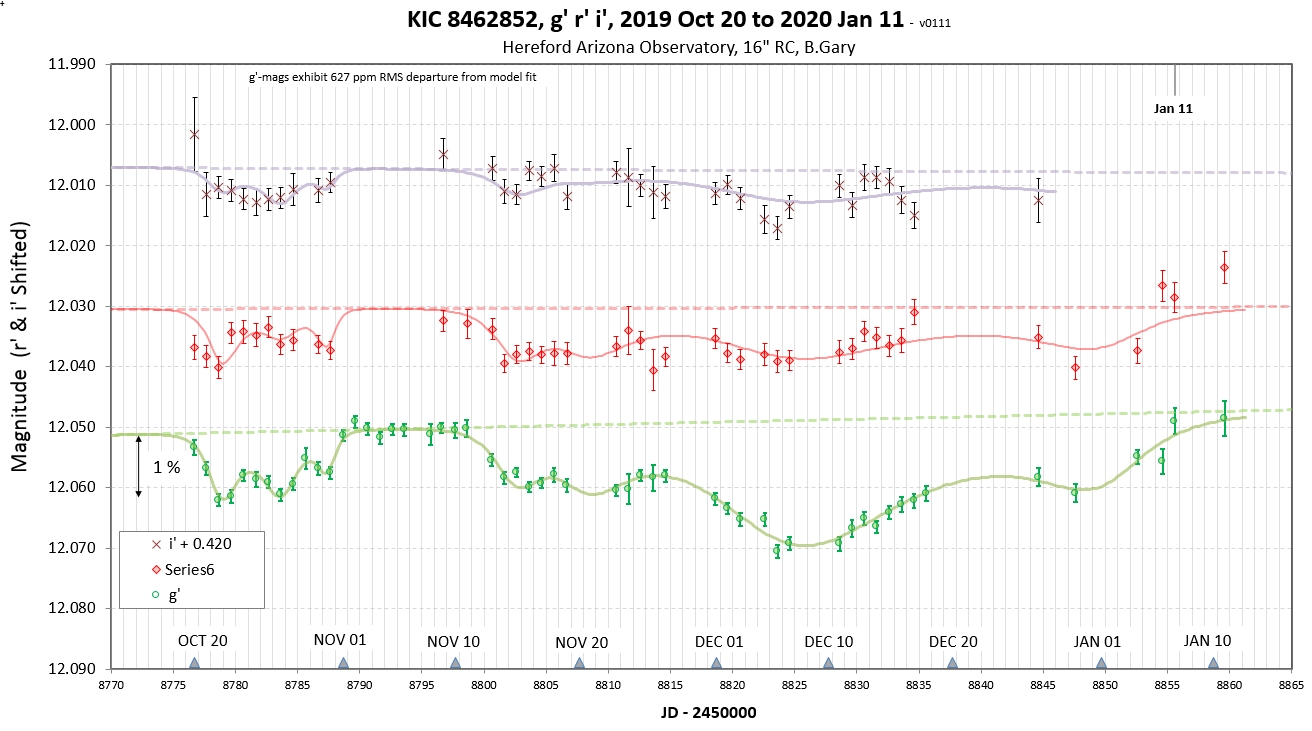
Figure 1b. Dip depths varies with wavelength, as expected. The strength o the dependence may vary between dust clouds, and may even vary within a cloud (as the last cloud suggests).


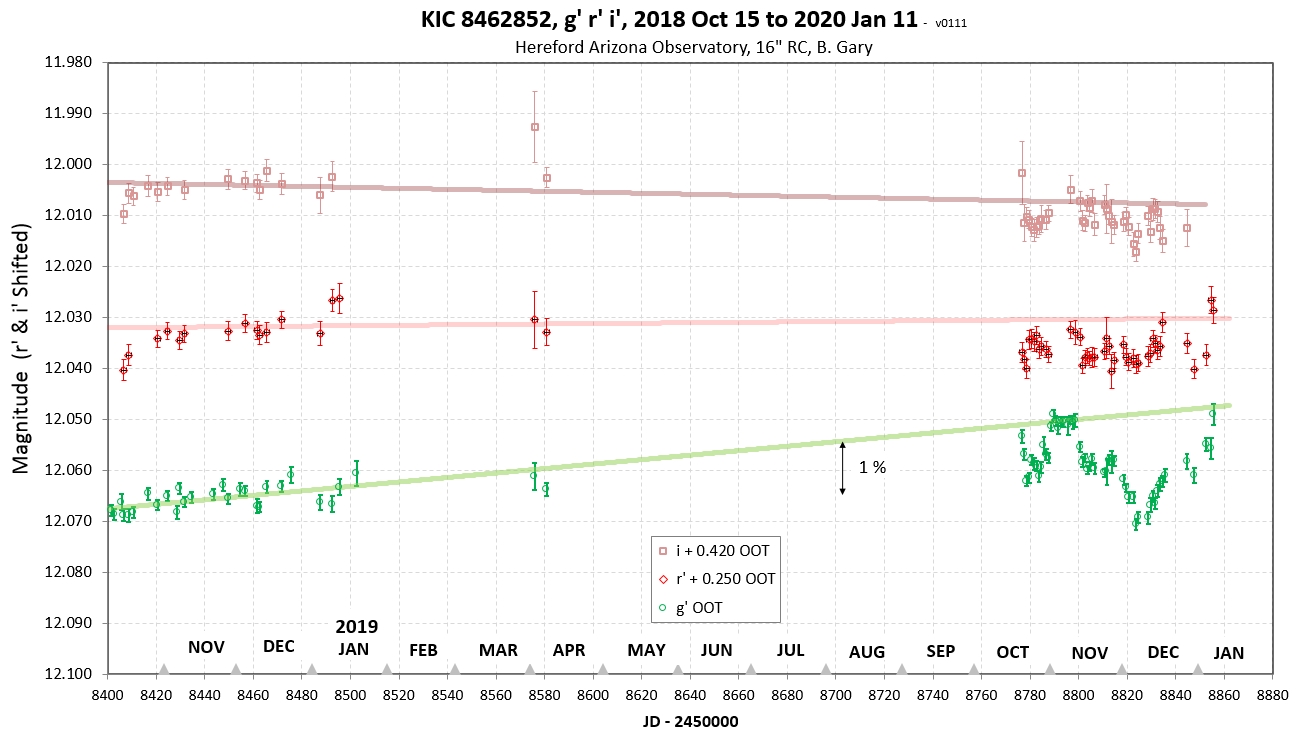
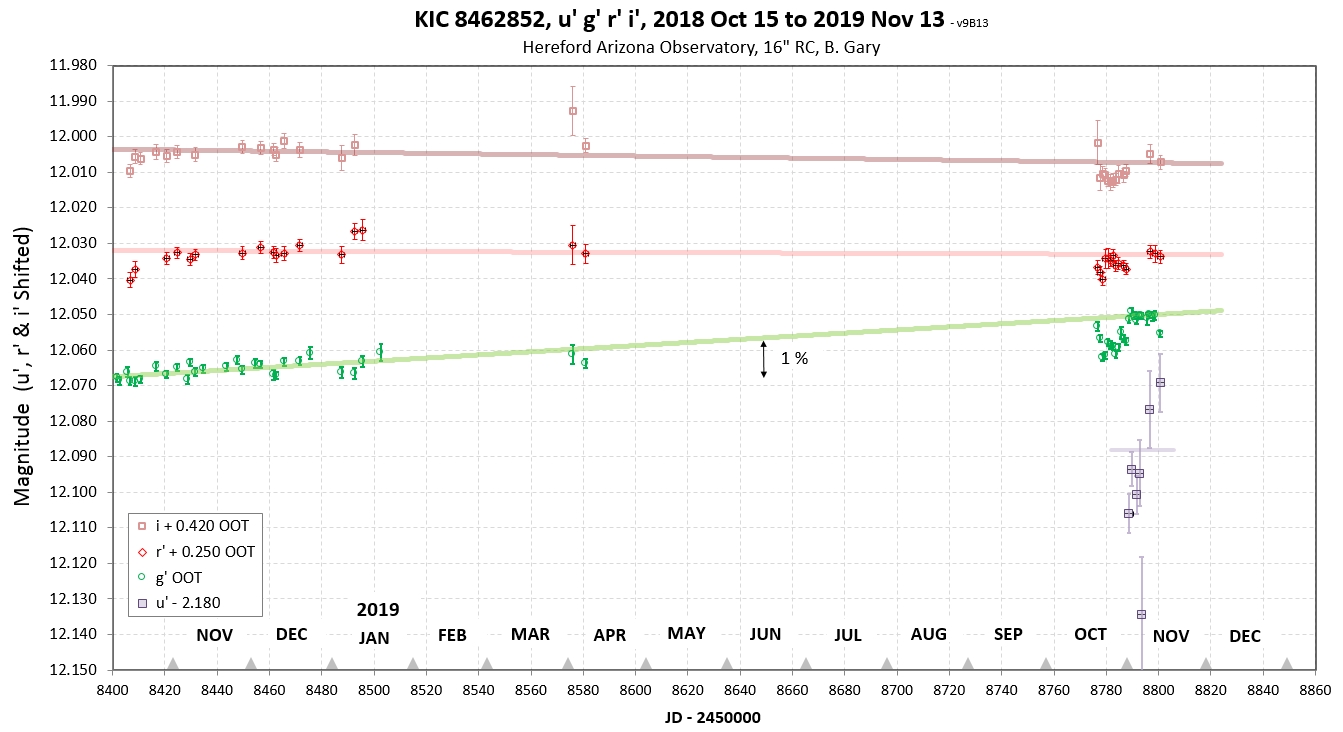
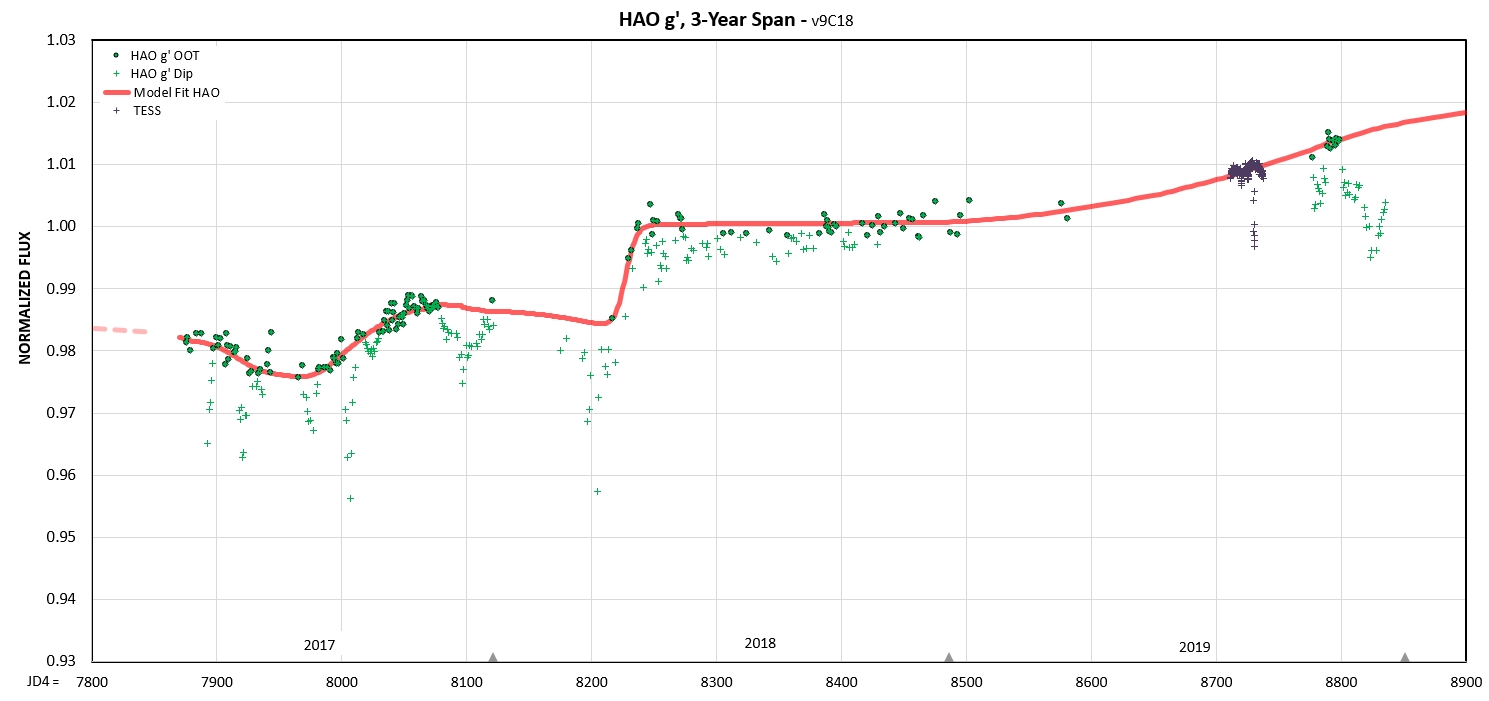
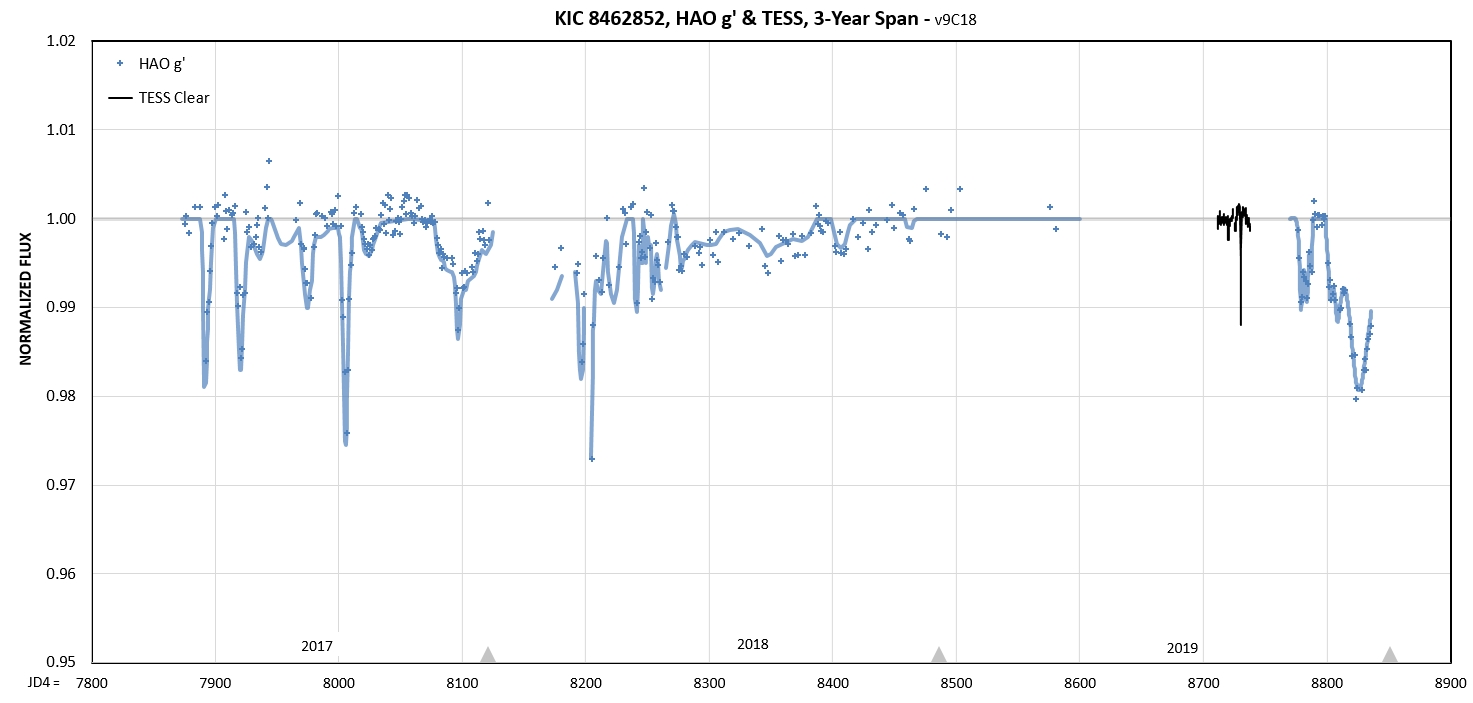
Figure 1c. HAO g', r' and i'-magnitudes for the past year. The "OOT only" traces are chosen to be "straight" in order to illustrate one interpretation, namely, that since since 2018 Oct the measurements are compatible with a steady slow rise in brightness for g' and no changes for r' and i'. (To see what was happening before 2018 Nov go to ts8).
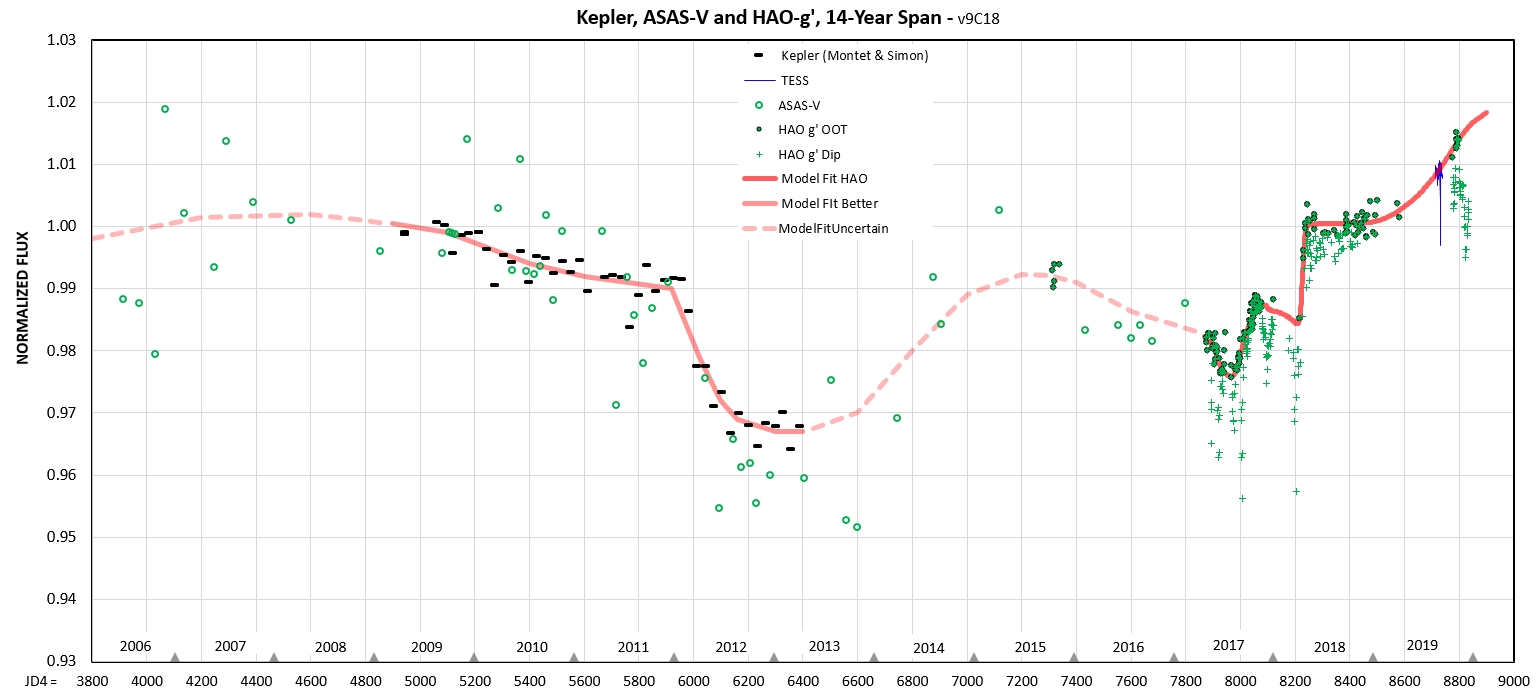
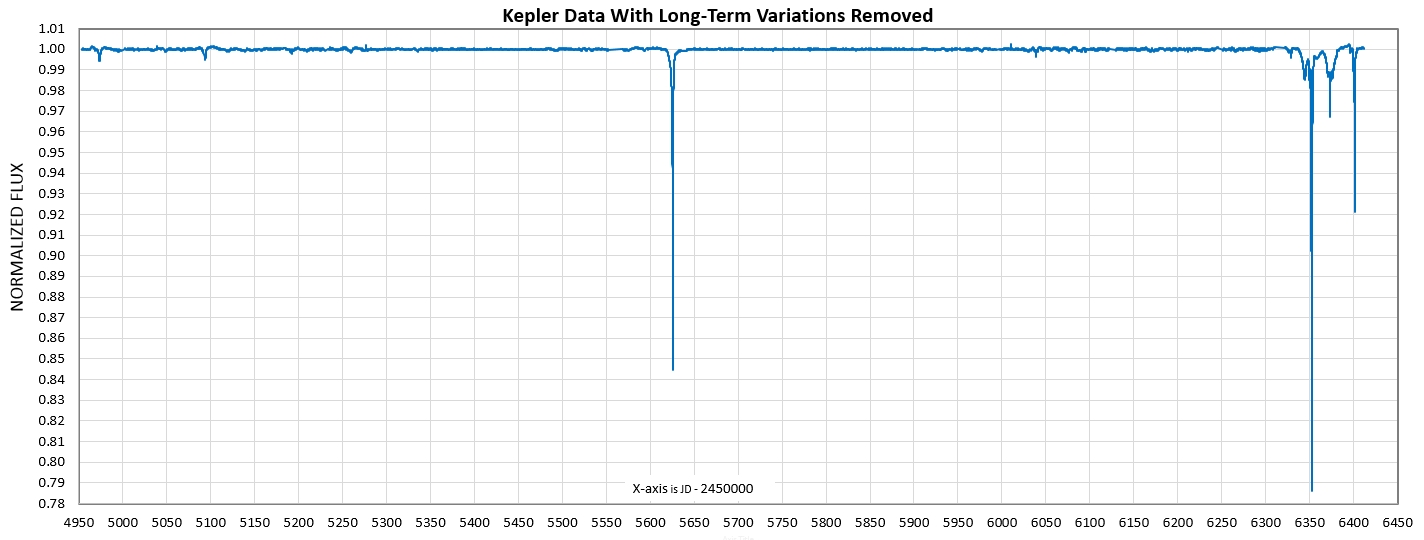
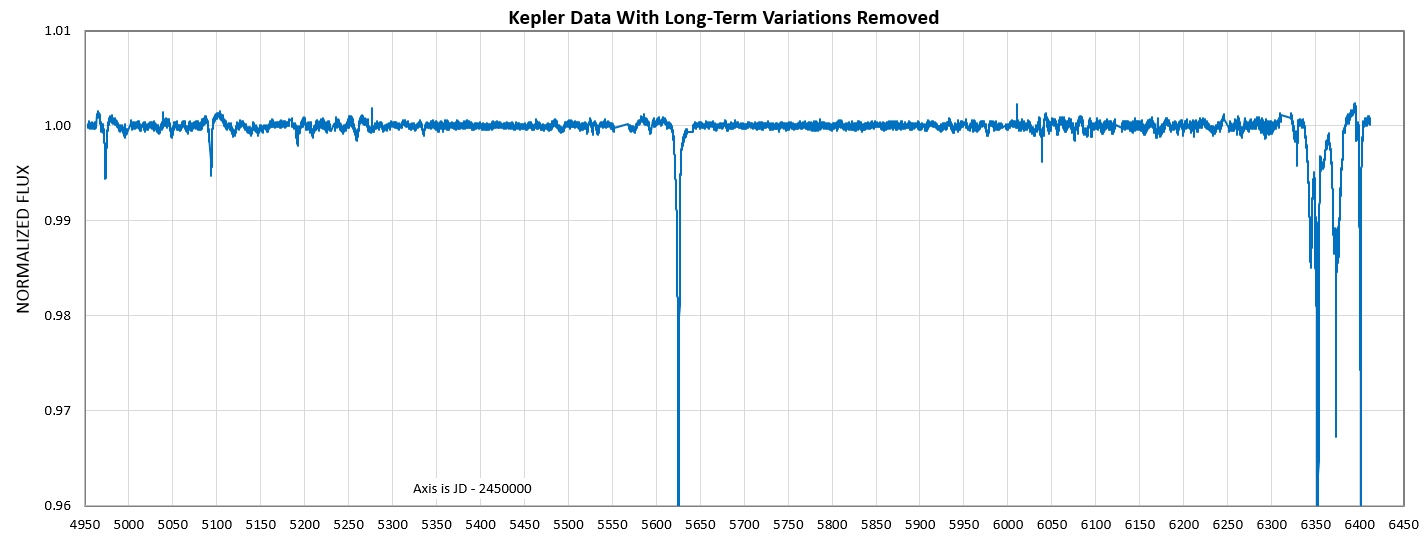
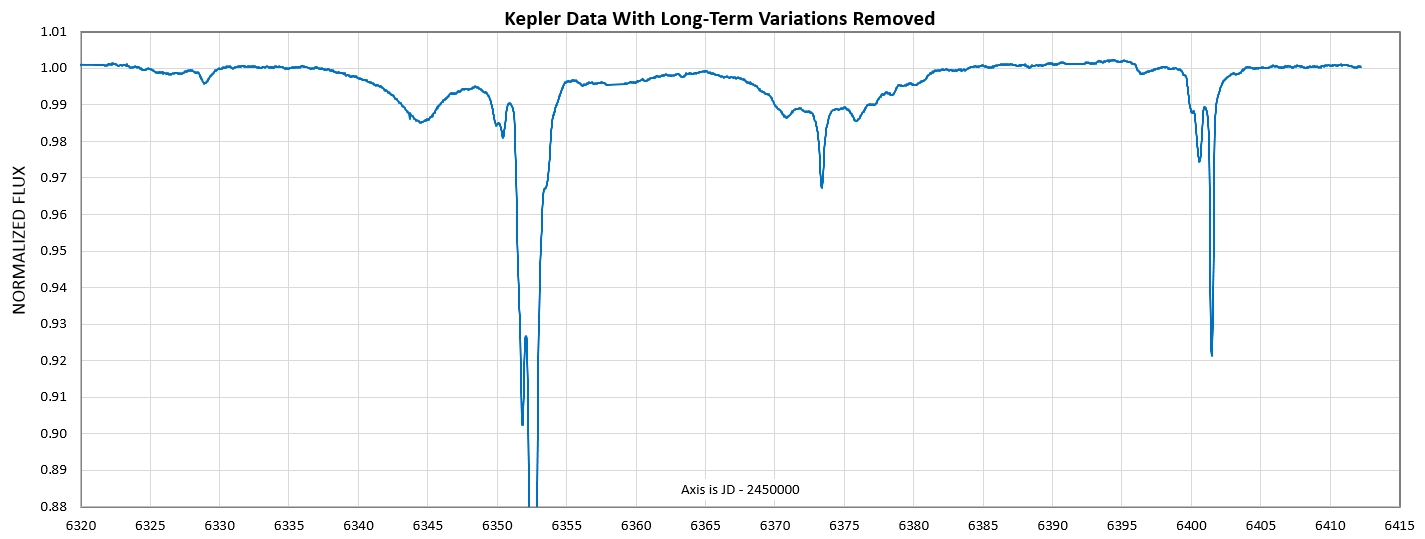
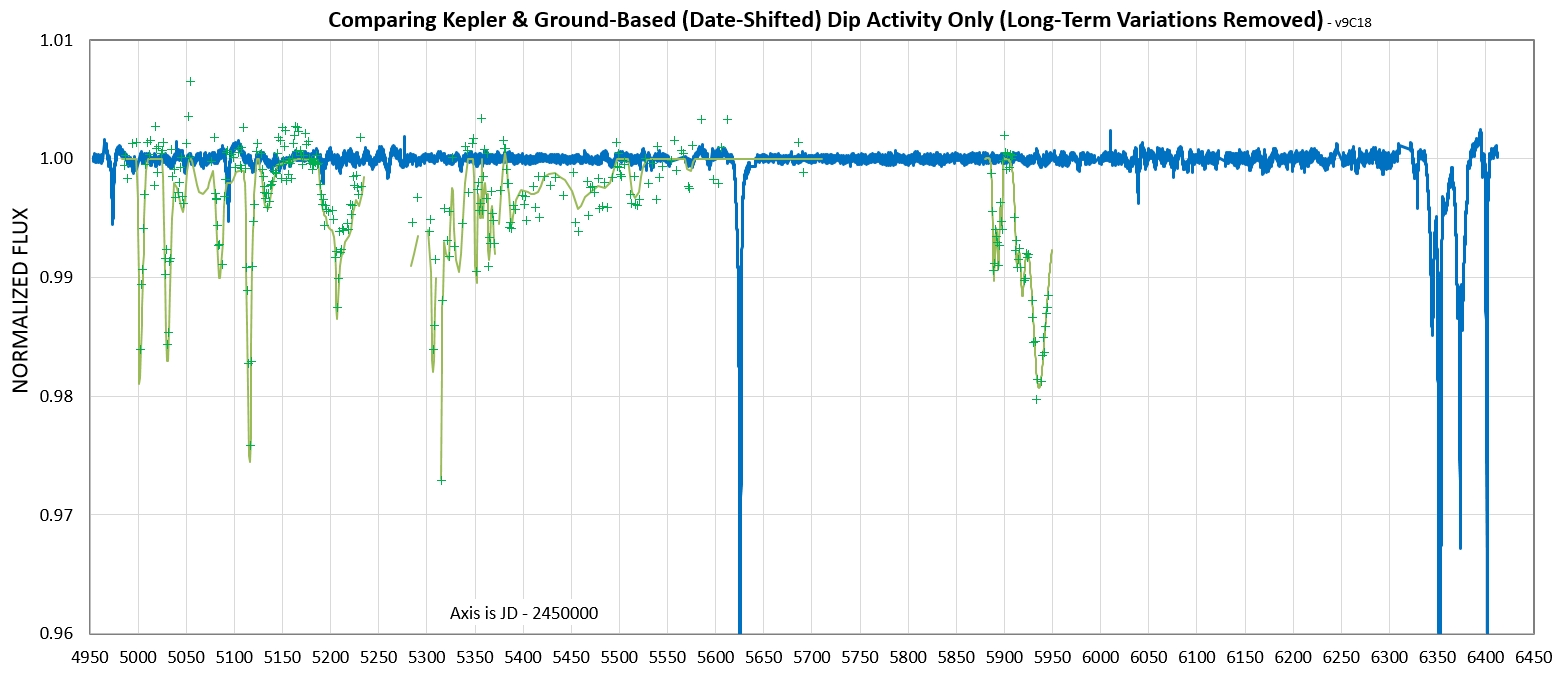

List of Observations (for all earlier observations, before 2018 Feb 25, go to link)

2020.01.11  
2020.01.07  
2020.01.06  
2020.01.04  
2019.12.30  
2019.12.27  
2019.12.18  
2019.12.17  
2019.12.16  
2019.12.15  
2019.12.14  
2019.12.13  
2019.12.12  
2019.12.11  
2019.12.07  
2019.12.06  
2019.12.05  
2019.12.03  
2019.12.02  
2019.12.01  
2019.11.27  

2019.11.26  
2019.11.25  
2019.11.24  
2019.11.23  
2019.11.19  
2019.11.18  
2019.11.17  
2019.11.16  
2019.11.15  
2019.11.14  
2019.11.13  
2019.11.11  
2019.11.40  
2019.11.09  

2019.11.08  
2019.11.06  
2019.11.05  
2019.11.04  
2019.11.03  
2019.11.02  
2019.11.01  
2019.10.31  
2019.10.30  
2019.10.28  
2019.10.27  
2019.10.26  
2019.10.25  
2019.10.24  
2019.10.23  
2019.10.22  
2019.10.21  

2019.10.20  
2019.04.07  
2019.04.02  

Daily Observing Session Information (most recent at top)


2020.01.11  


2020.01.07  


2020.01.06  


2020.01.04  


2019.12.30  


2019.12.27  


2019.12.18  


2019.12.17  


2019.12.16  


2019.12.15  


2019.12.14  


2019.12.13  


2019.12.12  


2019.12.11  


2019.12.07  


2019.12.06  

Good observing conditions, so I "believe" the fade in g'-band.


2019.12.05  


2019.12.03  


2019.12.02  


2019.12.01  


2019.11.27  


2019.11.26  

Very poor observing conditions: windy & cloudy.


2019.11.25  


2019.11.24  

Cloudy the entire time, so I observed during "sucker holes." Image sets for r' and i' probably not worth processing.


2019.11.23  


2019.11.19  


2019.11.18  


2019.11.17  


2019.11.16  


2019.11.15  


2019.11.14  


2019.11.13  


2019.11.11  


2019.11.40  


2019.11.09  


2019.11.08  
Too cloudy for u' band observations.


2019.11.06  


2019.11.05  


2019.11.04  

Observed through "holes in the clouds"!


2019.11.03  


2019.11.02  


2019.11.01  


2019.10.31  


2019.10.30  


2019.10.28  


2019.10.27  


2019.10.26  


2019.10.25  


2019.10.24  


2019.10.23  


2019.10.22  


2019.10.21  


2019.10.20 


2019.04.07 


2019.04.02  


Mag/mag scatter diagrams

During a dip the rate of change of brightness at one wavelength with respect to another is determined by the dust cloud's particle size distribution (PSD). Since I'm now observing at 3 wavelengths I could produce 3 mag/mag scatter diagrams. Instead, I will consider only r'-mag vs. g'-mag and i'-mag vs. g'-mag.


Figure 3.1. r'-mag versus g'-mag, showing smaller dip depths for r' than g'.

Will discus this more, later.


Dust Cloud Layout

Imagine viewing the shape of the various dust cloud components along its orbit. Assume that it is frozen in shape and merely passes in front of the star during the course of a couple months. Imagine further that the dust clouds are optically thick out to a border with abrupt drop off. The depth of the observed dip at each band (g', r' and i') can be converted to a vertical width (assuming the dust cloud is broad in relation to the star). Here's the shape I derive from the 2019 October through November observing dates.


Attempted u' band Observations

Will discuss the u' problem later.


Figure 4.1


Figure 4.2.
 
Finder Image


Figure 5.1. Finder image showing the 17 reference stars that I use. KIC846 is in the blue square. FOV = 15.6 x 10.5 'arc, NE at upper-left.


Figure 5.2. "Deeper" version of same FOV (r' band).


The Big Picture

What is the overall character of KIC846 brightness variations?

I like to distinguish between short-term and long-term variations. The short-term variations are referred to as "dips." The dips last a few days typically. By long-term I refer to whatever is left over after removing the dip data. The long-term data can have variations with timescales of months to years. The next plot covers a 14 year interval and includes both Kepler and ground-based data, and it shows long-term variations (red model traces).


Figure 6.1. 14 years of Kepler and ground-based measurements. The black dots are Kepler data with dips removed; these data show the long-term variation during the 4 years of Kepler observations. Starting in 2017 (with only ground-based data) the dip and long-term data are shown with different symbols. None of Tabby's LCO data are shown (because a digital version of this data is not in the public domain) and none of the AAVSO data are shown (because most of it is noisy and adding the less noisy data would make the plot too "busy").  


Figure 6.2.
Ground-based HAO g' measurements during the past 3 years (plus TESS).


Figure 6.3. Ground-based HAO g', r' & i' measurements during the past year.


Figure 6.4. Ground-based HAO g', r' & i' measurements during the past 4 months.

Now let's return to the Kepler data that has long-term variations removed, allowing us to see just the short-term ("dip") activity.


Figure 6.5a. Kepler short-term version of data for the entire 4-year of Kepler observations.


Figure 6.5b. Same Kepler data but with an expanded normalized flux scale.


Figure 6.5c. Last 3 months of Kepler data showing the one set of dips with a complex and sometimes deep dipping structure.

As an aside, allow me to show what TESS observed recently:


Figure 6.6. TESS data for 2019 (using passband equivalent to Rc+Ic bands).

Let's do the same removal of long-term variations for recent ground-based data.


Figure 6.7. Ground-based (HAO) data, plus TESS data, with long-term variations removed (showing only dip activity) for the past 3 years.


Figure 6.8. Ground-based (HAO) data with long-term variations removed (showing only dip activity) for the past 2 months.

Other ground-based data exists but some of it is not in the public domain in digital form (LCO data) and I apologize to the AAVSO observers with data that is not included above. I'll try to add some AAVSO data if I get time for processing and selecting it.

Note, as Rafik Bourne pointed-out to me, TESS is sensitive to just long wavelengths (Rc/Ic/z') which does not include g'-band, and since dip depth is consistently less at longer wavelengths TESS dip depths will always be less than g'-band depths. For example, in the above figure the TESS dip showing depth = 1.2 % would probably have been observed with a g' filter to have a depth of 2.0 or 2.5 %.

We can now ask the question: Are the long-term and short-term (dip) activities for the past 3 years similar or different from what Kepler observed during 4 years?

Long-term Variation Differences

Referring back to an earlier figure, repeated here, the long term variation during the past 3 years has been considerably greater than during Kepler's 4 years of measurements.

 
Repeat of Figure 6.1. The Kepler data with dip activity removed (black dots) exhibit just one large change (2.2 %) following a slow fade (1 %). The ground-based data, starting in 2017, exhibit several changes, or variations, each about 1 % but adding up to ~ 3.5 % during 3 years.      

Short-Term (Dip Activity) Differences

Again, there are significant differences between the Kepler 4-year record of dip activity and the 3-year record of ground-based dip activity. Consider the following figure showing the two "short-term only data" using the same scale for normalized flux but with the ground-based data shifted in time.
 
Figure 6.9. Comparing dip activity of Kepler and ground-based (HAO) data (i.e., long-term variations removed). The HAO data was shifted 7.9 years (to earlier dates).

It is apparent in this comparison plot of dip activity that the past 3 years have exhibited more short-term ("dip") activity than a comparable 3-year interval of Kepler data. Another difference is that during the Kepler dates when dips were present they could be much deeper!

Physical Model Speculations

A possible explanation for this dip activity pattern (in the above figure) is that the Kepler observations were closer in time to an event, such as a collision, that created a well-defined cluster of dust-producing fragments within an orbit, and during the course of 8 years the fragments have dispersed along the orbit. The total amount of light blocking dust may have not changed much, but since fragment-based dust clouds spread apart over time they produce more dips with lower depth. 

The long-term variations in brightness that seem to have increased during the past 8 years (cf. Fig. 6.1 and its repeat) could be caused by 1) reflection of starlight when the dust cloud is on the far side of the star, or 2) forward scattering when the dust cloud is on the near side of the star (close to our line-of-sight). With a more spread-out configuration of dust clouds there is less chance of one cloud blocking the reflection, or forward scattering, of another cloud.

Keep in mind that these are speculations by an amateur; actual modeling of these and other ideas are needed by more-qualified people. 

e


My Collaboration Policy

At my age of 80 I'm entitled to have fun and avoid work. Photometric observing and figuring things out are fun. Writing papers is work. So if anyone wants to use any of my observations for a publication you're welcome to do so. But please don't invite me for co-authorship!

My light curve observations are "in the public domain." This means anyone can and may download my LC observations, and use (or misuse) any of that data for whatever purpose. If my data is essential to any publication just mention this in the acknowledgement section.
 

References

    Gonzalez, M. J. Martinez and 15 others, 2108, "High-Resolution Spectroscopy of Boyajian's Star During Optical Dimming Evetnts," arXiv:1812.06837
    Wright, Jason T., "A Reassessment of Families of Solutions to the Puzzle of Boyajian's Star," arXiv  (a 1.1-page paper)
    Schaefer, Bradely E., Rory O. Bentley, Tabetha S. Boyajian and 19 others, 2018, "The KIC 8462852 Light Curve From 2015.75 to 2018.18 Shows a Variable Secular Decline," submitted to MNRAS, arXiv 
    Bodman, Eva, Jason Wright, Tabetha Boyajian, Tyler Ellis, 2018, "The Variable Wavelength Dependence of the Dipping event of KIC 8462852," submitted to AJ, arXiv.
    Bodman, Eva, 2018, "The Transiting Dust of Boyajian's Star," AAS presentation, link 
    Yin, Yao and Alejandro Wilcox, 2018, "Multiband Lightcurve of Tabby's Star: Observations & Modeling," AAS presentation, link (navigate down, etc)
    Sacco, Gary, Linh D. Ngo and Julien Modolo, 2018, "A 1574-Day Periodicity of Transits Orbiting KIC 8462552," JAAVSO, #3327, link
    Boyajian, Tabetha S. and 198 others, 2018, "The First Post-Kepler Brightness Dips of KIC 8462852," arXiv 
    Deeg, H. J., R. Alonso, D. Nespral & Tabetha Boyajian, 2018, "Non-grey dimming events of KIC 8462852 from GTC spectrophotometry" arXiv 
    Bourne, R., B. L. Gary and A. Plakhov, 2017, "Recent Photometric Monitoring of KIC 8462852, the Detection of a Potential Repeat of the Kepler Day 1540 Dip and a Plausible Model," arXiv:1711.10612     
    Bourne, Rafik and Bruce Gary, 2017, "KIC 8462852: Potential repeat of the Kepler day 1540 dip in August 2017," submitted to AAS Research Notes, preprint: arXiv:1711.07472
    Xu, S., S. Rappaport, R. van Lieshout & 35 others, 2017, "A dearth of small particles in the transiting material around the white dwarf WD 1145+017," approved for publication by MNRAS link, preprint arXiv: 1711.06960 
    Gary, Bruce and Rafik Bourne, 2017, "KIC 8462852 Brightness Pattern Repeating Every 1600 Days," published by Research Notes of the AAS at link; preprint at arXiv:1711.04205
    Gary, B. L., S. Rappaport, T. G. Kaye, R. Alonso, J.-F. Hambsch, 2017, "WD 1145+017 Photometric Observations During Eight Months of High Activity", MNRAS, 2017, 465, 3267-3280; arXiv
    Neslusan, L. and J. & Budaj, 2016, "Mysterious Eclipses in the Light Curve of KIC8462852: a Possible Explanation, arXiv: 1612.06121v2  (a "tour de force"; I highly recommend this publication)
    Neslusan & Budaj web site with animation of their way of explaining Kepler D1540 dip:  http://www.astro.sk/~budaj/kic8462.html
    Wyatt, W. C., R. van Lieshout, G. M. Kennedy, T. S. Boyajian, 2017, "Modeling the KIC8462852 light curves: compatibility of the dips and secular dimming with an exocomet interpretation," submitted to MNRAS, arXiv  
    Grindlay interview about Schaefer's assertion that KIC846 exhibited a century long fade using DASCH data: link
    Hippke, Michael and Daniel Angerhausen, 2017, "The year-long flux variations in Boyajian's star are asymmetric or aperiodic," submitted to ApJL, arXiv 
    Sacco, G., L. Ngo and J. Modolo, 2017, "A 1574-day Periodicity of Transits Orbiting KIC 8462852," arXiv
    Rappaport, S., B. L. Gary, A. Vanerdurg, S. Xu, D. Pooley and K. Mukai, 2017, "WD 1145+017: Optical Activity During 2016-2017 and Limits on the X-Ray Flux," arXiv, Mon. Not. Royal Astron. Soc.
    Steele, I. A. & 4 others, 2017, "Optical Polarimetry of KIC 8462852 in May-August 2017,"MNRAS (accepted), arXiv.
    Simon, Joshua D., Benjamen J. Shappee and 6 others, "Where is the Flux Going? The Long-Term Photometric Variability of Boyajian's Star," arXiv:1708.07822 
    Meng, Huan Y. A., G. Rieke and 12 others (including Boyajian), "Extinction and the Dimming of KIC 8462852," arXiv: 1708.07556  
    Sucerquita, M., Alvarado-Montes, J.A. and two others, "Anomalous Lightcurves of Young Tilted Exorings," arXiv: 1708.04600   Also: New Scientist link and Universe Today link.
    Rappaport, S., A. Vanderburg and 9 others, "Likely Transiting Exocomets Detected by Kepler," arXiv: 1708.06069 
    Montet, Benjamin T. and Joshua D. Simon, 2016, arXiv 
    Boyajian et al, 2015, MNRAS, "Planet Hunters X. KIC 8462852 - Where's the flux?" link
    Ballesteros, F. J., P. Arnalte-Mur, A. Fernandez-Soto and V. J. Martinez, 2017, "KIC8462852: Will the Trojans Return in 2011?", arXiv
    Washington Post article, 2015.10.15: link
    AAVSO Campaign Notice requesting KIC646 observations
    AAVSO LC Generator https://www.aavso.org/data/lcg (enter KIC 8462852)
    Web page tutorial: Tips for amateurs observating faint asteroids (useful for any photometry observing)
    Book: Exoplanet Observing for Amateurs, Gary (2014): link (useful for any photometry observing) 
    wikipedia description of Tabby's Star  
    My web pages master list, resume


    B L G a r y at u m i c h dot e d u    Hereford Arizona Observatory    resume 
 
This site opened: 
2019.10.20. 
Nothing on this web page is copyrighted.