KIC 8462852 Hereford Arizona Observatory Photometry Observations #5
Bruce Gary, Last updated: 2018.02.25, 21 UT

A new web page has been started for the 2018 observing season: http://www.brucegary.net/ts6/

1) By now everyone knows about two important papers that appeared at the arXiv preprint web site on Jan 03: the Tabby Team paper (199 authors) summarizing Kickstarter observations & others, and a Deeg et al. paper reporting GTC (10.4-m) observations of dip depth vs. wavelength. Both confirm that dust with a small size component (< 0.5 micron radius) produce the dips. (Long-timescale variations are a completely different thing.) Links to these two papers are given in the References section (below).

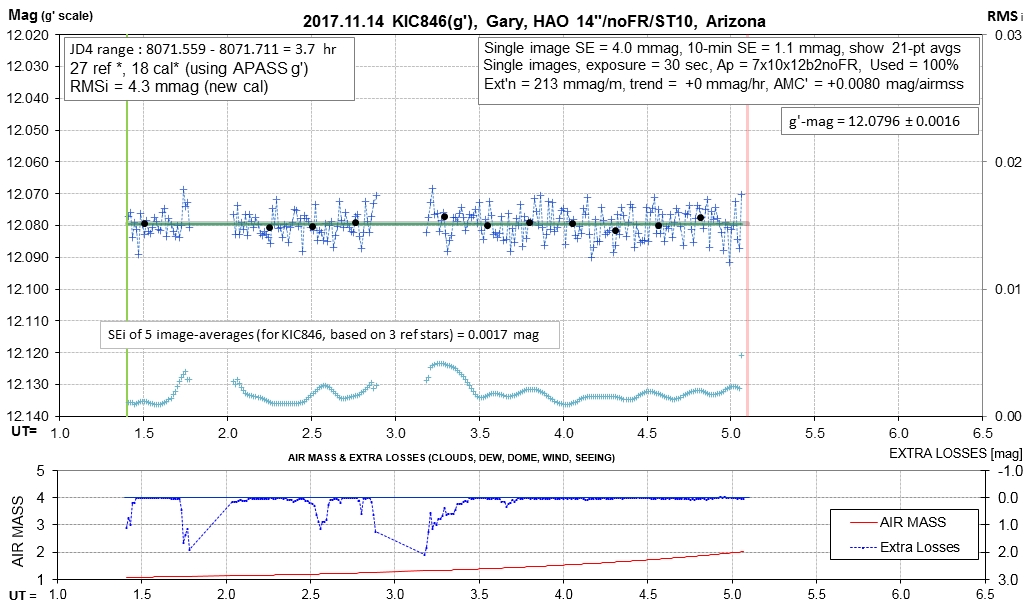
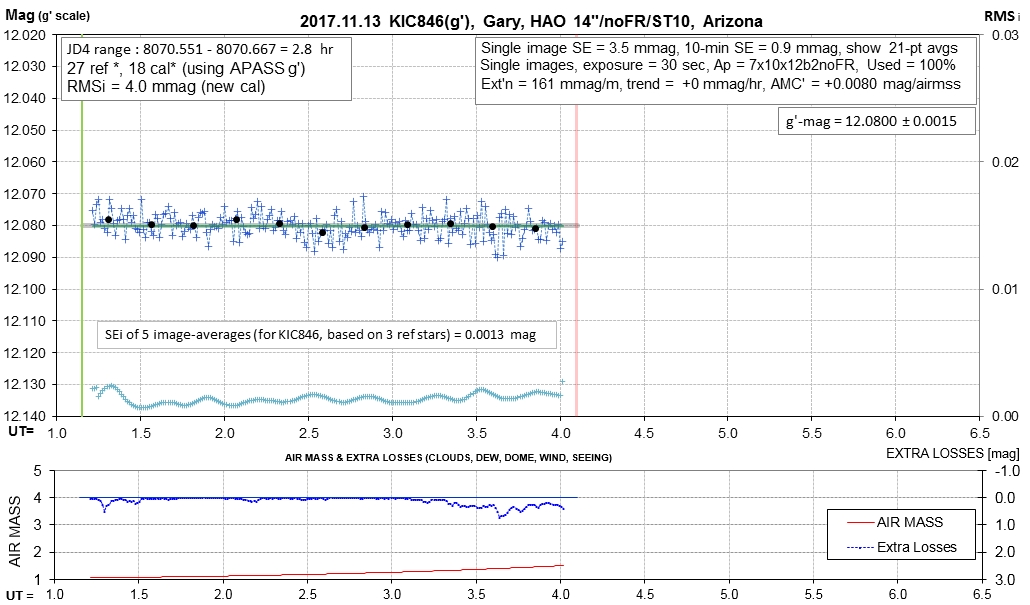
2) The observing season is "over" (with < 1 hour above 30 deg. elevation for my Arizona location, leading to increasingly noisier data), so I have suspended KIC846 observing (on January 03). The new observing season will begin on Feb 10, which has as many useful observing time as Dec 28 - in the early morning hours instead of early evening. I haven't decided whether or not I'll be motivated to resume KIC846 observing, especially if it means getting up early. 

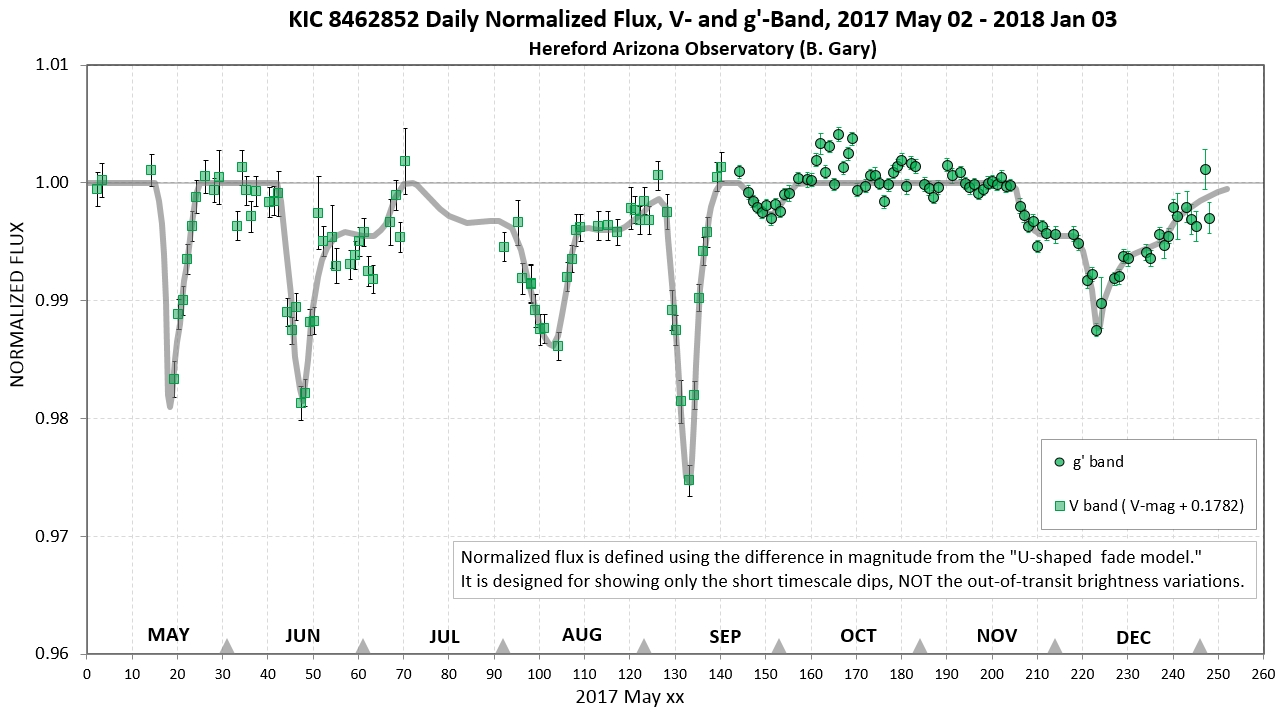
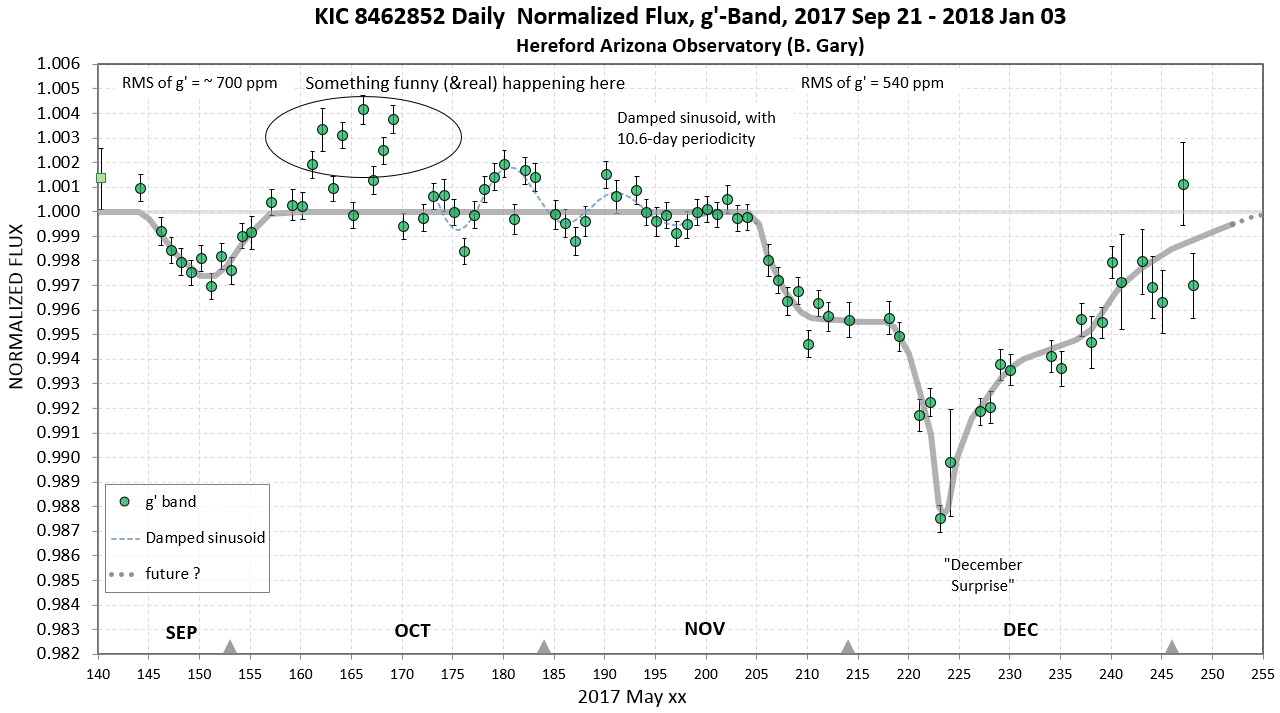
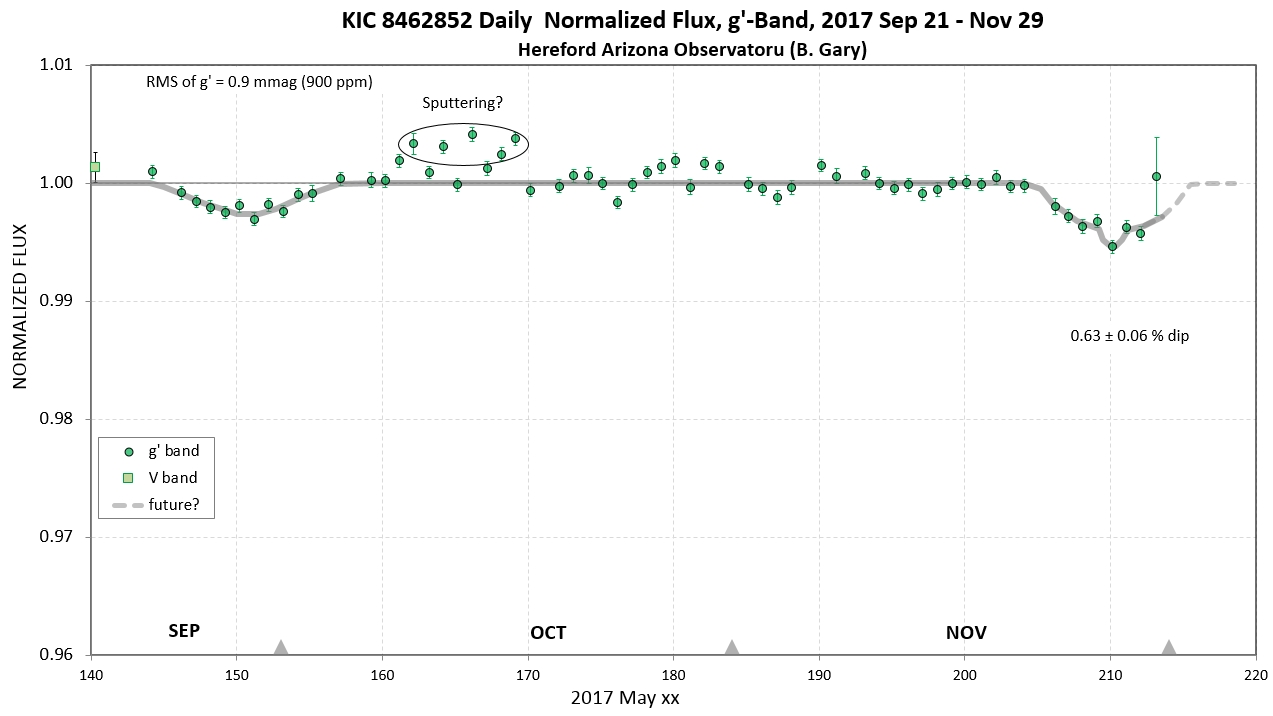
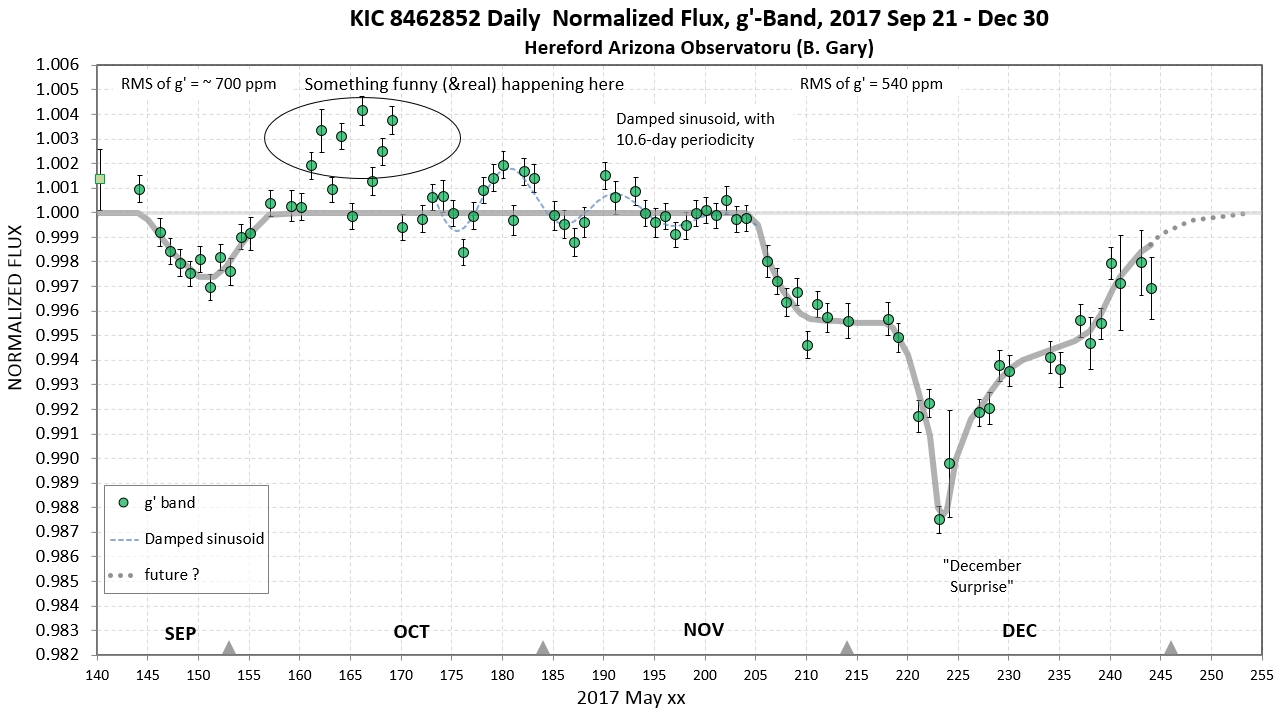
3) Rafik Bourne did it again! In early December he successfully predicted that the "December Surprise" dip would recover at about the end of December! (His earlier successful prediction was a long timescale brightening in October, made a couple months earlier.) He also has a model upon which this is based. For the record, the "December Surprise" dip is the 5th dip deeper than 1.0 % since everyone began frequent observations in early May, 2017. The additional drop of 0.8 % (centered on Dec 09) has the pattern of a "short dip in the middle of a broad dip" (somewhat similar to the one seen Aug 09). A recovery of the short dip occurred (Dec 26) and the broad dip recovery was almost complete when I had to abandon observing. Here's the Nov/Dec dip  that I'm referring to:


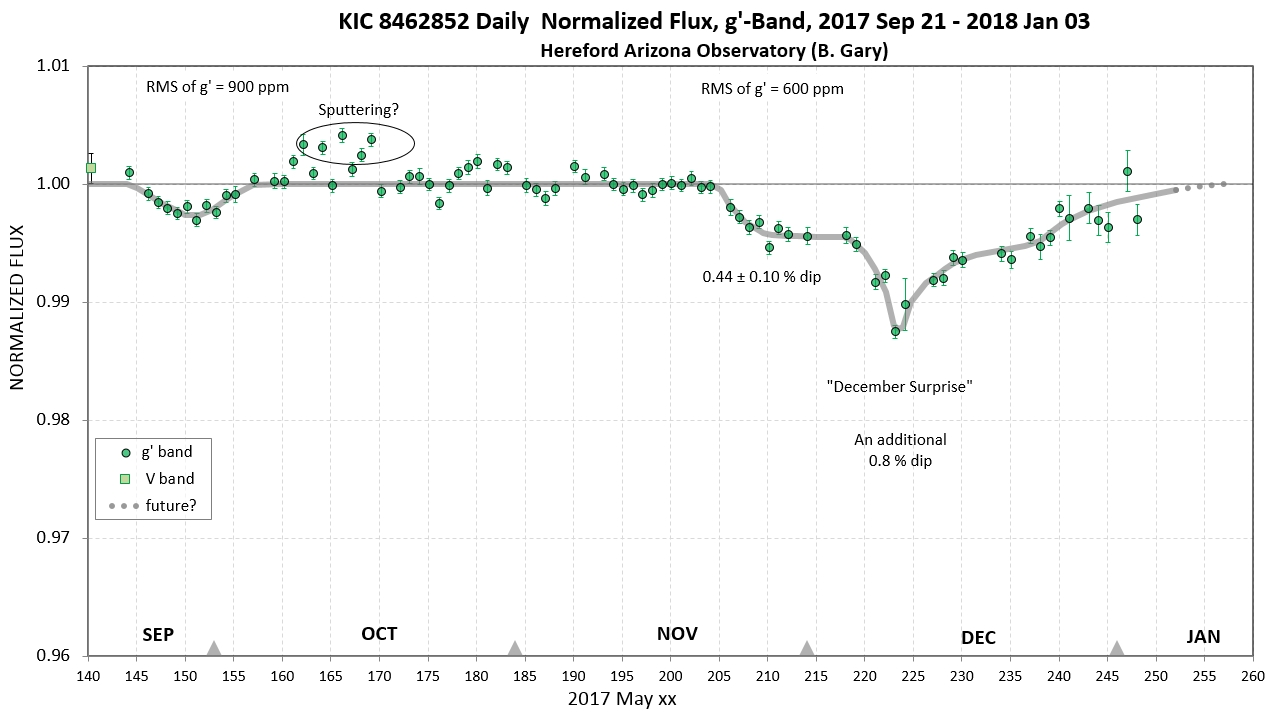
Fig. 0.1. The dip from mid-November to early January, which includes a superimposed "December Surprise" brief dip centered on December 09. This pattern has a simple explanation which Rafik Bourne explained to me about three weeks ago.

To see Rafik Bourne's suggested model that may account for the above November/December photometric behavior, go to this internal link.

4) About a month ago I appealed for someone to measure the radial velocity (RV) of KIC846 during December, when R. Burne's BD model predicted that RV of the main sequence star would undergo an extreme change due to the BD being in an eccentric orbit and passing periastron at that time (causing the brighter main sequence star to be coming toward us, compared with its orbit-averaged speed, as shown by Fig. 1.4b, below). Our hope was that some advanced amateur would undertake this relatively straightforward project, and share results with the public in a timely manner. No one (to my knowledge) answered this call. However, a professional observation with the Keck telescope was made in early December (by a graduate student at Penn. State U.). By now he must know the result, and Tabby must know the result (he's "on her team"), and some day the rest of us will know the result. This is an important measurement, because it can either confirm R. Bourne's BD model, or severely constraint it by placing an upper limit on any BD mass, and possibly rule out the BD model if the upper limit on mass is under 14 × M_Jupiter. Those of us not on Tabby's Team must be patient.

5) Rafik Bourne and I have published two articles in AAS Research Notes: 1) "KIC 8462852 Brightness Pattern Repeating Every 1600 Days" at link, and 2) "KIC 8462852: Potential repeat of the Kepler day 1540 dip in August 2017" at link. Preprints are available at arXiv:1711.04205 and arXiv:1711.07472. A full-length (9-page) article, covering both AAS Research Notes topics more fully, has been published by MNRAS. You can see the final version (after 3 revisions) at link or link. An updated arXiv preprint will be posted soon (at link). (I'm recovering from a car accident so will be resting a lot for a few weeks.)

6) Finally, since I have probably observed KIC846 more than anyone, I may have earned the right to comment about the insertion of "alien mega-structures" as a possible explanation for the unexplained dimming behavior before natural explanations had been exhausted. I'm going to repeat a complaint by the Dutch astronomer Ignas Snellen of Leiden Observatory, but first I want to present a brief justification for my right to represent a pro-SETI perspective, with two factoids.1) In the 1950s I demonstrated the feasibility of an alien civilization in our interstellar neighborhood to broadcast its location by transmitting a map of how constellations appeared from their location, and 2) when I led the JPL Radio Astronomy Group in 1968 I suggested that SETI should be a group goal with a Deep Space Station radio telescope, which my successor eventually did, using DSS-14 (until it was killed by a Nevada senator who complained about this NASA project). OK, here's what Dr. Snellen wrote (from link):
 
"...there is no place for alien civilizations in a scientific discussion on new astrophysical phenomena, in the same way as there is no place for divine intervention as a possible solution. One may view it as harmless fun, but I see parallels in athletes taking banned substances. It may lead to short-term fame and medals, but in the long run it harms the sport. Same for astronomy: we should be very careful not to be ridiculed. I really hope we can stop mentioning SETI for every unexplained phenomenon.” The article (by Elizabeth Howell) ends with a quote from Morris Jones, an Australian space observer: "The media is under pressure to deliver attention-grabbing news, but it’s hard to expect them to judge fringe SETI as spurious when it comes from reputable institutions and qualified researchers. The best way to reduce these reports is to stop the production of questionable scientific papers in the first place.”

Amen!
_____________________________________________________________________________________________________________________________________ 

Links on this web page
  

    KIC846 Dust Cloud Geometry Speculation 
   
Significance of Interval Between Patterns of Kepler Fade/Dip & 2017 Fade/Dip
    AAS Research Note
2nd article highlights
    List of observing sessions
    Model for 2017 November/December Photometric Behavior  
    Is KIC846 unique?   
   
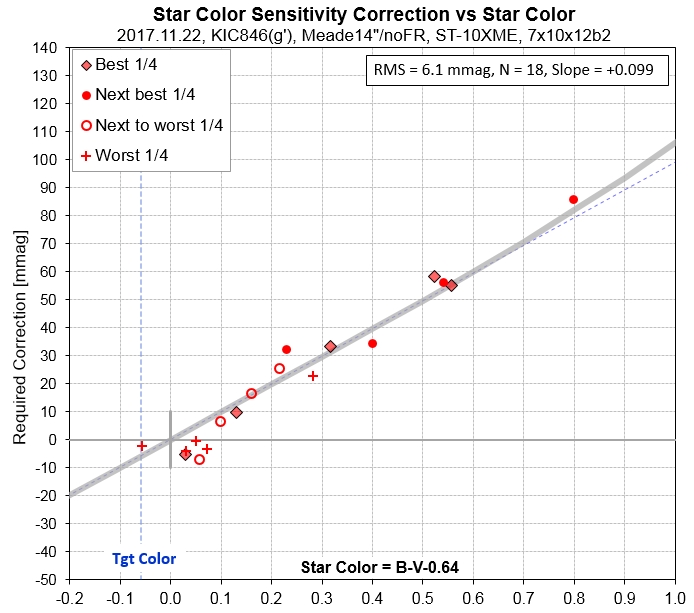
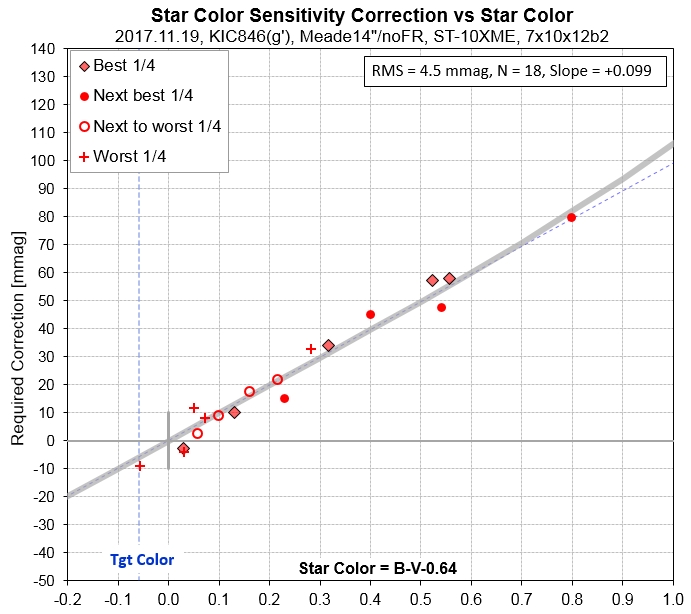
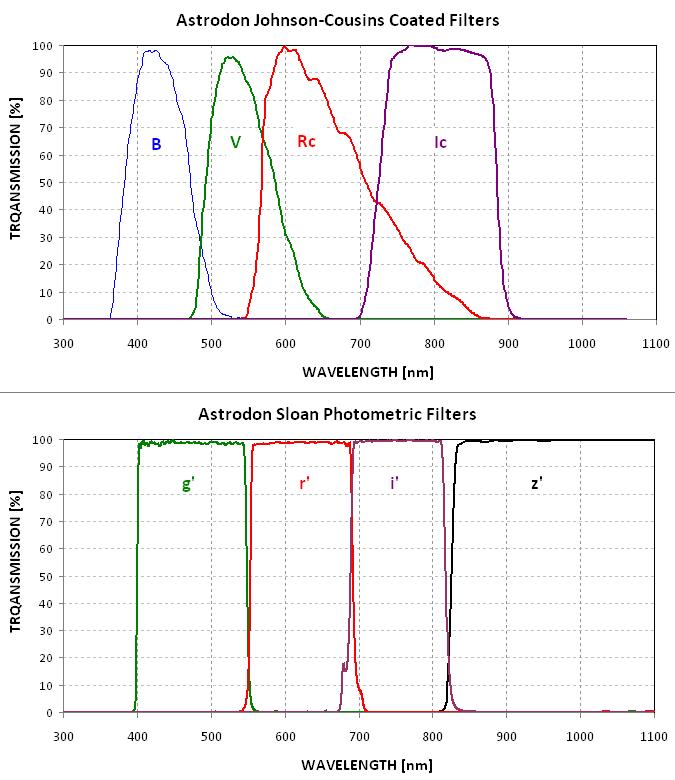
Why I switched from V- to g'-band  
    Finder image showing new set of reference stars
    My collaboration policy
    References    

  Go to next 6th of six web pages  (for dates 2018.02.25 to present)
  Go back to 4th of six web pages  (for dates 2017.09.21 to 2017.11.13)
  Go back to 3rd of sis web pages  (for dates 2017.08.29 to 2017.09.18)
  Go back to 2nd of six web pages  (for dates 2017.06.18 to 2017.08.28)
  Go back to 1st of six web pages  (for dates 2014.05.02 to 2017.06.17)

    Reference Star Quality Assessment  (the 10 best stars out of 25 evaluated)  

This is the fifth web pages devoted to my observations of Tabby's Star. When a web page has many images the download times are long, so this is the latest "split."

Transit Pattern and Speculation about Model for KIC846 Dust Cloud Geometry (not Physical Mechanism Model)

Last July someone e-mailed me a prediction of a brightening after the series of 2017 dips was over, and mentioned late September or October for when this should occur. In August he revised the prediction to a brightening in October. At the time I didn't understand why he was predicting this, but in September we began to collaborate on a joining of my HAO observations with his modeling (he has developed a 2-D transit model for complicated ring systems, comas and dust clouds that appears to be more sophisticated than anything published). I now understand why he was predicting a brightening, and since it is underway we want to "go public" with this prediction.

I want to present an overview of what we know about the brightness behavior of KIC 8462852 (hereafter, KIC846). Two very basic observational facts should be beyond dispute by now:

    1) U-shaped fade events of ~ 1 or 2 %, lasting about a year, occur at 1600-day intervals, and
    2) Near the end of the U-shaped fade event a half dozen short-term dips occur.

If anyone questions the above two "observational facts" I would like to get an e-mail with the argument (no opinions, please) for disputing them. As one professional astronomer likes to say: "Mysterious objects usually can't be understood until they exhibit periodicity of some sort." Well, the above two "observational facts" provide a periodicity of sorts! I view them as a good "starting place" for developing new understandings, as I present the following (self-evident) surmises:

     3) Something orbits KIC846 with a period of ~ 1600 days (ie., at an average distance of 3.0 AU).
     4) Things orbit the above object, and their dust produces the short-term dips. The object being orbited must be a "massive object."
            Why? Because a set of objects can't be in an identical orbit this close to each other; only the 5 Lagrange regions permit stability in orbits with the same period.
     5) The things that orbit the 1600-day "massive object" have orbits that extend on each side by "an orbit circumference fractional amount" = (400 days / 2)  / 1600 days = ~ 1/16.
            Note: 400 days is the length of the "1-year fade feature" (which is actually closer to 1.2 years).
     6) Assuming the objects that orbit the "massive object" are within the massive object's Hill sphere, the massive object must have a mass of  > 14 × M_Jupiter.
            Note: Anything more massive than ~ 13 × M_Jupiter is a candidate for being a brown dwarf (BD); hereafter I'll refer to the "massive object" as a BD.
     7) The dips are produced by dust (that could be configured as a tail, a coma or a ring system) that originates from moon-size objects orbiting either the BD or planets that orbit the BD.
           Why moons? Because the "gravity well" for the BD, or any orbiting planets, will be too deep! Comets produce dust tails because their gravity wells are shallow.

Again, if anyone questions the above 5 points, I would like to hear from you with your argument (no opinions, please).

Let's review some of the photometric evidence for everything that forces us to the Fact#1 and Fact #2 starting points. (A fuller development of all of the above will be treated in a manuscript, in preparation, that I'm working on with two other authors - one of whom is the person who e-mailed me in July and September predicting a brightening in September or October). By the way, if anyone is aware of a professional astronomer predicting a brightening (and making that prediction before it began) I would really appreciate hearing about that.

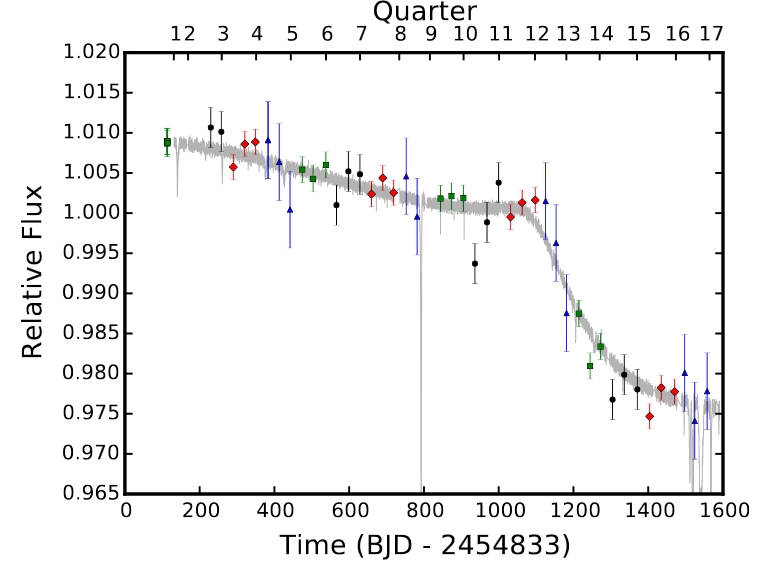
Figure 1.1 shows how my collaborators view what the Kepler light curve would have looked like if Kepler observations had continued beyond Kepler day 1590. Let's refer to the 2 % fade (starting at "B" in Fig. 1.1 and ending at "D") as a "U-Shaped Fade Feature," or "drop" for short. We suggest that the beginning of the "drop" repeated ~ 11 months ago (2016.11.08). Similarly, we suspect that the group of dips ("C" in Fig. 1.1) repeated this year, during May to October. If so, then a brightening should follow this year's group of dips, and it should start October 2017.


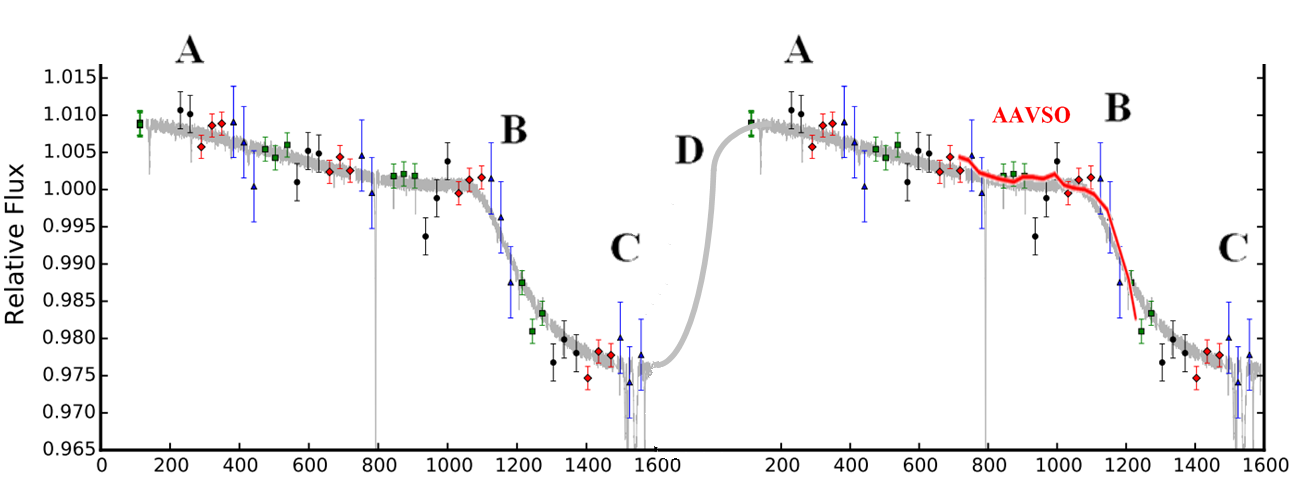
Figure 1.1. Kepler observations, as re-processed and published by Montet and Simon (2016). We have repeated the Kepler data (1580 days worth) with a repeat interval of 1800 days in order to illustrate what might have been observed if Kepler had been able to continue observing KIC846. AAVSO data in the second "B" region agree with the shape of the repeated Kepler "drop" fade. (We prefer a repeat interval of 1600 days, but the details of this are still being worked out.) The letters denote locations of the brown dwarf in its orbit, shown in the next figure.

The interval between the median activity level of Kepler short-term dips and this years dip activity is 1584 ± 44 days (as I described a few days ago on this web page). My collaborator (he is "shy" and he doesn't want me to use his name until receiving a positive review of his work) has developed a model for simulating the transit of complicated ring structures (many rings, each with their own opacity), comas and dust clouds. He has applied this model to a configuration consisting of a brown dwarf (BD) in a 1600-day eccentric orbit. The BD has a ring system, and in addition at least 3 planets (with moons) in orbit about it (within the BD's Hill sphere). Every time the BD and its planets orbit close to KIC846 (periapsis is shortly after "C" in Fig. 1.1), volatiles and dust are released, just like what happens to comets in our solar system (note: this idea is consistent with the KIC846'"snow line"). The BD planets have moons, and they are the source for the release of volatiles and dust (note: the moons have a lower escape speed than the planets they orbit, so volatile-driven dust is able to escape the moons but not the planets). 

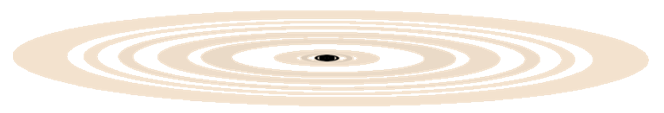
Figure 1.2 is the eccentric 1600-day orbit that my colleague has developed to account for these events (as well as others), to be described in a forthcoming paper. It's my view that the BD has a planet and ring system that is the source for dust that escapes the BD Hill sphere to produce a dust cloud that is responsible for the 1 or 2 % fade every 1600-day orbit. The cloud is kept from continually expanding due to light pressure from KIC846. This implies that dust production is continuous. The "drop" events last ~ 1 year, and they are followed by a brightening due to a clean line-of-sight to the star following passage (in addition, there's a component of brightening due to a change in geometry of starlight illumination of the dust cloud and rings).


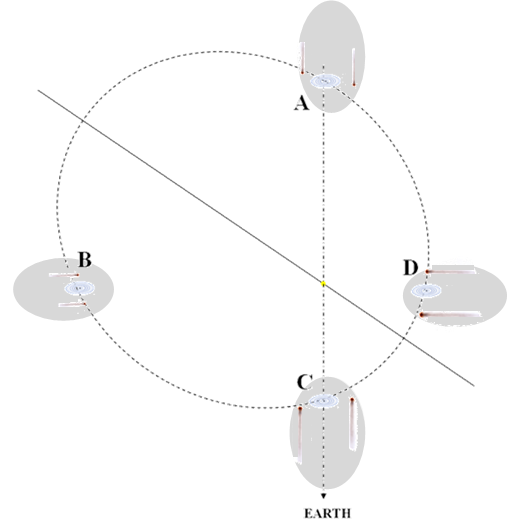
Figure 1.2. Brown dwarf eccentric 1600-day orbit that my colleague has developed to account for the U-shaped "fade" and short-term dips. The BD has a ring system, as well as a couple planets with moons that are subject to the release of volatile molecules and dust (similar to comets) when they are close to periastron (which is now). The dust cloud is just one speculation that might account for the U-shaped "fade" at 1600-day intervals. Another model for the U-shaped fade is being evaluated, which relies upon changes in geometry of reflected light off large particles. The increasing orbital speed may be a factor in producing the ingress/egress asymmetry of the U-shape.   

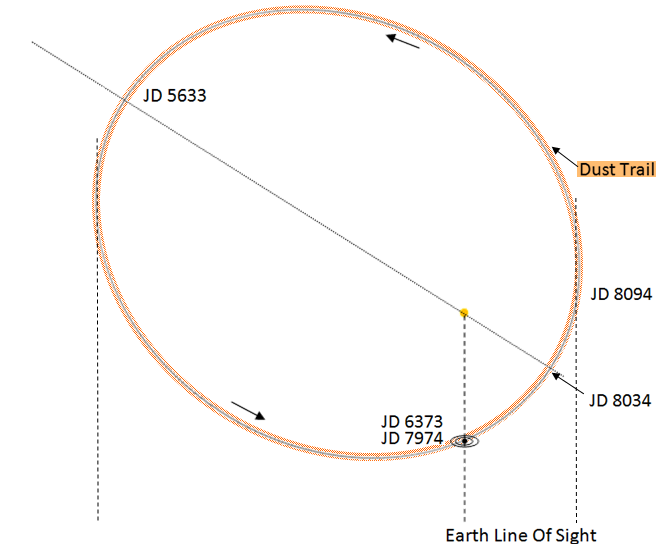
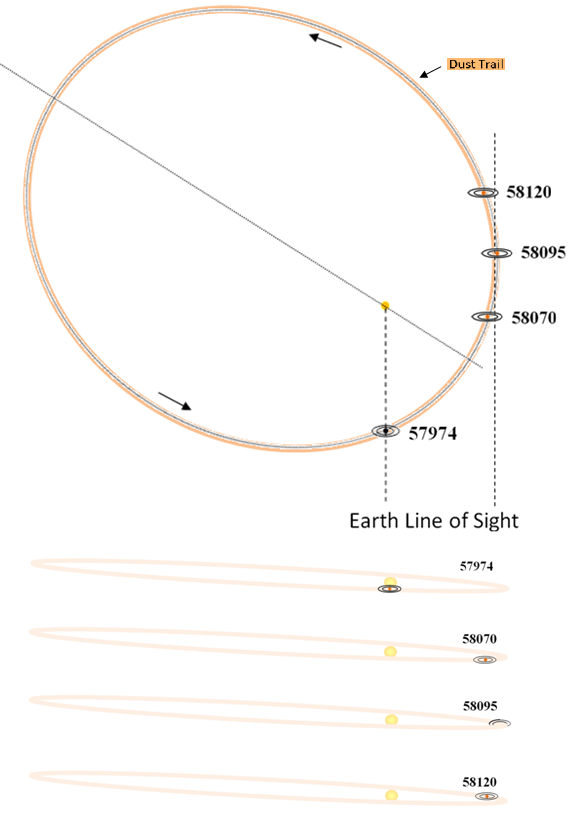
Here's a more accurate depiction of the orbit that we suggest can account for the dip patterns.


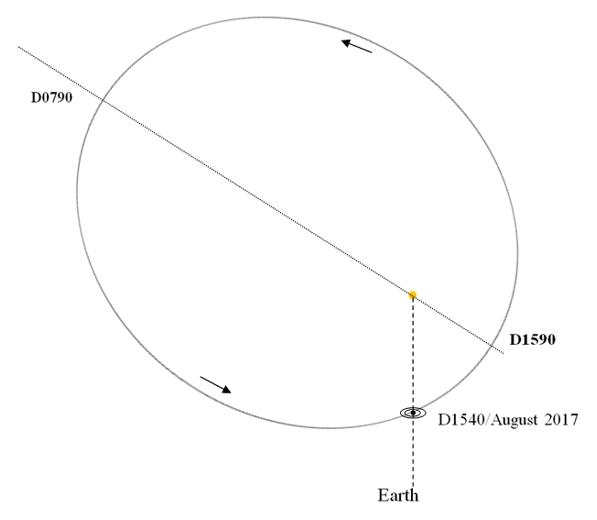
Figure 1.3. Brown dwarf orbit with 3 Kepler day number locations indicated. Eccentricity ~ 0.5, periastron ~ 1.2 AU, apoastron ~ 4.8 AU, period = 1601 days (4.4 years). [Orbit determined by R. Bourne]

The above orbit predicts radial velocity vs. date, RV(t), shown in the next figure below.


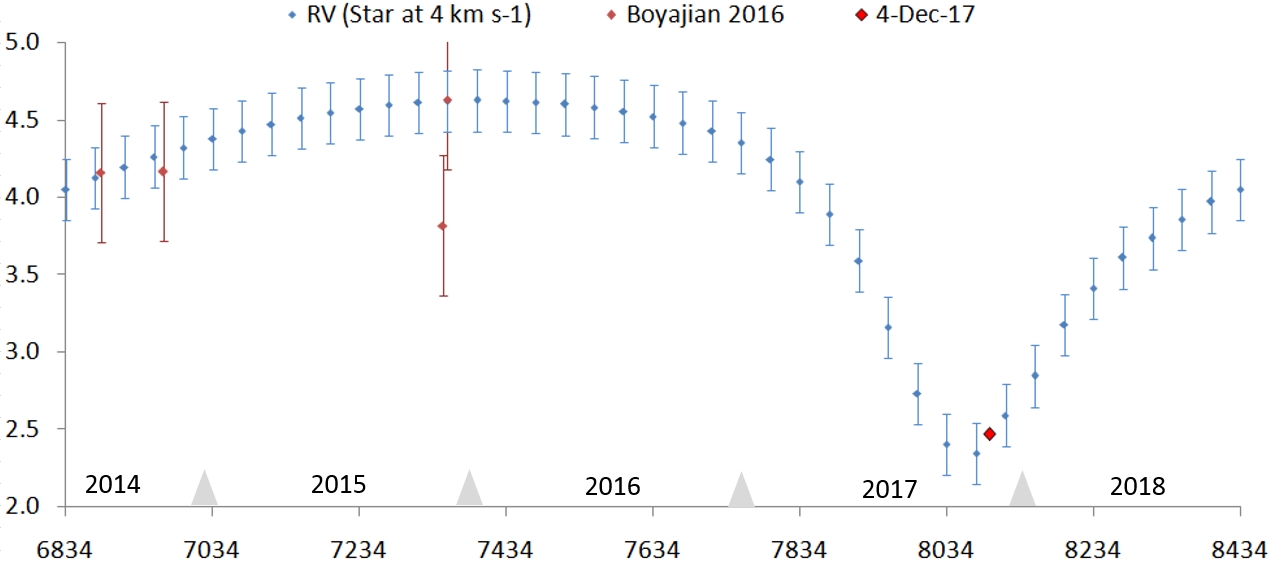
Figure 1.4a. Predicted RV(t) (blue symbols), units of km/s, for the F2V star KIC846 on the assumption that a brown dwarf is in a 1601-day elliptical orbit (e = 0.5) and with the line of apsides oriented in a way to account for a series of transit events at the times they were observed by Kepler in 2013 and ground-based observatories in 2017. The 4 measurements in 2014 and 2015 were reported in the discovery paper. The red diamond shows the "now" date. We've adopted a mass for the brown dwarf near the maximum for such a star, 70 × M_Jupiter. Since RV(t) is proportional to BD mass this is an approximate maximum amplitude model. [These calculations made by R. Bourne]


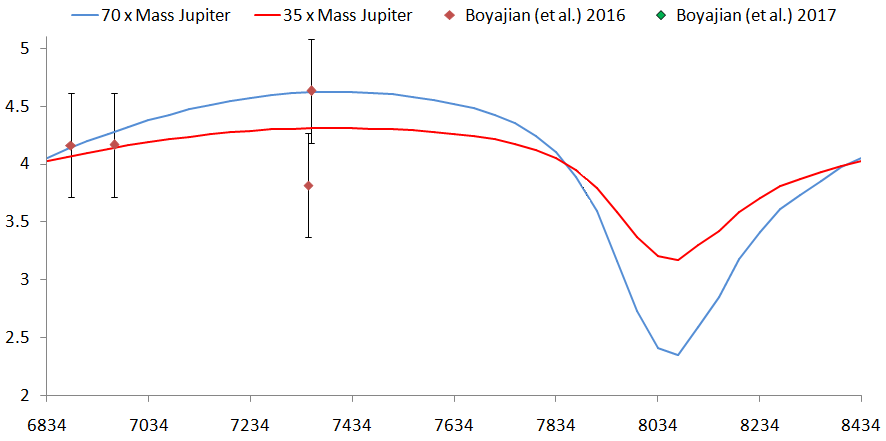
Figure 1.4b. Same as above, but showing how the assumed BD mass affects predicted RV(t).

Since the BD is now going away from our solar system the star KIC846 is approaching at close to the maximum speed in its 4.4-year orbit. (Since the KIC846 binary system has an average motion away from our solar system, which is greater than the orbital speed of the KIC846 star, the previous sentence could be modified to say that the KIC846 star is predicted by our model to be receding from our solar system with a minimum speed.)

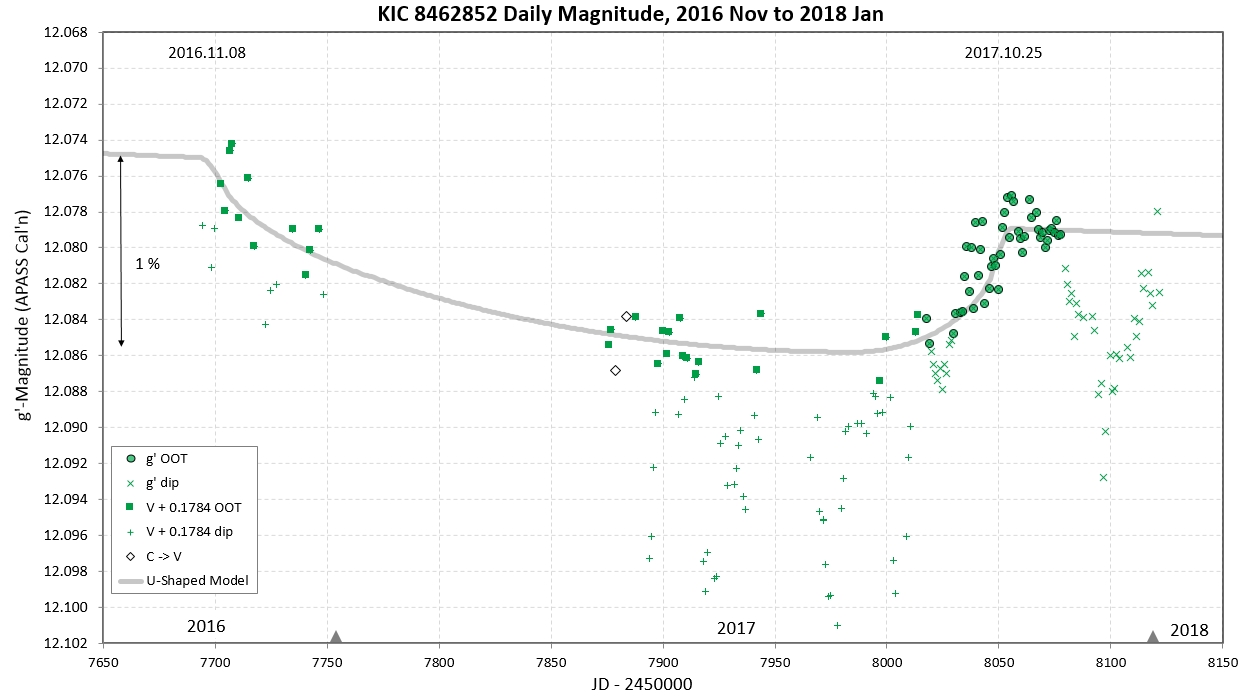
The next figure shows Kepler data (re-analyzed by Montet & Simon, 2016) and HAO measurements of g'-band (and V-band, converted to g'-band) for a 9-year interval. The model trace is a crude representation of an asymmetric U-shaped "fade" with a shape this is approximately compatible with the Kepler observations (assuming their overall pattern repeats every 1600 days). The trace is just a mathematical model; a physical model is now under development for inclusion in a forthcoming paper.  


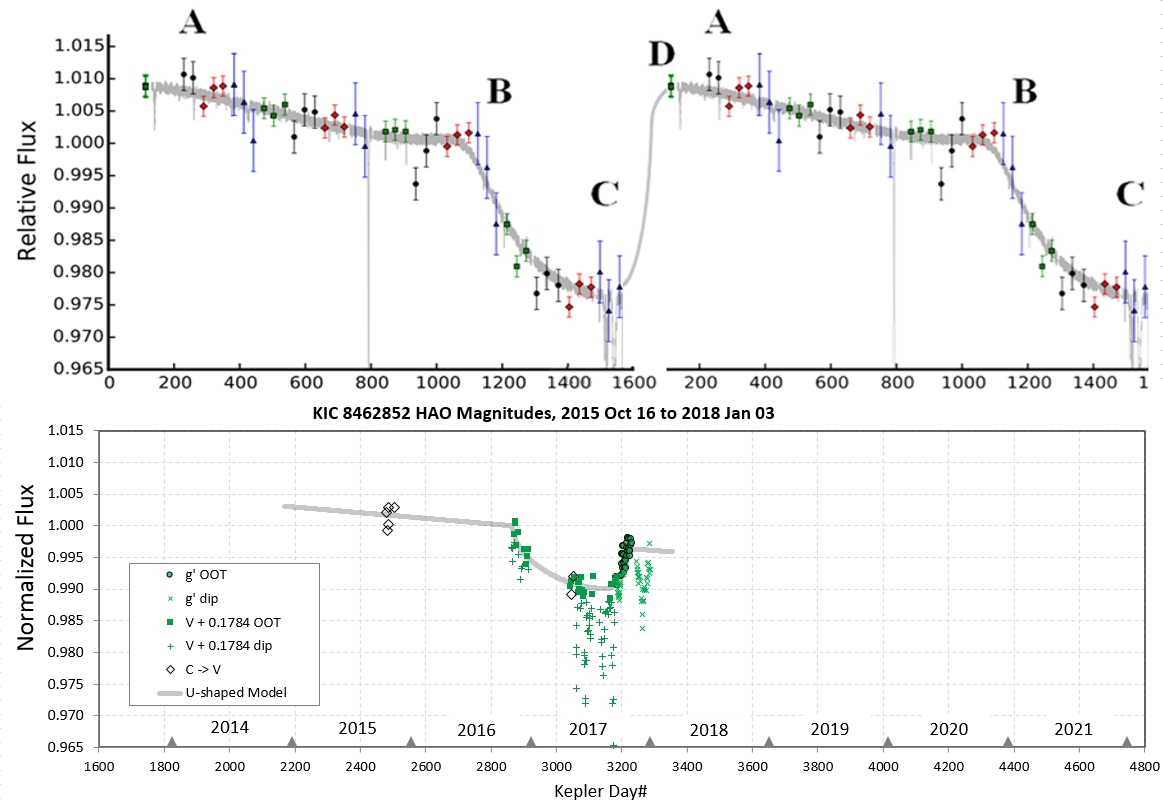
Figure 1.5. Kepler data (upper panel, as re-analyzed by Montet & Simon, 2016) and HAO data vs. Kepler Day# (lower panel). A model for long-term normalized flux that is inspired by the Kepler data has been created to fit the HAO data. The U-shaped "fade" that fits HAO data appears 1600 days later than the U-shaped fade feature that fits Kepler data. The model also includes a linear trend between the U-shaped fades (1600 days apart). The U-shape is asymmetric, meaning that ingress occurs slowly and egress occurs rapidly (with "cosine((t-to)/tau)^0.4" shapes for each half). The current U-shaped fade has a minimum brightness on 2017.07.06; ingress is at 2016.11.08 and egress is at 2017.11.09. The OOT brightness is now approximately half way to a full recovery, according to this mathematical model.

In Fig. 1.5 notice that whereas the shape of this year's U-shaped fade is the same as the U-shaped fade that we claim represents Kepler data, the depth and length differ. According to my simple model fit to the current long-term "drop" fade, its length will be ~ 1.0 years, from ingress to egress. The previous event, observed by Kepler, lasted at least 1.4 years (observations ended before egress, so we can only speculate on the length of the U-shaped fade). Another difference is depth: the current event has a depth of 1.0 % (from ingress to mid), whereas the Kepler depth was ~ 2.4 %.

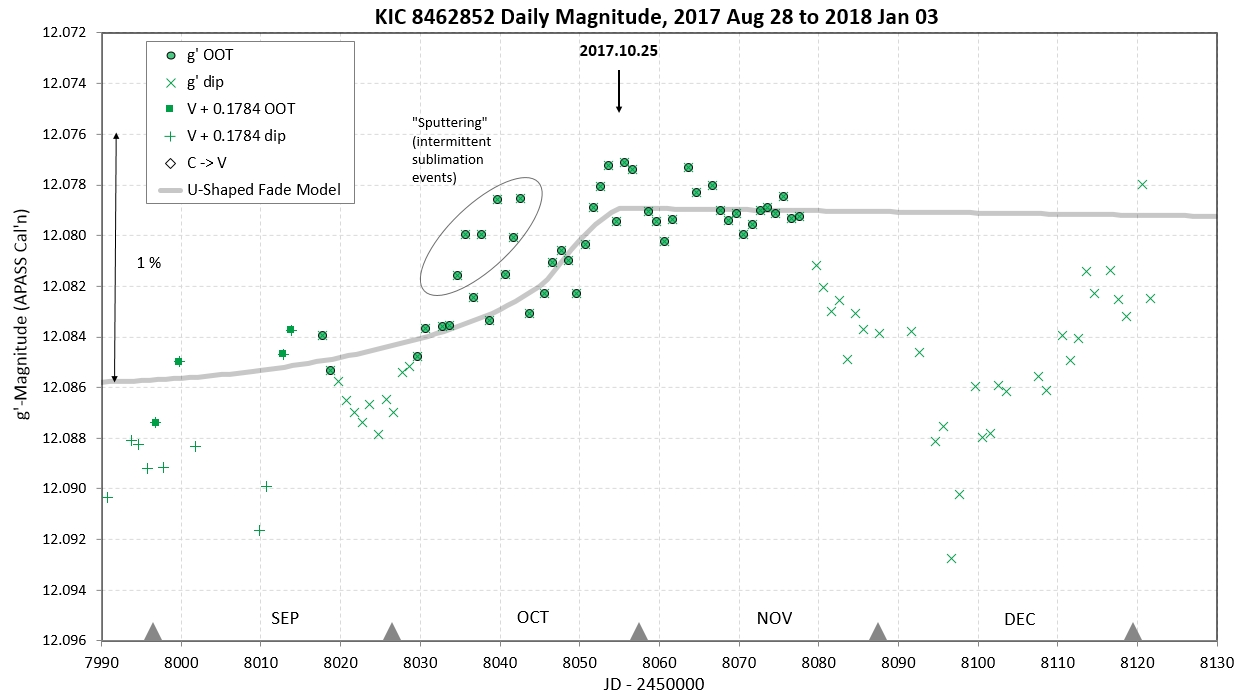
Here's a "zoom" of the lower panel of the previous figure.


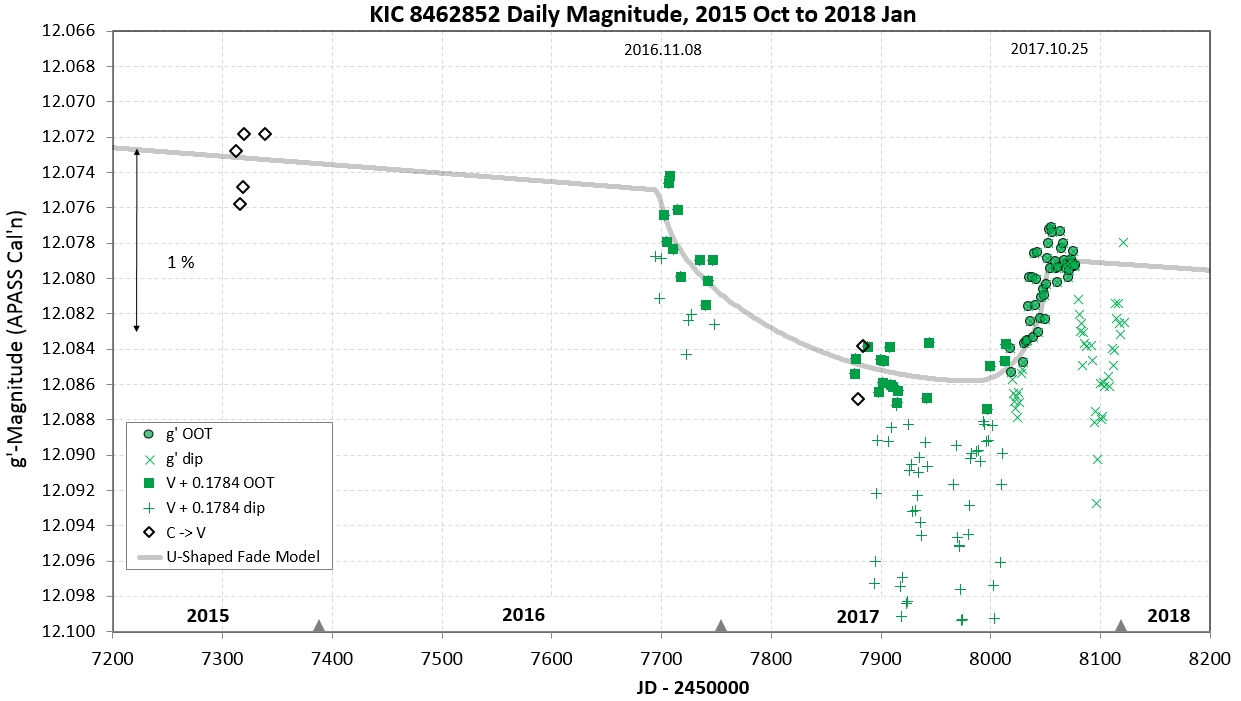
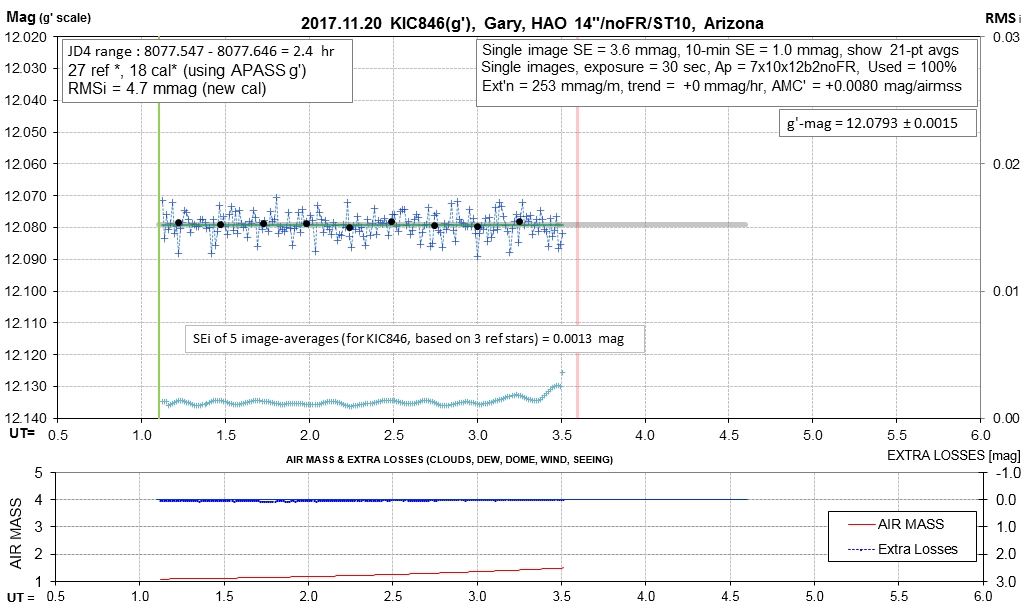
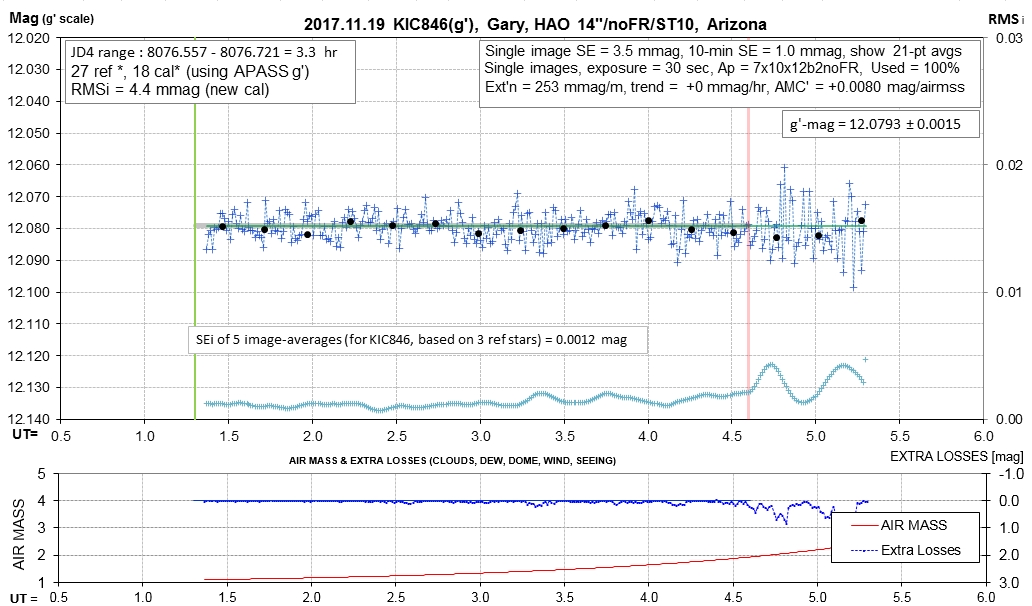
Figure 1.6. HAO  g'-magnitude (and V-mag's converted to g'-mag scale) for the last 1000-day.

We have a draft of a paper that is undergoing "informal" review by a couple experts in the field, and if they endorse submission for publication (subject to the usual suggested changes) we will submit the paper to MNRAS (we can't afford any journal with page charges). If that journal eventually accepts the paper for publication, after many months of reviewer negotiations, it will appear in the journal sometime next year and at arXiv sometime this year. If MNRAS rejects the paper then it will appear at this web site sometime in November.
____________________________________________________________________________________________________________________________________________________________________

Figure 2. Light curve of normalized flux  for "May to now" for HAO V-band and g'-band observations. "Normalized" means that magnitudes have been compared with a long-term model for magnitude vs. date, and since the model I employ includes a U-shaped "fade" feature, with a fast brightening occurring at the present time, any datum that is close to the "1.00 line" is simply confirming that the short-term dips are over and the long-term changes in brightness are continuing to obey the model. The slight rise of recent measurements above the 1.00 line merely means that my U-shaped model is slightly under-estimating the fast rise in brightness now underway. The purpose for this graph is to show the presence and behavior of the short-term dips, not any long-term changes in brightness! (I know this may be a difficult concept to grasp, but try!)

Note: g'-band and r'-band dip depths (and shapes) may differ, with g'-band being more sensitive to dust cloud scattering due to its shorter wavelength (0.47 vs. 0.62 micron). For a reasonable particle size distribution (e.g., Hanson, 0.2 micron) the extinction cross section ratio would produce a depth at r'-band that is 0.57 x depth at g'-band. If g'-band depth is 0.3 %, for example, depth at r'-band could be 0.17 %. The "Tabby Team" measurements (Fig. 4) at r'-band are compatible with that small dip depth. Incidentally, none of these shapes resemble exo-comet tail transits (as described by Rappaport et al, 2017 link); so the mystery of what's producing these week-timescale dips continues! Actually, long oval shapes are known to produce V-shaped dips (think of rings with a high inclination).


Figure 3.  Expansion of previous light curve, showing normalized flux for dates starting in mid-September.
(Repeat of above note: measurements of normalized flux near 1.00 simply mean that my OOT model continues to be valid, which includes a fast brightening at this time). The data in the oval is probably real, and records activity that we'll describe in paper#2. The most recent dip consists of two dips uperimposed, adding up to a total depth of ~ 1.2 %.

Apparently the light curves that appear at reddit are not officially in the public domain, so I am discontinuing posting them at this web page.

Tabby's Star undergoes variations on many timescales. The ASAS and ASAS-SN V-band observations reported by Simon et al. (2017) illustrate the presence of multi-year and multi-month variations. Also, the Kepler data, plus recent ground-based data, show multi-day variations (dips). If one category of variation is to be studied in isolation of the others some method must be devised for modeling the longer-timescale variations in order to remove them for the study of the shorter ones. For example, for the study of multi-day dips it is necessary to model the multi-month variation (underway at the time of the short-timescale variations to be studied). This process is inherently subjective, both in the timescale to be represented by the model and the model chosen for that purpose. I claim that doing something imperfectly, because it's subjective, is better than doing nothing when something should be done (in order to avoid being accused of doing something subjective - which really scares professional astronomers).

Significance of Interval Between Kepler Major Dip Activity and 2017 Dip Activity

The major episode of Kepler mission dip activity
(the first dip greater than 1 % associated with the main group of dips) occurred on JD = 2456344. My estimate of the centroid of activity is JD = 2456370 ± 30. Kepler observations ended before this episode ended so we may consider use of both dates when determining the interval between Kepler dip activity and 2017 dip activity.  The 2017 episode began on JD = 2457893 (May 20), and my estimate of a centroid of activity is JD = 2457954 ± 30. The difference between the Kepler and 2017 dates is 1549 days (using onset dates) and 1584 ± 44 (using centroids of activity). Let's round-up to 1600 days, and adopt it as a tentative interval between repeating dip activity for KIC846.

Let's recall the careful re-analysis of Kepler mission data for KIC846 by Montet & Simon (2016), showing a gradual fade rate followed by an abrupt fade, near the end of which is the main group of dip activity.

 
Figure 6. Kepler data (Montet & Simon, 2016) 1600-day light curve. Fade rate is 0.34 %/year up to Kepler day 1100, after which there is a rapid decline of ~ 2.4 %. Note the onset of the main group of dips near the end, at ~ Kepler day 1537 (JD 2456370). 

The following graph shows my measurements of KIC846 during the past two years. The first set of observations, in 2015, were unfiltered (C-band). In late 2016 I switched to V-band. In early 2017 I made two unfiltered measurements for the purpose of estimating an offset for adjusting C-band mag's to V-band. On 2017 Sep 21 I switched from V-band to g'-band (for reasons described in another section of this web page). Since this switch-over occurred when KIC846 was in OOT state it was possible to convert all previous observations to a g'-mag equivalent. In the following 1600-day light curve I attempted to distinguish between OOT and dip state. The OOT measurements are fitted with a model that is inspired by the Montet and Simon (2016) analysis.


Figure 7a.  Magnitude vs. date for a 1000-day interval showing long-term variation model used for converting g'-band mag's to normalized flux. The model consists of two components, a linear fade from the end of one drop event to the start of the next drop, and a "cosine^0.5" shape with different timescales for ingress and egress. Notice the rising OOT level currently underway!

The OOT model has no physical basis; it is merely a simple mathematical construction that does two things: 1) it fits the OOT data, and 2) it resembles the Montet & Simon (2016) Kepler light curve (in the sense of having a slow decline followed by an abrupt fade during which dip activity occurs). Eventually, a physics-based model for OOT will have to be derived (I'm working with someone on this), and when a physics-based model is derived I expect it to resemble the model in Fig. 7. 

I suggest thinking about the "drop" feature as caused by a cloud
of dust that is obscuring star light (that has escaped the Hill spheres of several objects in orbit around a big planet, or BD, in a 1600-day orbit). The small fade before the "drop" feature start may correspond to the Kepler 0.34 %/year fade region that preceded the Kepler 2.4 % drop. The current 1.0 % "drop" may be analogous to the Kepler 2.4 % drop. Yes, I'm suggesting that the two drop depths differ, which could simply mean that the optical depth of this broad dust cloud, or its inclination (impact parameter), varies with time.


Figure 7b.  An expanded version of the previous figure, showing magnitude vs. date for a 10-month interval (500 days) that includes a brightening, or recovery, from the 2017 "Drop Fade" event. Recovery is shown to be complete (using this purely mathematical, not physical model) at the end of October.

The next figure shows g'-mag for a 100-day interval, during the recovery (egress).


Figure 8.  Magnitude vs. date for the 2017 140-day interval of U-Shaped Fade recovery (egress). One might make the argument that the g'-band measurements have become noisier as the "edge" of the large obscuring dust cloud, the one producing the long-term "drop" of  flux, crosses our line-of-sight; of course.  


Figure 9.  Could there be a 10.6-day periodicity during the past 30 days? If so, it has a decreasing amplitude. Why? Imagine a moon orbiting the BD (or a planet orbiting the BD) with a period of 10.6 days. The entire BD system is now moving away from closest approach to the star, ~ 1.5 AU (according to RB's celestial mechanics orbit solution), so it is becoming cooler and less active in producing sublimation-driven dust, just like a comet moving away from our sun. The idea here is that as the moon orbits inward, closer to the star, it is heated and become more active; as it then orbits away from the star it cools and becomes less active. All of that is superimposed on a BD motion that is now away from the star. Of course, this is just speculation, but there's nothing wrong with speculating when we have puzzling observations that demand some explanation! (An actual explanation exists, but we may never know it, so in the meantime, let's have fun with speculating!) There was an abrupt dip that began Nov 21; it reached a maximum depth of 0.45 ± 0.06 % on Nov 26, and has not yet begun to recover. In fact, another dip, 0.35 % depth, is superimposed on the first one. Very interesting!

What can be the explanation for the current double-fade event? A dip depth of 0.45 % lasting ~ 11 days, then an additional dip with depth 0.8 %, for a total of ~ 1.2 %. With this darned star, anything is possible!  

AAS Research Notes (2nd article highlights)

The 2nd AAS Research Notes article hasn't been published yet, but it has appeared at arXiv. In case you haven't seen it, here's a teaser:

Abstract  We report 33 V-band observations by the Hereford Arizona Observatory (HAO) of the enigmatic star KIC 8462852 during the two week period 3-17 August 2017. We find a striking resemblance of these observations to the Kepler day 1540 dip with HAO observations tracking the Kepler light curve (adjusted for egress symmetry). A possible explanation of this potential repeat transit is a brown dwarf and extensive ring system in a 1601-day eccentric orbit. We suggest this object may be detectable through radial velocity observations in October and November 2017, with an amplitude of ~ 1-2 kms-1. 


Figure 2.1. Kepler D1540 dip (black trace) with a reverse egress overlaid on ingress (red trace) and this year's HAO light curve for August 9 (1601 days after D1540), plus one measurement by Dr. Boyajian on JD 2457974. 


Figure 2.2. Brown dwarf with a ring system extending 0.2 AU across and tilted ~ 9 degrees from edge-on which can account for the Kepler and HAO observations.

Also, check out this YouTube animation of the transit: link
 
List of Observations (for all earlier observations, before Nov 13, go to link)

2018.01.03  
2018.01.02  
2017.12.31  
2017.12.30  
2017.12.29  
2017.12.26  
2017.12.25  
2017.12.24 
2017.12.23  
2017.12.21 
2017.12.20  
2017.12.16  
2017.12.15  
2017.12.14  
2017.12.13 
2017.12.12  
2017.12.09  
2017.12.08  
2017.12.07  
2017.12.05  
2017.12.04  
2017.11.30  
2017.11.29  
2017.11.28  
2017.11.27  
2017.11.26  
2017.11.25  
2017.11.24  
2017.11.23  
2017.11.22  
2017.11.21  
2017.11.20  
2017.11.19  
2017.11.18  
2017.11.17  
2017.11.16  
2017.11.15  
2017.11.14  
2017.11.13  
 

Daily Observing Session Information (most recent at top)


2018.01.03, g'-band, 1.7 hrs   DataExchangeFile  


2018.01.02, g'-band, 1.9 hrs  DataExchangeFile  


2017.12.31, g'-band, 1.6 hrs  DataExchangeFile 


2017.12.30, g'-band, 2.0 hrs  DataExchangeFile  


2017.12.29, g'-band, 2.0 hrs  DataExchangeFile  


2017.12.28  Clouds too thick.Won't use.


2017.12.27  Too many clouds, only 0.5 hrs of useable data.

2017.12.26, g'-band, 2.5 hrs   DataExchangeFile  


2017.12.25, g'-band, 2.3 hrs   DataExchangeFile  


2017.12.24, g'-band, 3.5 hrs  DataExchangeFile  

Cirrus clouds for almost the entire observing session, but "I was desperate."


2017.12.23, g'-band, 1.7 hrs  DataExchangeFile  


2017.12.22  Seeing bad (wind)

2017.12.21, g'-band, 3.0 hrs  DataExchangeFile  


2017.12.20, g'-band, 3.0 hrs   DataExchangeFile  


2017.12.19  Cloudy  

2017.12.18  Raining 

2017.12.17  Cloudy

2017.12.16, g'-band, 2.3 hrs  DataExchangeFile  


2017.12.15, g'-band, 2.6 hrs   DataExchangeFile  


2017.12.14, g'-band, 2.9 hrs  DataExchangefile  


2017.12.13, g'-band, 2.6 hrs   DataExchangeFile  

Good weather, finally!


2017.12.12  Desperate for data! 0.3 hrs of useful data.


2012.12.11  Cloudy (but some data) 

2017.12.10  Cloudy, no data.

2017.12.09, g'-band, 2.5 hrs  DataExchangeFile  

Good weather and normal observatory operation, but unusual result! The star is fainter than the night before by 0.0049 mag (~ 0.5%)!


2017.12.08, g'-band, 2.8 hrs   DataExchangeFile  


2017.12.07, g'-band, 1.7 hrs   DataExchangeFile  

Occasional clouds, but useable.


2017.12.06 Cloudy & rain.

2017.12.05, g'-band, 1.5 useful hrs   DataExchangefile  


2017.12.04, g'-band, 1.7 hrs  DataExchangeFile  

Cirrus was thin enough, often enough, to obtain some usable data.


2017.12.03 = cloudy, no data

2017.12.02 = cloudy, no data

2017.12.01 = cloudy, no data

2017.11.30, g'-band, 1.5 hrs   DataExchangeFile  

Mostly cloudy so data is "marginal."


2017.11.29, g'-band, 0.5 hr  -  Too cloudy and too short an obs'g session to use.


2017.11.28, g'-band,2.3 hrs   DataExchangeFile  


2017.11.27, g'-band, 3.7 hrs   DataExchangeFile  


2017.11.26, g'-band, 3.7 hrs  DataExchangeFile 

Looks like a deeper dip is starting!


2017.11.25, g'-band, 2.5 hrs  DataExchangeFile  


2017.11.24, g'-band, 2.1 hrs  DataExchangeFile  


2017.11.23, 2.9 hrs, DataExchangeFile  


2017.11.22, 1.6 hrs Data questionable

Another cloudy night in Arizona. The measurement result is compromised by cloudiness at high air mass and won't be used in the summary plots (above).


2017.11.21

Too much cirrus! No data for this date.

2017.11.20, g'-band, 2.4 hrs  DataExchangeFile  


2017.11.19, g'-band, 3.3 hrs  DataExchangeFile  


2017.11.18, g'-band, 3.1 hrs  DataExchangeFile  


2017.11.17, g'-band, 3.2 hrs  DataExchangeFile  


2017.11.16, g'-band, 3.9 hrs  DataExchangeFile  


2017.11.15, g'-band, 4.1 hrs  DataExchangeFile   


2017.11.14, g'-band, 3.7 hrs  DataExchangeFile  


2017.11.13, g'-band, 2.8 hrs  DataExchangeFile  


Model for 2017 November/December Photometric Behavior

Here's a light curve showing the 2017 November/December 2-component fade feature that Rafik Bourne has suggested might be explained by a model, which is described in this section.


Figure 2.1. Normalized flux, using a U-shaped long timescale model for out-of-transit brightness. Notice a gentle fade that starts in mid-November (at x-value of May 205), which stabilizes at a depth of 0.45 % (normalized flux = 0.9955), when a new fade occurs ("December Surprise") reaching an additional fade of ~ 0.8 % (normalized flux = 0.9875), which slowly rises back to the 0.45 % depth level and then gradually begins a recovery to what we expect is the 100 % normalized flux (at x-value at ~ May 250).

Rafik has suggested the following model that may account for this photometric behavior (which requires more simulations before he's really secure about it):

1) A sublimating object with low mass (such as a comet) produces dust and gas.The gas that is ionized is captured by the solar wind's magnetic field and forms a gas tail. Small dust particles are pushed away from the sun by radiation pressure, forming a dust tail. Large dust particles stay in the same approximate orbit as the comet, and they form a "dust trail" that eventually is distributed along large parts of the comet's orbit. Meteor showers that occur every year are due to these "dust trails" of large particles. The tails are illustrated in Fig. 2.2 and an image of a comet dust trail is shown in Fig. 2.3.

2) Rafik suggests that the BD produces a "dust trail" that is present for a long azimuthal potion of its orbit (both following and leading the BD). These would consist of particles large enough to not be pushed away by radiation pressure. However, these large dust particles are still small enough to be sufficiently numerous that they can obstruct an amount of light from a bright object behind them and cause a measurable fade. Fig. 2.4 shows an eccentric orbit that we propose for the BD. 

3) The BD ring system is now side-lit and is a source of brightening that adds to the light from KIC846. This is what we propose is responsible for the long timescale brightening of ~ 1 % that occurred in October, and which Rafik Bourne predicted in July would occur in September (with a revised prediction in August for a brightening to occur in October, after he recognized that the August 09 fade event was a repeat of the Kepler D1540 dip).

4) The bright BD ring system began to be blocked by the "dust trail" in mid-November (Fig. 2.1 x-value of May 2015). This produced a gradual dimming as the blocking went from the outer ring system to the inner ring system. The "December Surprise" dip is produced when the inner ring system (which is much brighter than the outer rings) is blocked by the intervening "dust trail." The slow recovery corresponds to the orbital movement of the BD ring system out of the line-of-sight of the tangent portion of the "dust trail."  There remains some blockage, but at the same time the ring system is undergoing a brightening due to the illumination geometry shifting from side-lit to front-lit. Better models will be needed to account for these competing components for brightness changes.

5) We may see the brightness level reached in early January to be higher than in early November due to the increasingly front-lit geometry and reduced "dust trail" blocking. Much of what happens will depend upon such subtle parameters as orbit inclination, tilt of the ring system, orientation of the ring system pole, azimuthal distribution of the "dust trail" and other things that we haven't yet considered. 

Much work remains, both observational and modeling.


Figure 2.2 Comet gas and dust tails (courtesy of Wikipedia). The gas tail consists of positively charged gas molecules that are captured by the solar wind's magnetic field and pulled outward with the solar wind. The dust tail is in response to sunlight radiation pressure pushing small particles outward. Larger dust particles are less affected by rdiation pressure and stay in the same orbit as the comet, which is the origin of a "dust trail."


Figure 2.3. Image showing a "dust trail" along the orbit of Comet Encke (courtesy of Wikipedia).


Fig. 2.4. Proposed orbit of a brown dwarf (BD) orbiting KIC846. The BD has an extensive ring system, and moons (or planets with moons) which have low enough mass for sublimated dust to escape the moons and form a "dust trail" along the BD orbit. The JD notations are JD - 2450000, and correspond to the following dates: JD 5633 = 2011 Mar 13 = Kepler day# 800 (close to D800, a 16 % Kepler mission dip, produced by an object in a different orbit from the BD; this is a date when weekly variability is a minimum, and when we suggest the BD was farthest from the KIC846 star), JD 6373 = 2013 Mar 22 = Kepler day# 1540 (when a 3 % Kepler dip occured, with a shape exactly the same as for 2017 Aug 09), JD 7974 = 2017 Aug 09 (when many ground-based observers observed a 3 % dip with structure exactly the same as for Kepler D1540, and when we suggest the BD and its ring system was producing a grazing transit of the KIC846 star), JD 8034 = 2017 October 08 (when we suggest the BD was closest to the KIC846 star), JD 8094 = 2017 Dec 07 (when we suggest the BD was on a tangent part of its orbit, when the ring system started to be blocked by the BD's "dust trail." [Not to scale; meant for visualization purposes only] 


Figure 2.5. Depiction of suggested locations of the BD ring system for 4 dates. The first date (57974 = 2017 Aug 09) is for the transit of the ring system in front of the star, producing a 2-component dip structure that is a repeat of the Kepler D1540 dip. The next date (58070 = 2017 Nov 13 = May 197 ) is a week before the left edge of the ring system is occulted by the dust trail. The 3rd date (58095 = 2017 Dec 08 = May 222) is when the inner rings system (the brightest due to reflection of star light) is occulted by the dust trail, which accounts for the central dip
("December Surprise"). The last date (58120 = 2018 Jan 02 = May 247) has not yet been observed, but is when we expect the ring system to come out of occultation by the dust trail and show a recovered OOT brightness. [Not to scale; meant for visualization purposes only] 

Is KIC846 Unique?

KIC846 is unique among the archive of observed objects. But, is it likely to be unique among in our galaxy? Someone e-mailed me this question, and I'm repeating my answer below.

With the Kepler mission rare finds can be expected since ~ 180,000 stars were monitored (or that many star systems, where binaries constitute one system). So far I have observed 4 of these weird Kepler systems in response to follow-up requests by Kepler mission people (during the past couple years), and in each case the unusual star initially appeared to be one-of-a-kind. However, further study presented evidence that such objects were only rare because they were oriented in a way that allowed orbiting objects to transit our line-of-sight to the star (or transit the brighter of the two binary objects).

Consider the following two assumptions: 1) 1/2 of all stars are in binary systems (i.e., 1/3 of stars that appear as one star upon superficial inspection are actually a binary), and 2) with 180,000 stars there is a reasonable probability (50 %) that one of them will be a binary with orbit inclination closer to edge-on than 0.0015 degree. The second point can be calculated in the following way: delta-i = 90 deg. / (1/3 * 180,000) =  0.0015 degree. For orbits this close to 90 deg inclination (edge-on) a small object (or the smaller star) will transit the (larger) star for orbit radius as large as 19,000 x R_star, or 280 AU for KIC846. Such large orbit sizes increase the probability of observing transits, especially by far out planets or other objects.

This way of viewing the probability of observing something can be turned-around for the purpose of assessing how frequently something observed is found in nature. For example, KIC846 is a one-of-a-king object for the present archive of observations. If we set the probability of finding a system like it to 50 %, we can estimate how common such systems are. Since we think the dips are produced by something close to grazing geometry, with P ~ 4.4 years, the orbit size is ~ 3.0 AU. Since 3 / 280 = 1.0 %, one in 100 star systems may resemble KIC846. In other words, among the 180,000 star (systems) observed by Kepler there might have been ~ 1800 that were like KIC846, but because we wouldn't observe transit behavior like that of KIC846 unless inclination was closer to 90 degrees than 0.0015 degrees, we only observed one such system.

Why I Switched from V- to g'-band 

There are three reasons I expect my g'-band observations to be better quality than my previous V-band observations: 1) I've adopted a fixed set of photometry apertures after determining that in a crowded star field (like KIC846) the use of variable (or dynamic) photometry signal aperture radius produces systematic artifacts. This is caused by the PSF of stars near the reference star encroaching into the signal aperture of the reference star (in fact, whereas using a dynamic signal aperture size that broadens when PSF becomes larger the opposite behavior should be employed for minimizing these systematics; e.g., signal aperture size should instead become smaller when PSF increases). 2) the g'-band passband is "cleaner" than the V-band passband; g'-band doesn't have "wings" because the transmission function is rectangular-shaped instead of Gaussian-shaped (as exists for V-band); g'-band measurements are therefore less influenced by star-specific SED structure (e.g., short of 400 nm) and also less influenced by star color. 3) The g'-band has a higher "through-put" so more photons are available, providing a higher SNR.

Another reason for switching to g'-band is that g'-mags compared with with r'-mags are scientifically more useful because the effective wavelength of g'-band is less than V-band (460 nm vs. 540 nm); g'-band is between B- and V-band. In other words, the wavelength difference between g' and r' is greater than that for V and r'. This is useful when dust cloud scattering is occurring because g'-band should exhibit deeper dip depths than at V-band, so the ratio of r' depth to g' depth should differ from 1.0 more than the ratio of r' depth to V depth.

I expect that there should be lower systematic errors for my new use of g'-band than my old procedures that used V-band. So far, this is borne out by measurement, where my g'-band measurements exhibit a day-to-day scatter of < 1 ppt.


Figure 2.1. Filter passbands for the classical BVRcIc and SDSS g'r'i'z' bands. 

General Comment on Overall Dip Pattern

Reviewing the Kepler LC and the 2017 ground-based LCs, it's my impression that KIF846 exhibits an overall pattern of an "episode" of dips at intervals of ~ 4.4 years. An episode consists of ~ 7 to 10 dips during 4 or 5 months (based on the 2017 observations). Kepler observations of KIC846 ended during a dip episode, and this may account for the shorter (2-month) Kepler episode. In addition, the Kepler LC has one deep dip (16 %) half way between dip episodes (assuming a 4.4-year interval between episodes).

This pattern suggests
the presence of a cluster of dust cloud sources, in orbit about something massive enough for them to be within the Hill sphere, all of which orbit with a 4.4-year period (average distance of 3.0 AU). The radius of the cluster is ~ 4.5 % of the orbit circumference (2.5 months / 4.4 years). This means the Hill sphere radius Rh = 0.42 AU (0.045
× pi × 3.0 AU). To have a Hill sphere this large requires an object with a mass, M_obj, at least 0.0082 × M_star. Assuming M_star = 1.43 × M_sun, M_obj > 12 × M_Jupiter. This is at the lower boundary for brown dwarf masses. This object must be either a very massive planet or a small brown dwarf. Let's refer to it as a brown dwarf (BD) since our mass derivation was a lower limit. The BD may have a half dozen planets in orbit based on the number of transits during the 2017 observations. There could be fewer planets, because a planet with an orbit radius = 0.25 × Rh, for example, would have a period of < 117 days. Such a planet could produce two dips per 5-month "episode." Planets in smaller orbits could produce even more dips per "episode." (By the way, celestial mechanics essentially forbids a set of objects to be in identical orbits at orbit phases within a 4.5 % of each other for more than a few orbits, because such a configuration is not stable. Small perturbations, such as the gravitational attraction of the bodies for each other, would quickly modify their orbits. The only way to have several dust-sources remain this close to each other in orbit phase is for them to be orbiting something massive enough that its Hill sphere includes their orbits. Tha's what I described above.)

None of the above addresses the matter of dust cloud shape (e.g., rings, tails, coma, etc), or production mechanism (sublimation, collisions, etc), or how orbits evolved to such a state. Those are difficult problems. What I have presented is merely an obvious starting point for such modeling based on the overall pattern of dips already observed.

Finder Chart

It has taken over a year to figure out which stars are reliably stable. I now use 18 stars for reference, some of which are shown in the next image.


Finder image, FOV = 15 x 10 'arc, north-east at upper-left, showing the 34 stars that have been evaluated for use in calibration (based on variability and trend). 18 stars have been adopted (circled) and 15 stars have been rejected (crosses).

I have evaluated stability of 34 stars near KIC846, and have accepted 18 for calibration use and have rejected 15. My acceptance criterion is based on RMS of daily averages, and also trend, during several months of data. My use of the 18 accepted stars began with observing date 2017.09.07. Some star behavior is described at link. The numbering is a ranking of stability; i.e, star #1 is the most stable and star#19 is the least stable among those accepted for use (the stars with crosses are either worse or exhibit a trend). I will eventually create a another web page summarizing behavior of all 34 stars. 

My Collaboration Policy

At my age of 78 I'm entitled to have fun and avoid work. Observing and figuring things out is fun. Writing papers is work. Besides, most people really don't care about what others have done. (For example, Google "WD 1145+017" and among the several pages of lame links none point to my web pages.) So, if anyone wants to use any of my observations for a publication, you're welcome to do so. But please don't invite me for co-authorship!

My light curve observations are "in the public domain." This means anyone can and may download of all LC observations, and use or misuse any of that data for whatever purpose. If my data is essential to any publication just mention this in the acknowledgement section (I'm not interested in co-authorship).

Any researcher who wants to "collaborate" with me during the planning or conduct of observations (such as spectroscopic, or multi-wavelength photometry, or high precision/short timescale photometry) can do so without my sharing information about this collaboration with anyone else. I will not share information about any such collaboration with anyone.
 
References

    Boyajian, Tabetha S. and 198 others, "The First Post-Kepler Brightness Dips of KIC 8462852" arXiv 
    Deeg, H. J., R. Alonso, D. Nespral & Tabetha BOyajian, Non-grey dimming events of KIC 8462852 from GTC spectrophotometry" arXiv 
    Bourne, R., B. L. Gary and A. Plakhov, "Recent Photometric Monitoring of KIC 8462852, the Detection of a Potential Repeat of the Kepler Day 1540 Dip and a Plausible Model," arXiv:1711.10612     
    Bourne, Rafik and Bruce Gary, "KIC 8462852: Potential repeat of the Kepler day 1540 dip in August 2017," submitted to AAS Research Notes, preprint: arXiv:1711.07472
    Xu, S., S. Rappaport, R. van Lieshout & 35 others, "A dearth of small particles in the transiting material around the white dwarf WD 1145+017," approved for publication by MNRAS link, preprint arXiv: 1711.06960 
    Gary, Bruce and Rafik Bourne, 2017, "KIC 8462852 Brightness Pattern Repeating Every 1600 Days," published by Research Notes of the AAS at link; preprint at arXiv:1711.04205
    Neslusan, L. and J. & Budaj, 2016, "Mysterious Eclipses in the Light Curve of KIC8462852: a Possible Explanation, arXiv: 1612.06121v2  (a "tour de force"; I highly recommend this publication)
    Neslusan & Budaj web site with animation of their way of explaining Kepler D1540 dip:   http://www.astro.sk/~budaj/kic8462.html
    Wyatt, W. C., R. van Lieshout, G. M. Kennedy, T. S. Boyajian, "Modeling the KIC8462852 light curves: compatibility of the dips and secular dimming with an exocomet interpretation," submitted to MNRAS, arXiv  
    Grindlay interview about Schaefer's assertion that KIC846 exhibited a century long fade using DASCH data: link
    Hippke, Michael and Daniel Angerhausen, "The year-long flux variations in Boyajian's star are asymmetric or aperiodic," submitted to ApJL, arXiv 
    Sacco, G., L. Ngo and J. Modolo, "A 1574-day Periodicity of Transits Orbiting KIC 8462852," arXiv
    Rappaport, S., B. L. Gary, A. Vanerdurg, S. Xu, D. Pooley and K. Mukai, "WD 1145+017: Optical Activity During 2016-2017 and Limits on the X-Ray Flux," arXiv, Mon. Not. Royal Astron. Soc.
    Steele, I. A. & 4 others, 2017, "Optical Polarimetry of KIC 8462852 in May-August 2017,"MNRAS (accepted), arXiv.
    Simon, Joshua D., Benjamen J. Shappee and 6 others, "Where is the Flux Going? The Long-Term Photometric Variability of Boyajian's Star," arXiv:1708.07822 
    Meng, Huan Y. A., G. Rieke and 12 others (including Boyajian), "Extinction and the Dimming of KIC 8462852," arXiv: 1708.07556  
    Sucerquita, M., Alvarado-Montes, J.A. and two others, "Anomalous Lightcurves of Young Tilted Exorings," arXiv: 1708.04600   Also: New Scientist link and Universe Today link.
    Rappaport, S., A. Vanderburg and 9 others, "Likely Transiting Exocomets Detected by Kepler," arXiv: 1708.06069 
    Montet, Benjamin T. and Joshua D. Simon, 2016, arXiv 
    Boyajian et al, 2015, MNRAS, "Planet Hunters X. KIC 8462852 - Where's the flux?" link
    Ballesteros, F. J., P. Arnalte-Mur, A. Fernandez-Soto and V. J. Martinez, 2017, "KIC8462852: Will the Trojans Return in 2011?", arXiv
    Washington Post article, 2015.10.15: link
    AAVSO Campaign Notice requesting KIC646 observations
    AAVSO LC Generator https://www.aavso.org/data/lcg (enter KIC 8462852)
    Web page tutorial: Tips for amateurs observating faint asteroids (useful for any photometry observing)
    Book: Exoplanet Observing for Amateurs, Gary (2014): link (useful for any photometry observing) 
    wikipedia description of Tabby's Star  
    My web pages master list, resume


    B L G a r y at u m i c h dot e d u    Hereford Arizona Observatory    resume 
 
This site opened: 
2017.11.14. 
Nothing on this web page is copyrighted.