KIC 8462852 Hereford Arizona Observatory (HAO) Photometry Observations #11
Bruce Gary, Last updated: 2021.10.29, 23 UT

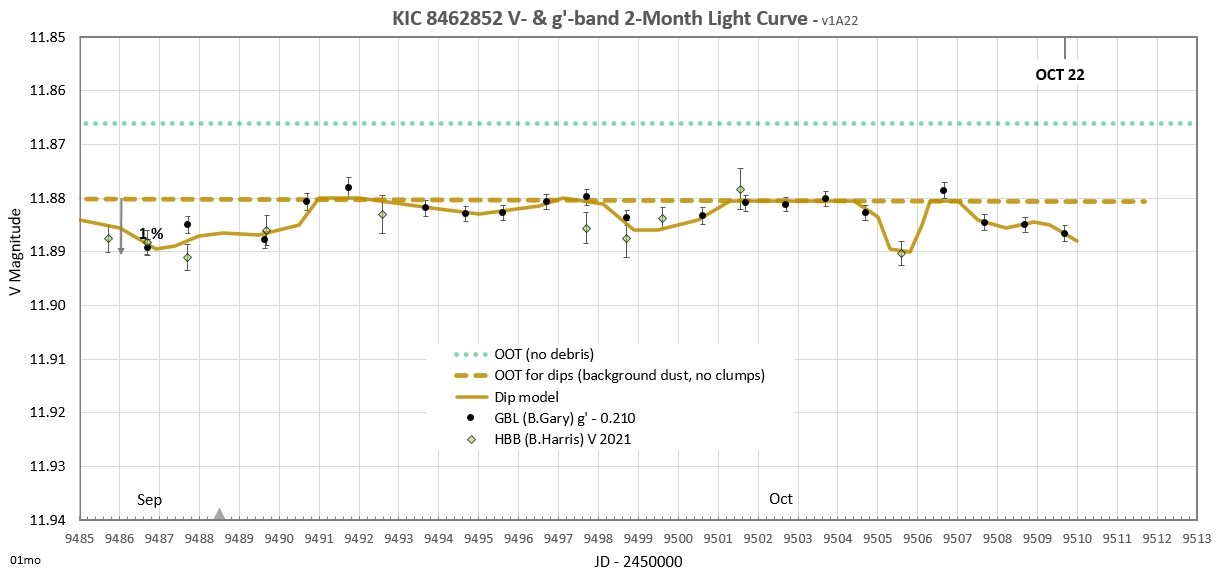
Another dip has begun (following the possible D800/TESS dip of Oct 18). It appears to have a depth of 0.6 % and may be increasing. Regarding the predicted transit on Oct 18, I think we observed it but since none of our observing sets registered the ingress or egress structures (because they must have happened between observing sessions), and because I was unable to observe with g', r' and i' on the date of the dip (due to clouds), we can only say that our observations are compatible with Rafik's predicted transit while they are insufficient to confirm the presence of a transit by an optically thick object (in an orbit of 776 days).


Four nights ago was the 2nd of two nights for a predicted window for a 1 % dip lasting < 1 day due to the return of the Kepler D800/TESS dip. On Night 1 Barbara Harris (Florida) and Paul Benni (Boston) observed for 3 or 4 hours; neither found a change in brightness that could be attributed to an ingress (or egress) feature. Yenal Ogmen (Cyprus) didn't observe and Joao Gregorio and I were clouded-out! Joe Garlitz (Oregon) and John Hall (Colorado) are working with their data; Tabby Boyajian has data for each of 7 nights from 3 observing sites (but that data is for intervals that are too brief for detecting ingress or egress structure). On Night 2 I was able to observe, and obtained a brightness level corresponding to "OOT for dips." Paul Benni also got data for Night 2, as did Joao Gregorio (but Paul's data for Night 2 was with a different filter, and may not be usable). Night 3 has become crucial for establishing that a dip of ~ 1 % occurred at the approximate predicted time. By offsetting the Benni data to match Gary data we are able to place the Night 1 and 2 Benni data on the Gary/Harris magnitude scale. This allows for a complete 4-day light curve, and it shows the presence of a 1 % dip that lasted < ~ 1 day (which is consistent with the D800/TESS return prediction).

The goal for having several observers at a range of longitudes observe during Nights 1 and 2 was to try to detect an ingress or egress change in brightness, but the timing of the 1 % fade (and possible transit) have denied us observing coverage during those crucial times. The only chance of using brightness levels to detect the dip was for those of Harris and Gary, since the inter-calibration for these two observers is well-established. We are therefore free to adopt offsets for the other observers that provide a match to Harris and Gary data. In the following graph the data for Benni and Gregorio have been adjusted using offsets that provide agreement with the Harris and Gary observations (the data for Harris and Gary have not been adjusted using offsets). The transit model has been adjusted in two ways: 1) depth was reduced to 1 % (from the TESS value of 1.4 % in 2019), and 2) a time shift of -0.5 day (i.e., earlier) was applied.  Note: The Benni data for both dates was made with a V filter and the same reference stars. An offset was applied to the Benni data that provided a match to the Gary data of Night 3. The fact that the Benni data for Night 1 agrees with the Harris data is reassuring.  


Figure 0.1a. Comparison of 6 data sets for a 4-day interval using offsets for the Benni and Gregorio data that produce agreement with Gary data. The dip model is from a fit for TESS data (2019 Sep 03), shifted to an earlier time by 0.5 day and with a depth reduced from 1.4 % to 1.0 %. (Transit was predicted for 9506.3, or ~ 0.5 days later than shown, but our period of 776.14 days could have been uncertain by this amount.)

I conclude from this comparison of different data sets and the TESS dip model that our data is compatible with the Rafik prediction of P ~ 776 days; however the data do not provide sufficient support for Rafik's prediction that would allow us to claim that we have observational evidence confirming the 776-day periodicity. This lack of support is due to the observing gaps between Nights 0 and 1, and between Nights 1 and 2, where ingress and egress brightness changes may have occurred. Since we were unable to detect the ingress and egress features required by TESS data it is possible that the Oct 18 dip was just another 1 % dip (that have occurred frequently during this observing season). But if this is a repeat of the D800, D1570 and TESS dips, then dip depth is now lower than when TESS observed (i.e., 1.0 % now vs. 1.4 % in 2019, which was actually expected from a trend that was noted and described below, at link).
     ________________________________________________________________________________________________________________________________

This observing season continues a trend of more frequent dips of lower depth than the year before. When Kepler was observing (8 to 12 years ago) dips were rare, but when they occurred they were usually deep. When ground-based measurements first showed dip activity (2017 May), the dips were 1.5 to 3 %, and this was exciting. Every observing season since then as seen lower depth dips, and more of them. During the present observing season we have the most dips per month ever, and they're less deep than ever (~0.5 to 1.0 %). This pattern can be understood as a natural consequence of dips being produced by dust clouds resulting from a cascade of collisions that started with one big collision 10 years ago (in 2011). This "collision cascade model" predicts the following 3 patterns for dips on successive orbits (imagine orbit P = 776 days): 1)
a group of dips will be spread out over a longer date interval, 2) there will be more dips per month, and 3) dips will be less deep. This pattern can already be seen. I therefore predict that the next several months will be like the last several months: lots of 0.5 to 1.0 % dips and nothing more dramatic. For more on this explanation see link.

Since early 2021 the "long timescale" level has been ~ 1 % below the "complete clearing" level (defined as no debris of any timescale). 
The only "complete clearing" occurred in late 2019.

This observing season will provide a test of two lperiodicity predictions made a few years ago: 1601 days by Rafik Bourne and 1574 days by Gary Sacco. The following table may be useful in evaluating whether either of these two periodicities have support by this year's observations:

Table 1. Predictions for 2021 Observing Season Based on Competing Periodicities (1574 vs 1601 days)
Kepler
Name

Depth
JD4
2 x 1574
2x1601
Date
Date
D800
16 %
5626
8774
8828
2019 Oct 18
2019 Dec 11
D1520
21 %
6353
9501
9555
2021 Oct 14
2021 Dec 07
D1540
3 %
6373
9521
9575
2021 Nov 03
2021 Dec 27
D1570
8 %
6401
9549
9603
2021 Dec 01
2022 Jan 24

In an article submitted to MNRAS on 2017 Nov by Bourne, Gary and Plakhov (link) we made the following predictions:


Prediction 1 is partially confirmed. An abrupt 2 % rise in brightness began 4 months after this window of dates (on 2018 Apr 7). Prediction 2 will be evaluated later this year. Prediction 3 is a failure (a U-shaped fade of ~ 3 %, lasting up to 2 years, did not commence this year). Prediction 4 will be evaluated later this year. By the way, in this article we neglected to predict a fade corresponding to the return of the Kepler D800 dip (listed in above table as JD4 = 8828); there was indeed a significant dip centered on this date (as shown in Fig 1c, below). The reduction of D800 depth and increase in duration could be easily explained using an orbit shear argument (see Fig. 6.11 in "Speculations about physical model", at link below, for description).

Recently, Rafik Bourne has noticed very interesting coincidences that involve a periodicity of 776.14 days. The first deep Kepler dip, referred to as D800 (JD4 = 1527), and the last deep Kepler dip, referred to as D1570 (JD4 = 6402) and a TESS dip at JD4 = 8730, are all separated by multiples of 776.14 days. In addition, their depths form a pattern of decreasing by half every 776-day hypothetical orbit.  In addition, according to Rafik, each transit can be modeled by a transit velocity of ~ 26 km/s and a similar impact parameter (that specifies star latitude for transit crossing path). A 776 day orbit corresponds to a orbit with radius ~ 1.9 AU (if circular), where orbit velocity ~ 26 km/s. A final coincidence is that all three transits can be explained by similar geometries - a circular object with size slightly larger than Neptune (implying mass ~ 0.7 times Jupiter) that have dust disks that decrease
versus time in physical extent and density. These matters are discussed below, at link. Based on this 776-day pattern Rafik is predicting a return dip on JD4 = 9506.30 (2021 Oct 18.80). This prediction is summarized in the following table: 
 
Table 2. Prediction for Return of Kepler D800 Dip During 2021 Observing Season Based on Periodicity of 776.14 Days

5th orbit return of D800
Predicted Depth
Ingress
JD4 = 9505.90, 2021 Oct 18, 10 UT
Mid-transit
 JD4 = 9506.30, 2021 Oct 18, 19 UT
~ 1.2 %
Egress
JD4 = 9506.70, 2021 Oct 19, 05 UT


Prediction for 2021 Oct 18/19 dip, a return of the Kepler D800 dip after 5 orbits (with P = 776.14 days).

"Tabby's Star" continues to puzzle everyone!
We don't even know what's creating the dust clouds that produce brightness variations. The best guess is collision cascades model, but we really don't even know that for sure. We'll be handicapped in understanding this star system until a periodicity is established. About the only thing we can be sure of is that variability exists on a range of timescales. There are slow changes, with timescales of many months to many years, and faster changes, with timescales of less than a day to several days (referred to as "dips"). The dips have smaller depths at longer wavelengths, and this is surely evidence for the presence of a small size component of dust (< 0.5 micron radius).  This is still true for the 2021 observing season dips. We have some evidence for the long timescale variations to exhibit the same wavelength dependence. This is just a tentative result because we haven't yet established the "complete clearing" level. I continually hope to observe such a clearing again, to verify the earlier tentative result for a "complete clearing" level in late 2019.
_____________________________________________________________________________________________________________________________________ 

Links on this web page

    Basic info for KIC846  
    Long timescale variations (based on AAVSO and other sources)
    g', r' & i' magnitudes vs. date
  
  List of observing sessions (for the 2021 observing season)
    Finder image (showing my ref stars) 
    Miscellaneous LC presentations .
    Data exchange files for download   
    My collaboration policy
    Speculations about physical model ..  
    References    

Links on other web pages
 

    HAO precision explained (580 ppm) 
    DASCH comment  

    This is the 11th web page devoted to my observations of Tabby's Star for the date interval 2021.04.25 to 2021.10.22.
  The next set of observations
, starting with 2021.10.29, are at http://www.brucegary.net/ts12/.

  Go back to 10th of 11 web pages  (for dates 2020.09.27 to 2020.12.20) 
  Go back to  9th of 10 web pages  (for dates 2019.01.20 to 2020.01.11) 
  Go back to  8th of 10 web pages  (for dates 2018.10.10 to 2019.01.19)
  Go back to  7th of 10 web pages  (for dates 2018.08.12 to 2018.10.04)
  Go back to  6th of 10 web pages  (for dates 2018.02.25 to 2018.08.01)
  Go back to  5th of 10 web pages  (for dates 2017.11.13 to 2018.01.03)

  Go back to  4th of 10 web pages  (for dates 2017.09.21 to 2017.11.13)
  Go back to  3rd of 10 web pages  (for dates 2017.08.29 to 2017.09.18)
  Go back to  2nd of 10 web pages  (for dates 2017.06.18 to 2017.08.28)
  Go back to  1st of 10 web pages  (for dates 2014.05.02 to 2017.06.17)

    Reference Star Quality Assessment  (the 10 best stars out of 25 evaluated)  

Basic Info for KIC846

RA/DE = 20:06:15.44 +44:27:24.9
V-mag = 11.85, g'-mag =12.046, B-V = +0.51 (APASS)
Spectral type: F3V
T_eff = 6750 K
R = 1.58 R_sun (1.10e+6 km)
M = 1.43 M_sun (2.84e+30 Kg)
Observing season centered on Jul 24

Long Timescale Variations


Figure 1a. 4-month LC for V and g' measurements.


Figure 1b.
A 1-year LC of ground-based observations that are in the "public domain" (and are good quality), normalized to the V magnitude scale of observer HBB.


Figure 1c.
A 2-year LC of ground-based observations that are in the "public domain" (such as from AASVO), normalized to the V magnitude scale of observer HBB.


Figure 1d. A 5-year light curve for V- and g'-band measurements (including magnitude offsets to achieve internal consistency).
.

Figure 1e.
15 years of space-based and ground-based observations that are in the "public domain" (such as from AASVO), normalized to the V magnitude scale of observer HBB. (The Kepler data are from Montet and Simon, 2016, which omits dips). 

The next paragraphs are a highly speculative attempt to explain the above brightness variations.

Imagine that Tabby's Star is orbited by a Jupiter-class planet that has recently been perturbed into an eccentric orbit that brought its periapsis into the region of an asteroid belt. Occasional asteroid/planet collisions produce a ring of debris centered on the planet orbit. Due to Keplerian orbit shear the debris is approximately uniform along the entire planet orbit. Imagine that the planet orbit, and its debris belt, has a period of > 15 years. This debris ring produces long timescale brightness variations (e.g., months to years).

Now imagine that because this Jupiter-class planet enters the asteroid belt during its periapsis some asteroid orbits are perturbed, producing occasional asteroid/asteroid collisions. The debris produced by these collisions will orbit with a period similar to those of the asteroids (e.g., ~ 2 years). Due to radiation pressure from the star these dust clouds won't last long. Because of their shorter lifetimes (e.g., years) they won't have accumulated much Keplerian orbit shear, so during their lifetime they will be small clumps of dust. They orbit faster than the planet, and due to this, plus their smaller size, they transit the star on short timescales (e.g., a day to a week).

Both components of fading will be superimposed upon each other. On rare occasions the outer belt of dust that produces long timescale fades will have clearings, allowing us to determine the true brightness of
Tabby's Star. I think this happened in late 2019. This unobstructed view corresponds to a brightness level shown in the my graphs by the green dotted line labeled "OOT (no debris)." 


Figure 1f. Illustration of two components of fading: outer orbit belt (long timescale) and inner orbit dips (short timescale).

 
HAO g', r' and i' Mag's vs. Date


The last two r'-band measurements are solid. I don't understand why they appears to be low.


Figure 2a. A 4-month LC of HAO g' and r' magnitudes. The dotted traces are an attempt to represent the component of slow variations (timescale of months). The fast variations, or dip structure, is superimposed upon the slow variations.   


Figure 2b
HAO g', r' and i'-magnitudes for the past 12 months. The horizontal dashed lines are suggestions for OOT levels, set to the brightest magnitudes observed during the past 3 years (when I began observing in three bands).


Figure 2c. HAO g', r' and i'-magnitudes for the past two years. The r' and i' model traces are departures from the respective OOT levels multiplied by the g'-mag departures from the g' OOT level. The multipliers for r' band and i' band are 0.60  and 0.35. In other words, the r' and i' fade amounts are 60 and 35 % of the g' fade amounts. The slow variations are more noticeable in this graph.

The overall conclusion from these observations is that both the short-timescale dipping and long-timescale variations are caused by dust clouds dominated by small particles!

List of Observations (for all earlier observations, before 2021 May, go to link)

2021.10.22  
2021.10.21  
2021.10.20  
2021.10.19  
2021.10.18  
2021.10.17  
2021.10.16  
2021.10.15  
2021.10.14  
2021.10.13  
2021.10.11  
2021.10.10  
2021.10.09  
2021.10.08  
2021.10.07  
2021.10.06  
2021.10.04  
2021.10.03  
2021.10.02  
2021.09.30  
2021.09.29  
2021.09.27  
2021.09.22  
2021.09.21  
2021.09.20  
2021.09.19  
2021.09.18  
2021.09.16  
2021.09.15  
2021.09.14  
2021.09.13  
2021.09.11  
2021.09.10  
2021.09.09  
2021.09.08  
2021.09.07  
2021.09.05  
2021.08.26  
2021.08.23  
2021.08.22  
2021.08.21  
2021.08.20  
2021.08.05  
2021.08.04  
2021.07.26  
2021.07.22  
2021.07.09  
2021.06.27  
2021.06.26  
2021.06.25  
2021.06.22  
2021.06.18  
2021.06.16  
2021.06.13  
2021.06.12  
2021.06.11  
2021.06.09  
2021.05.17  
2021.05.12  
2021.05.09  
2021.05.08  
2021.05.06  
2021.05.05  
2021.05.04  
2021.04.28  
2021.04.25     
 

Daily Observing Session Information (most recent at top)


2021.10.22  


2021.10.21  


2021.10.20  


2021.10.19  


2021.10.18  

There is no data from HAO due to clouds. For this date I'll post other observer's LCs.


2021.10.17  


2021.10.16  


2021.10.15  


2021.10.14  


2021.10.13  


2021.10.11  


2021.10.10  


2021.10.09  


2021.10.08  


2021.10.07  


2021.10.06  


2021.10.04  


2021.10.03  


2021.10.02  


2021.09.30  

Lots of clouds, but KIC846 is amazingly stable.


2021.09.29  


2021.09.27  


2021.09.22  


2021.09.21  

I don't know if I believe the brightening in the middle of this observing session. I've checked the reduction procedure in various ways and can't find any faults with my analysis. The brightening is greatest at the shortest wavelength and smallest at the longest wavelength. This pattern is consistent with a "forward scattering" explanation by an optically thin dust cloud of small particles koving fasts just beyond the star's limb.  


2021.09.20  


2021.09.19  


2021.09.18  


2021.09.16  


2021.09.15  


2021.09.14  


2021.09.13  


2021.09.11  


2021.09.10  


2021.09.09  


2021.09.08  

Cloudy! Lightning & thunder nearby.


2021.09.07  


2021.09.05  


2021.08.26  


2021.08.23  


2021.08.22  


2021.08.21  

Again, this looks like a brightening during the observing session. I don't know whether or not to believe it.


2021.08.20  

It looks like there was s change in brightness during the 4.4 hours of this observing session. We need another observer to verify such things.


2021.08.05  


2021.08.04  


2021.07.26  


2021.07.22  


2021.07.09  


2021.06.27  


2021.06.26  


2021.06.25  


2021.06.22  


2021.06.18  


2021.06.16  


2021.06.13  


2021.06.12  


2021.06.11  


2021.06.09  


2021.05.17  


2021.05.12  


2021.05.09  


2021.05.08  


2021.05.06  


2021.05.05  


2021.05.04  


2021.04.28  


2021.04.25   


Finder Image


Figure 5.1. Finder image showing the 17 reference stars that I use. KIC846 is in the blue square. FOV = 15.6 x 10.5 'arc, NE at upper-left.


Miscellaneous Light Curve Presentations

What is the overall character of KIC846 brightness variations?

I like to distinguish between short-term and long-term variations. The short-term variations are referred to as "dips." The dips last a few days typically. By long-term I refer to whatever is left over after removing the dip data. The long-term data can have variations with timescales of months to years. The next two graph covers a 15 year interval and includes both Kepler and ground-based data, and it shows long-term variations (tan trace). 


Here's another version for the first 14 years of observations.


Figure 6.1. 14 years of Kepler and ground-based measurements. The black dots are Kepler data with dips removed; these data show the long-term variation during the 4 years of Kepler observations. Starting in 2017 (with only ground-based data) the dip and long-term data are shown with different symbols. None of Tabby's LCO data are shown (because a digital version of this data is not in the public domain) and none of the AAVSO data are shown (because most of it is noisy and adding the less noisy data would make the plot too "busy").  


Figure 6.2. Ground-based HAO g' measurements during the past 3 years (plus TESS).


Figure 6.3. Ground-based HAO g', r' & i' measurements during 2018/19 observing season.

Now let's return to the Kepler data that has long-term variations removed, allowing us to see just the short-term ("dip") activity.


Figure 6.5a. Kepler short-term version of data for the entire 4-year of Kepler observations.


Figure 6.5b. Same Kepler data but with an expanded normalized flux scale.

Figure 6.5c. Last 3 months of Kepler data showing the one set of dips with a complex and sometimes deep dipping structure.

As an aside, allow me to show what TESS observed recently:

Let's do the same removal of long-term variations for recent ground-based data.


Figure 6.7. Ground-based (HAO) data, plus TESS data, with long-term variations removed (showing only dip activity) for the 3 years preceding this observing season.

Here's an expanded version of the TESS data in the above plot.


Figure 6.8. TESS measurements of two short-timescale dips.


Figure 6.9. Ground-based (HAO) data with long-term variations removed (showing only dip activity) for the last 2 months of last year's observing season.

Other ground-based data exists but some of it is not in the public domain in digital form (LCO data) and I apologize to the AAVSO observers with data that is not included above. I'll try to add some AAVSO data if I get time for processing and selecting it.

Note, as Rafik Bourne pointed-out to me, TESS is sensitive to just long wavelengths (Rc/Ic/z') which does not include g'-band, and since dip depth is consistently less at longer wavelengths TESS dip depths will always be less than g'-band depths. For example, in the above figure the TESS dip showing depth = 1.2 % would probably have been observed with a g' filter to have a depth of 2.0 or 2.5 %.

We can now ask the question: Are the long-term and short-term (dip) activities for the past 3 years similar or different from what Kepler observed during 4 years?

Long-term Variation Differences

Referring back to an earlier figure, repeated here, the long term variation during the past 3 years has been considerably greater than during Kepler's 4 years of measurements.


Repeat of Figure 6.1. The Kepler data with dip activity removed (black dots) exhibit just one large change (2.2 %) following a slow fade (1 %). The ground-based data, starting in 2017, exhibit several changes, or variations, each about 1 % but adding up to ~ 3.5 % during 3 years.     
...


Short-Term (Dip Activity) Pattern

There are significant differences between the Kepler 4-year record of dip activity and the 5-year record of ground-based dip activity. Consider the following figure showing the "short-term only" data (e.g., dip data, with long timescale variations removed):
 

Figure 6.10. Comparing dip activity of Kepler and ground-based (HAO) data (i.e., with long-term variations removed). The times for 776.14-day orbits are shown by the numbers 0 to 5. A "parent" collision is suggested to have occurred shortly before the "0" date (i.e., before the Kepler D800 dip, at JD4 = 5627). 

It is apparent in this comparison plot of dip activity that the past 5 years have exhibited more short-term ("dip") activity than a comparable interval of Kepler data. Another difference is that during the Kepler dates when dips were present they could be much deeper! One more pattern: dip groups evolved from one isolated deep dip to a group of dips (with lower depths) that are spread out over time by a longer interval each orbit. This suggests to me that shortly before Kepler's big single dip (labeled "0" above) KIC846 underwent an event that produced a few dense dust clouds that were initially close together and overlapped to give the appearance of one deep dip. However, the fragments producing this one big dust cloud had slightly different periods, and as the "Keplerian orbit azimuth shear" caused fragments to become separated along their orbit. This meant that on subsequent orbits the dust clouds that they produced had lower optical depth when they transited their star, and the date range for these transits was longer. By now, 5 orbits after the parent collision, we observe more dips than ever and they have even lower depths. This pattern can be understood using a "collision cascade model," described next.

Physical Model Speculation ("Collision Cascade Model")

Imagine KIC846 to be a solar system that started out similar to ours. It had a belt of asteroids at 2.0 to 3.3 AU and major planets farther out. The asteroids would have periods of  3 to 6 years. There's one obvious difference, however: KIC846 is a binary; the companion star is much fainter (red dwarf) and at this time it is 2 "arc away (900 AU, projected). The red dwarf companion has an orbital period estimated to be ~ 19,000 years (Pearce et al., 2021,
arXiv: 2101.06313). Could this difference be a clue to what has made KIC846 different from our solar system?

An important fraction of exoplanetary systems show evidence for having been disturbed by orbit migration. The most cited mechanism is Kozai-Lidov. According to this "high eccentricity migration" scenario, or HEM, a massive outer planet causes an inner planet's inclination to change in a way that increases eccentricity (involving an exchange of momentum). This might be one of the explanations for the presence of so many "hot Jupiter" exoplanets. It is also a suggested mechanism for bringing asteroids and planets into close-in orbits to white dwarfs (~ 1/3 of WDs have close-in asteroids or planets). If the KIC846 red dwarf companion is in an elliptical orbit it may provide a source for HEM. Imagine, now that a Jupiter size planet was in an orbit that became elliptical enough for its periapsis to come close to the belt of asteroids. What might such an event lead to?

If this happened the orbits of the asteroids would be disrupted, and asteroid/asteroid collisions would become common. There might also be frequent asteroid/planet collisions.

The asteroid/asteroid collisions would produce fragments (that are the source for dust clouds) with orbital periods similar to the asteroid periods, i.e., ~ 3 to 6 years (1000 to 2000 days). The asteroid/planet collisions would have periods close to the planet's period - which could be 10 to 20 years. "Keplerian orbit azimuth shear" (also referred to as "orbit shear" or "azimuth shear" or "Keplerian shear") would cause the dust clouds to eventually spread out along the orbit. If the dust is long-lasting it would produce a "dust belt." The planet in an eccentric orbit may orbit within its own "dust belt" - which we observe as long-term variations as the dust clouds in the dust belt orbit through our line-of-sight to the star.

The asteroid/asteroid collisions will produce dust clouds that are subject to stronger radiation pressure because of their closer proximity to the star. Their structure may change on a timescale of their orbit, causing dips a few years apart to change shape and depth. The best example of this may be the Kepler D800 dip. Here is a comparison of the first Kepler dip (the first one deeper than 0.5 %) in 2011 and the deepest dip structure from ground-based observations in 2019 (3200 days later).


Figure 6.11. Comparing
ground-based measurements in 2019 with Kepler's D800 event shifted 3200 days (2 orbits of 1600 days according to one speculation). 

If the Kepler D800 event is due to a dust cloud that orbits in 1600 days then during two orbits (3200 days, or 8.8 years) the dust cloud has spread out along the orbit considerably. This can account for the reduced depth. Presumably, the Kepler observation occurred shortly after the collision that produced the D800 cloud (before significant orbit shear occurred). This scenario assumes that these two dip structures are produced by fragments with P = 1600 days. I am now not convinced that about this P value, so hte message of the above figure would be simply that whatever the period we observe dip structure to be evolving from a single, deep dip to a multitude of smaller dips spread out in time.

Here's an example of dip structure seen one orbit apart (assuming P = 1601 days), described in Bourne, Gary and Plakhov (2018).


Figure 6.12. Kepler event D1540 shifted 1601 days showing essentially identical structure when compared with ground-based data.

For the case of D1540, compared with one orbit later, there is no change in dip structure. This can be explained if the model for D1540 described in Bourne, Gary and Plakhov (2018) is correct, namely, that D1540 is caused by a brown dwarf with rings. This figure was the original motivation (in 2017) for suggesting that KIC846 dips exhibited a 1600 day periodicity. Since then a new periodicity has been suggested (by Rafik Bourne): P = 776.14 days. The reasons for this period will be explained below - after a short tutorial on collisions.

All dips except this one, D1540 and its repeats, are probably produced by dust clouds that result from asteroid/asteroid collisions. Collision models for white dwarfs that exhibit dip-style fading are gaining favor over those based on sublimation or thermal winds. Tidal disruption must play a role in releasing fragments from asteroids for some white dwarfs (e.g., WD 1145+017), but even for these cases collisions must be invoked to produce the dust clouds. Why? Because dust ejection velocities of ~ 1 km/s are required in order to account for observed dip depths (65 % for WD1145) and only collisions can achieve such velocities. Dip depth can be used to derive minimum ejection velocity when orbit period is known. As a bonus, when ejection velocity is derived from dip depth it is possible to predict azimuth shear. Since this will be important for KIC846 I want to treat enough of the collision modeling to illustrate this for KIC846.

The most important thing to learn about collision models (which not many astronomers understand, apparently) is that after a collision the dust particles and larger fragments are in their own orbits! Each particle's orbit has an inclination and eccentricity and period slightly different from the parent body. This means that during each orbit every ejected particle moves away from the original orbit plane for 1/4 orbit, then returns during the next 1/4 orbit, followed by a movement away from the orbit plane in the opposite direction for another 1/4 orbit, and finally returns to the orbit plane as a full orbit is completed. Considering that many particles are ejected upward and downward with different vertical components of velocity, we can see that the dust cloud expands vertically and contracts twice each orbit. This is shown in the next figure (using a hypothetical collision in Earth orbit for illustration).


Figure 6.13.
Path over Earth of many particles from one collision.

Ejection velocities following a collision will also have components within the orbit plane, either moving inward or outward (i.e., a radial component). This causes the dust cloud to expand toward or away from the central gravity source in the same expanding and contracting pattern shown in the previous figure. Finally, ejection velocities will have components along the orbit direction, either forward or backward. Again, there will be two expansions and contractions per orbit. In other words, the dust cloud will expand and contract in all directions twice per orbit.

After one orbit all particles will return to their original location - but some will arrive earlier than others, and some will arrive later. The early and late particles are the ones that had ejection velocity components backward and forward parallel to the orbit, respectfully. A snapshot of particle locations after exactly one orbit (for the average of particles) will show an oval pattern that is elongated along the orbit. This is the explanation for "orbit shear" (also referred to as "Keplerian shear" or "azimuthal shear").

The amount of elongation is proportional to ejection velocity. Since ejection velocities will vary (e.g., Maxwell-Boltzmann speed distribution) the dust cloud will have isopleth surfaces of particle density that are elongated (cloud center will be denser because more particles were ejected with slower velocities). My modeling for WD1145 shows that simple collision model assumptions are capable of reproducing the shape of typical dips, shown in the next figure.


Figure 6.14. A collision model predicts dip shapes that agree with essentially all observed dip shapes
for WD1145 (AHS = asymmetric hyper-secant).

If the collision model is correct then we can use it to determine ejection velocity based on dip depth. To illustrate this suppose the collision occurs 1/4 orbit before transit. As the cloud orbits to our line-of-sight to the star position it will attain its largest vertical extent (as illustrated in Fig. 6.13). Assuming our view is edge-on (impact parameter = zero), when the cloud is in front of the star it will extend to the same northern and southern hemisphere latitudes. If this latitude is 30 degrees, ~ 1/2 of the star's disk area will be obscured. If the cloud is opaque it will produce an approximate 50 % dip depth. Since we're interested in understanding the D800 event, where depth = 16 %, the star must be obstructed from -9.3 degrees latitude to +9.3 degrees. If KIC846a (the star) has a radius of  1.58 R_sun, or 1.1e+6 km, the 9.3 degree location is 1.62e+5 km away from the center. An ejection velocity of 8 m/s will achieve this range of vertical expansion during 1/4 orbit. This is a modest speed for collisions, which can produce 1 km/s speeds; it is even smaller than comet sublimation-driven ejection speeds (which in our solar system are 50 to 100 m/s). It is even modest compared to thermal wind speeds. The problem with the comet sublimation jet model and thermal wind model is the requirement for large ejection mass rates (I think).

If the dust cloud wasn't opaque when Kepler observed the D800 16 % dip, we would require a bigger cloud to achieve the observed depth. For example, if the vertical component of ejection velocity was 50 m/s the entire star disk would be obscured, and we would require that the optical depth be only ~ 16 % to account for the 16 % depth. In fact, we should consider that all KIC8446 dust clouds are considerably larger than required to cover the star's disk. Otherwise, we would be forced to accept the coincidence that KIC846's inclination was fortuitously close to 90 degrees.

Let's define the collision site's location using phase, ranging form 0 to 1, where phase = 0 corresponds to a passing in front of the star by the orbiting asteroid (that undergoes a collision with a smaller asteroid). We should keep in mind that the collision sites are unlikely to be close to phase -1/4 or +1/4 (producing dust clouds that are at their maximum size when they transit). Referring back to Fig. 6.13 we can see that collision sites close to 0 and 1/2 will produce dust clouds so small when they transit that they won't produce observable dips. Let's consider a more typical site location for our calculations to be phases = +/- 1/8 and +/- 3/8, where dust cloud sizes are ~ 70 % of their maximum size during transit. Therefore, dust cloud ejection velocities of 20 to 200 m/s should be thought of as typical for KIC846.

Can we estimate maximum ejection velocity from an observation of how much a dust cloud has spread out along its orbit between two observations of it? Yes! The amount of spread is proportional to v/V, where v = maximum ejection velocity and V = orbital velocity. It's also proportional to the time interval between observations. It can be shown that when v << V, a 1 % change in orbit velocity produces a 3 % change in cloud width, w, where w has units of an orbit. For example, for KIC846 (with M = 1.48 M_sun), an object in a circular orbit with P = 1600 days has orbit velocity V = 20.5 km/s, so if particles are ejected in the forward direction with v = 205 [m/s] (1 % of orbital velocity) after one orbit the particles ejected forward and backward along the orbit will return to the ejection site 3 % of an orbit (48 days) later and earlier, respectively. An easy way to convert a dip's total width change per orbit, W, is given by the following:

    v [km/s] = 2.1 × W [days/orbit],

where v = ejection velocity in all directions and W = rate of change of a dip's total width. This assumes an orbital period of 1600 days.

The D800 event (see Fig. 6.11) shows a width of 55 days observed in 2019 compared to ~ 5 days as measured by Kepler 2 orbits earlier. This corresponds to a spreading rate of 25 days per orbit, and this could be produced by orbit shear of particles ejected isotropically with velocity = 52 m/s.

This ejection velocity is typical for solar system comets. Collisions aren't needed. In fact, collisions might be ruled-out by such a low ejection velocity.


A possible explanation for this dip activity pattern (in Fig. 6.11) is that the Kepler observations were closer in time to an event that created a well-defined cluster of dust-producing fragments within an orbit, and during the course of the last 11 years, at least, the fragments have dispersed along the orbit owing to their orbital periods not being exactly the same. The total amount of light blocking dust may have not changed much, but since fragment-based dust clouds spread apart over time they produce more dips with lower depth. 


I want to call attention to three possibly distinct variation timescales: 1) long timescale variation, lasting many months to a few years, 2) medium timescale, lasting one or two weeks, and 3) short timescale, also called "dips," lasting from 1/2 day to 2 or 3 days. The following figures show examples of these three variations.


Figure 7.1. Slow variation example.


Figure 7.2.
Medium timescale variation, lasting 9 days.

Finally, the brief dip in the above figure at JD4 = 9148 is an example of a short timescale variation, or "dip." We don't know how long it lasted due to a lack of observations (though it must be less than 2 days). However, the next figure is a better illustration of a dip having a similar length and depth (occurring 418 days earlier).

..


Figure 7.3. Detail of short timescale variation, also called a "dip," measured by TESS on 2019 Sep 03. Mid-transit was at JD4 = 8730.16 and it lasted 0.81 day (19.4 hours).

Rafik Bourne has "solved" this transit and has produced the following animation: link


Figure 7.4. A frame from Rafik Bourne's animation of a solution for the TESS transit shown in the previous figure.

Rafik found that the transiting object has a radius of 125,000 km (i.e., 1.8 x R_jup) and is moving at a speed of 25.6 km/s. An object this size could be a high mass Neptune (or low mass Jupiter). Objects this size have a mass of ~ 0.7 x M_jup. If it's in a circular orbit the period would be ~ 800 days and the orbit radius would be ~ 1.9 AU. I will eventually have more material to present here that summarizes discussion that Rafik and I have been having about a 776.1-day periodicity that Rafik has suggested and a way to view the pattern of KIC846 dips during the past 15 years.

But for now...

We should keep in mind that KIC846 dips can be shorter than ground-based sampling times. The TESS dip just described lasted a mere 18 hours. The Kepler D800 dip, with depth 16 % (shown in the next figure), had an even shorter half-width (10 hours). A ground-based observer with data every night might measure a depth of merely 4 %.


Figure 7.5. Detail of the Kepler D800 dip.

If the D800 dip was produced by an optically thick dust cloud emanating from a planet, such as the massive Neptune planet that was modeled by Rafik for explaining the TESS dip, we wouldn't know about this planet from just the D800 dip. In fact, let's imagine that the Kepler D800 dip was produced by such a dust cloud. The 1 % depth lasting 18 hours (corresponding to a planet without a dust disk) would be a minimum fade shape. However, superimposed on that dip would be the broader and deeper structure produced by the dust cloud seen in the above figure. Notice that ingress lasts ~ 4.5 days (using 0.5 % depth for this measure) whereas egress lasts ~ 2.0 days. The breadth of the dust cloud is 6.5 days. Assuming a speed of 25.6 km/s, the breadth is ~ 14.4e+6 km, or 0.10 AU (assuming, again, the orbit that Rafik derived for the TESS dip).

Rafik has since achieved a transit geometry solution for the D800 dip (JD4 = 5626). It requires a transit velocity very similar to the TESS dip solution. The best object geometry is a circular central object with a disk, tilted in a way that causes a longer ingress than egress. Rafik has also modeled the D1570 dip (JD4 = 6402), and the solution for this dip is almost identical to that for D800. Notice that delta-date for D800 and D1570 = 776 days. This means we can speculate that the TESS dip is produced by the same object that produced the D800 and D1570 dips (note: the TESS dip occurs exactly 4 x 776.14 days after the D800 dip). Consider the following ephemeris:

     JD4 = 5625.74 + N
× 776.14

Using this ephemeris we can associate D800 with N = 0, D1570 with N = 1 and the TESS dip with D = 4. What's even more remarkable is the sequence of dip depths with N. Each occurrence has a depth that is 1/2 of the previous dip's depth (e.g., 16 %, 8 %, ?, ?, 1 %). These remarkable patterns are summarized in the following table.  

 Table 3. Events Associated with Ephemeris JD4 = 5625.74 + N × 776.14
 N
JD4
Depth
What's There?
0
5626
16 %
 Kepler D800, v = 26 km/s, object with disk, impact parameter ~ 1.0
1
6402
8 %
 Kepler D1570, v = 26 km/s, object with disk, impact parameter ~ 0.9 
2
7178
? %
 No observations
3
7954
? %
 Middle of group of 5 dips, several 2 % deep (1st group of ground-based dips)
4
8730
1 %
 TESS dip, v ~ 26 km/s, circular object w/o disk, impact parameter ~ 0.7
5 9506

 2021 Oct 18. Will we see another dip like TESS (depth ~ 1.2 % & length = 19 hrs)?

It should not be surprising to observe repeat transits exhibiting an exponentially decreasing depth following a collision that produced the first dip. Here are links to Rafik's animations of the N = 0, N = 1 and N = 4 transits: D800 transit, D1570 transit, TESS transit. Here's a representation of the source function for the N = 0 and N = 1 objects:

  
Figure 7.55. Model images of the objects producing the D800 dip (upper) and D1570 (dip lower), produced by Rafik Bourne.

Let's imagine that the D800 dip was produced by a collision that occurred just prior to the D800 date, and the collision was with either the
massive Neptune planet or one of its moons. The fragments ejected from the collision will be in orbits that bring them back to the collision site every orbit. (The new orbits will come close together at the half orbit location, but their locations at this phase will be spread out in the radial direction and the enhanced collision probability will be less dramatic than at the full orbit time, when their locations will be confined to a smaller volume that stretches along the orbit.) We can therefore expect that new collisions might occur once per orbit, and any such collisions would create new and smaller fragments with associated dust clouds. Even in the absence of new collisions every orbit there will be an expansion of the dust cloud created during the original collision and this will produce broader and less deep dips. We can therefore expect the following three things to look for in the light curve for the past 13 years:

    1) the appearance of groups of dips with more components as N increases,
    2) a broadening of the length of time associated with the group of dips as N increases, and
    3) a reduction of dip depth as N increases.

Before we look to see if this pattern exists in the data let's illustrate with a hypothetical set of imaginary observations what we are looking for.

Imagine that a large asteroid collides with an even larger asteroid that's in a 776-day orbit, and that the collision occurs shortly before transit ( < ~ 1/4 orbit before). Imagine further that the collision produces a large dust cloud that is optically thick and has a diameter ~ 40 % the star's diameter by the time transit occurs, which we can set to be JD4 = 5626. This imaginary transit is depicted in the following figure as a N = 0 event.

Since the dust cloud is optically thick we won't notice in the light curve that there are several fragments, each producing their own dust cloud. However, since the fragments are in distinct orbits, with slightly different periods, they arrive back at their collision site at slightly different times, and by the time of their next transit they are spread out in time by 2 or 3 months. During this N = 1 event it may be possible to distinguish 4 or 5 dust cloud transits.


Figure 7.6. Hypothetical light curve for the transit of a large dust cloud produced by a collision shortly before the cloud transits at JD4 5626. The following transit is shown occurring 776 days later, at JD4 6400, at which time there are 5 hypothetical collision fragments each of which is producing a  dust cloud. 

After another orbit the fragments are spread out along the orbit even more (this is referred to in the literature as "Keplerian shear" or "orbit shear" or "azimuth shear"). The individual dust clouds will have a larger size along the orbit due to "orbit shear" so they will have a smaller optical depth and will produce fades that are less deep.

We can now see a pattern during each successive orbit: 1) there will be more dips, 2) dip depths will be smaller, and 3) the group of dips will be spread out in time (group length should be proportional to the time since collision).


Figure 7.7. Same as the previous figure, but showing one more orbit.

A "waterfall plot" can show the expected pattern better.


Figure 7.8. Waterfall plot for the first three orbits of a hypothetical light curve.

This waterfall plot illustrates the expected pattern showing the following trends versus N: 1) increasing number of dips, 2) decreased depth, and 3) longer duration of dip group.

Now, let's see if this pattern exists in the actual observations.Here's what we have so far:


Figure 6.10a repeated. 13-year light curve with slow variations removed, showing only "dip" structure. The number at the top are orbit numbers, assuming P = 776.14 days. (N = -1 occurs before Kepler data began.) Notice the pattern of increasing numbers of dips each orbit, and decreasing depth of these dips each orbit.


Figure 16.10b. Same as above, but expanded date scale showing recent dip levels.

Here's a waterfall plot of the same data (using P = 776 days):


Figure 7.10. Waterfall plot showing measured dip structure, as of 2021 Oct 13. (There's no data for N = 2 so it's missing from this plot).

It would be good if we had near-continuous ground-based observations of KIC846 available in the public domain. For the observations that exist we can see the presence of the expected trends versus orbit number N: 1)
more dips are present, 2) dip depth decreases, and 3) the dip group has a longer length.


Figure 7.11. Region of dips for a specific "Keplerian azimuth spread" (which is determined by maximum ejection speed at time of parent collision - at the vertex).


What about the long timescale variation that was observed by Kepler? As far as we can tell the long timescale fade is centered on the N = 1 dip structure (observed by Kepler). Rafik suggests that since the collision date (e.g., JD4 < ~ 5550) a component of small particles were ejected at high velocity and the formed am "obit shear" length with a radius of 400 days.


The Roche radius for the KIC846 star is located approximately at the star's surface. Therefore, any planet whose eccentricity rises so high that it comes close to the star's Roche radius would either be enveloped by the star or heated to temperatures that would evaporate it (after a few passes). We therefore conclude that tidal disruption of a migrating planet has not played a role in producing dust clouds. Instead, collisions remain the next candidate to consider for producing dust clouds.


We should keep in mind the possibility that the long-term variations in brightness that seem to have increased during the past 11years (cf. Fig. 6.1) could be caused by:1) reflection of starlight when the dust cloud is on the far side of the star, or 2) forward scattering when the dust cloud is on the near side of the star (close to our line-of-sight). With a more spread-out configuration of dust clouds there is less chance of one cloud blocking the reflection, or forward scattering, of another cloud.

Note: these are just speculations by an amateur; actual modeling of these and other ideas are needed by more-qualified people. 


Data Exchange Files

    HAO g' & HAO r' & HAO i' (Bruce Gary,AZ, USA) 
    AAVSO HBB V & HBB B (Barbara Harris, FL, USA)
    AAVSO HJW V & HJW B (John Hall, CO, USA)
    AAVSO DFS V & DFS B (Dufoer Sjoerd, Belgium)
    AAVSO SGEA V & SGEA B (?)
    more to come ...


My Collaboration Policy

At my age of 80 I'm entitled to have fun and avoid work. Photometric observing and figuring things out are fun. Writing papers is work. So if anyone wants to use any of my observations for a publication you're welcome to do so. But please don't invite me for co-authorship!

My light curve observations are "in the public domain." This means anyone can and may download my LC observations, and use (or misuse) any of that data for whatever purpose. If my data is essential to any publication just mention this in the acknowledgement section.
 

References

    Gonzalez, M. J. Martinez and 15 others, 2108, "High-Resolution Spectroscopy of Boyajian's Star During Optical Dimming Events," arXiv:1812.06837
    Wright, Jason T., "A Reassessment of Families of Solutions to the Puzzle of Boyajian's Star," arXiv  (a 1.1-page paper)
    Schaefer, Bradely E., Rory O. Bentley, Tabetha S. Boyajian and 19 others, 2018, "The KIC 8462852 Light Curve From 2015.75 to 2018.18 Shows a Variable Secular Decline," submitted to MNRAS, arXiv 
    Bodman, Eva, Jason Wright, Tabetha Boyajian, Tyler Ellis, 2018, "The Variable Wavelength Dependence of the Dipping event of KIC 8462852," submitted to AJ, arXiv.
    Bodman, Eva, 2018, "The Transiting Dust of Boyajian's Star," AAS presentation, link 
    Yin, Yao and Alejandro Wilcox, 2018, "Multiband Lightcurve of Tabby's Star: Observations & Modeling," AAS presentation, link (navigate down, etc)
    Sacco, Gary, Linh D. Ngo and Julien Modolo, 2018, "A 1574-Day Periodicity of Transits Orbiting KIC 8462552," JAAVSO, #3327, link
    Boyajian, Tabetha S. and 198 others, 2018, "The First Post-Kepler Brightness Dips of KIC 8462852," arXiv 
    Deeg, H. J., R. Alonso, D. Nespral & Tabetha Boyajian, 2018, "Non-grey dimming events of KIC 8462852 from GTC spectrophotometry" arXiv 
    Bourne, R., B. L. Gary and A. Plakhov, 2018, "Recent Photometric Monitoring of KIC 8462852, the Detection of a Potential Repeat of the Kepler Day 1540 Dip and a Plausible Model," MNAS;  arXiv:1711.10612     
    Bourne, Rafik and Bruce Gary, 2017, "KIC 8462852: Potential repeat of the Kepler day 1540 dip in August 2017," submitted to AAS Research Notes, preprint: arXiv:1711.07472
    Xu, S., S. Rappaport, R. van Lieshout & 35 others, 2017, "A dearth of small particles in the transiting material around the white dwarf WD 1145+017," approved for publication by MNRAS link, preprint arXiv: 1711.06960 
    Gary, Bruce and Rafik Bourne, 2017, "KIC 8462852 Brightness Pattern Repeating Every 1600 Days," published by Research Notes of the AAS at link; preprint at arXiv:1711.04205
    Gary, B. L., S. Rappaport, T. G. Kaye, R. Alonso, J.-F. Hambsch, 2017, "WD 1145+017 Photometric Observations During Eight Months of High Activity", MNRAS, 2017, 465, 3267-3280; arXiv
    Neslusan, L. and J. & Budaj, 2016, "Mysterious Eclipses in the Light Curve of KIC8462852: a Possible Explanation, arXiv: 1612.06121v2  (a "tour de force"; I highly recommend this publication)
    Neslusan & Budaj web site with animation of their way of explaining Kepler D1540 dip:  http://www.astro.sk/~budaj/kic8462.html
    Wyatt, W. C., R. van Lieshout, G. M. Kennedy, T. S. Boyajian, 2017, "Modeling the KIC8462852 light curves: compatibility of the dips and secular dimming with an exocomet interpretation," submitted to MNRAS, arXiv  
    Grindlay interview about Schaefer's assertion that KIC846 exhibited a century long fade using DASCH data: link
    Hippke, Michael and Daniel Angerhausen, 2017, "The year-long flux variations in Boyajian's star are asymmetric or aperiodic," submitted to ApJL, arXiv 
    Sacco, G., L. Ngo and J. Modolo, 2017, "A 1574-day Periodicity of Transits Orbiting KIC 8462852," arXiv
    Rappaport, S., B. L. Gary, A. Vanerdurg, S. Xu, D. Pooley and K. Mukai, 2017, "WD 1145+017: Optical Activity During 2016-2017 and Limits on the X-Ray Flux," arXiv, Mon. Not. Royal Astron. Soc.
    Steele, I. A. & 4 others, 2017, "Optical Polarimetry of KIC 8462852 in May-August 2017,"MNRAS (accepted), arXiv.
    Simon, Joshua D., Benjamen J. Shappee and 6 others, "Where is the Flux Going? The Long-Term Photometric Variability of Boyajian's Star," arXiv:1708.07822 
    Meng, Huan Y. A., G. Rieke and 12 others (including Boyajian), "Extinction and the Dimming of KIC 8462852," arXiv: 1708.07556  
    Sucerquita, M., Alvarado-Montes, J.A. and two others, "Anomalous Lightcurves of Young Tilted Exorings," arXiv: 1708.04600   Also: New Scientist link and Universe Today link.
    Rappaport, S., A. Vanderburg and 9 others, "Likely Transiting Exocomets Detected by Kepler," arXiv: 1708.06069 
    Montet, Benjamin T. and Joshua D. Simon, 2016, arXiv 
    Boyajian et al, 2015, MNRAS, "Planet Hunters X. KIC 8462852 - Where's the flux?" link
    Ballesteros, F. J., P. Arnalte-Mur, A. Fernandez-Soto and V. J. Martinez, 2017, "KIC8462852: Will the Trojans Return in 2011?", arXiv
    Washington Post article, 2015.10.15: link
    AAVSO Campaign Notice requesting KIC646 observations
    AAVSO LC Generator https://www.aavso.org/data/lcg (enter KIC 8462852)
    Web page tutorial: Tips for amateurs observating faint asteroids (useful for any photometry observing)
    Book: Exoplanet Observing for Amateurs, Gary (2014): link (useful for any photometry observing) 
    wikipedia description of Tabby's Star  
    My web pages master list, resume


    B L G a r y at u m i c h dot e d u    Hereford Arizona Observatory    resume 
 
This site opened: 
2020.10.05. 
Nothing on this web page is copyrighted.