Bruce Gary, Last updated: 2021.04.28, 18 UT
An abrupt dip
began a couple
days ago, and
appears to have
ended. At g'
band it was ~
1.5 % deep (at
r' band depth
was less, at i'
band depth even
less). This
latest abrupt
dip is
superimposed
upon a shallow
dip (~ 0.5 %)
that began 11
days ago. These
two dips were
embedded within
a 6-month slow
decrease in
brightness. The
slow decrease
fade amount
varies with
wavelength in a
way that is
consistent with
an obscuring
optically thin
dust cloud
dominated by
small particles
(greater fade at
shorter
wavelengths).
This is just
like dip
behavior. So we
now know that
short fade
events, or dips
(lasting a
couple days),
and medium
timescale fades
(lasting a week
or two), and the
long-term
variations
(lasting several
months), can be
explained using
models of
optically thin
dust clouds
dominated by
small particles.
_____________________________________________________________________________________________________________________________________
Links on this web page
g', r' & i' magnitudes vs. date (for last 2 months & last year)
List of observing sessions (starting 2019 Oct 04)
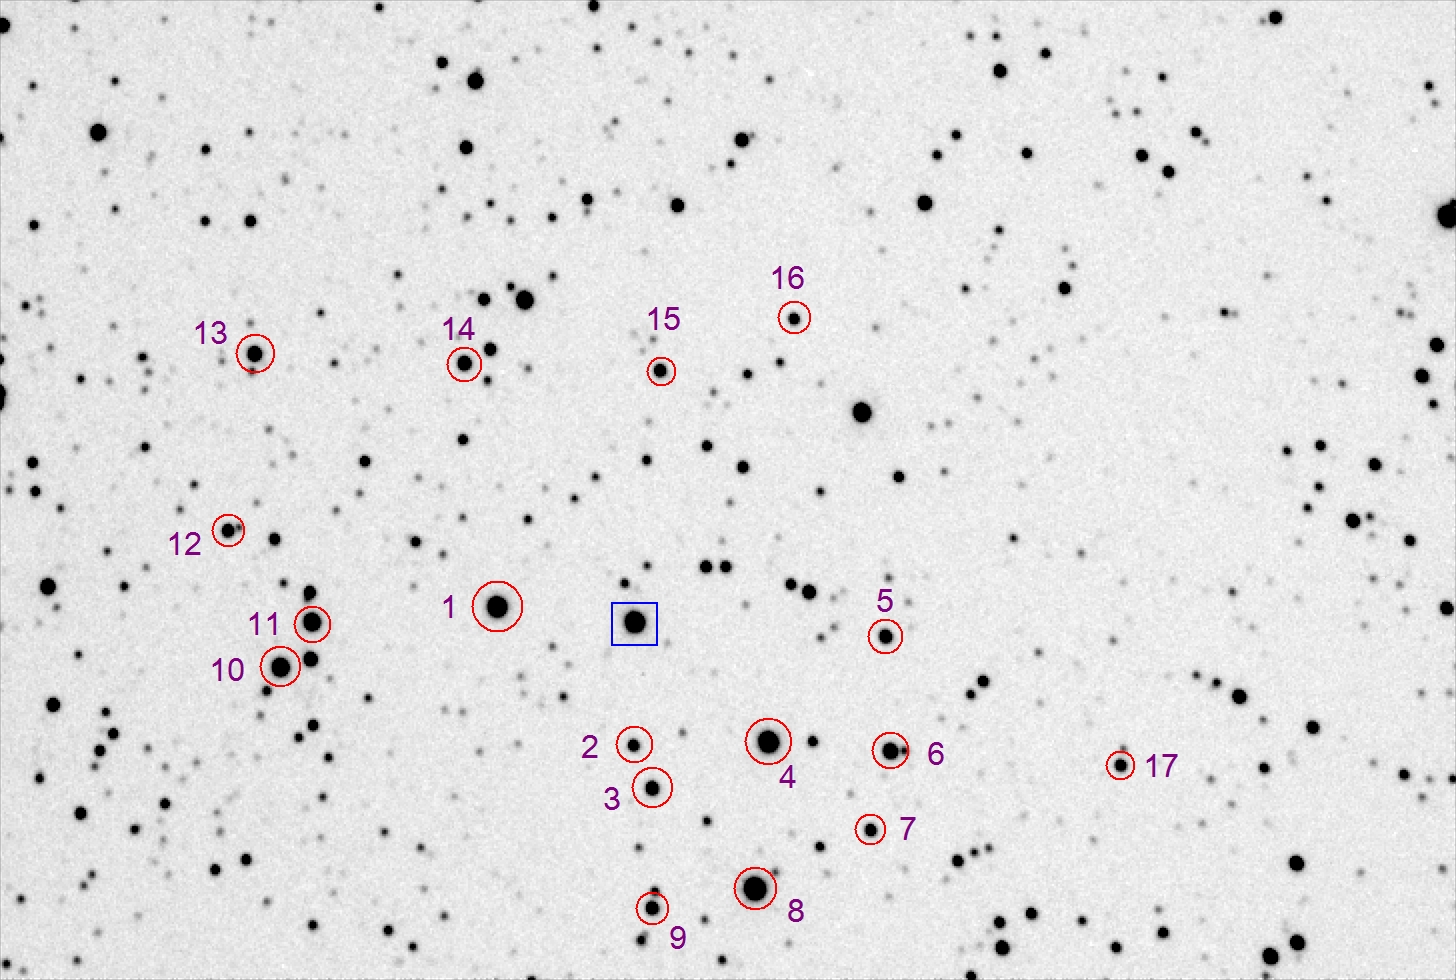
Finder image (showing my ref stars)
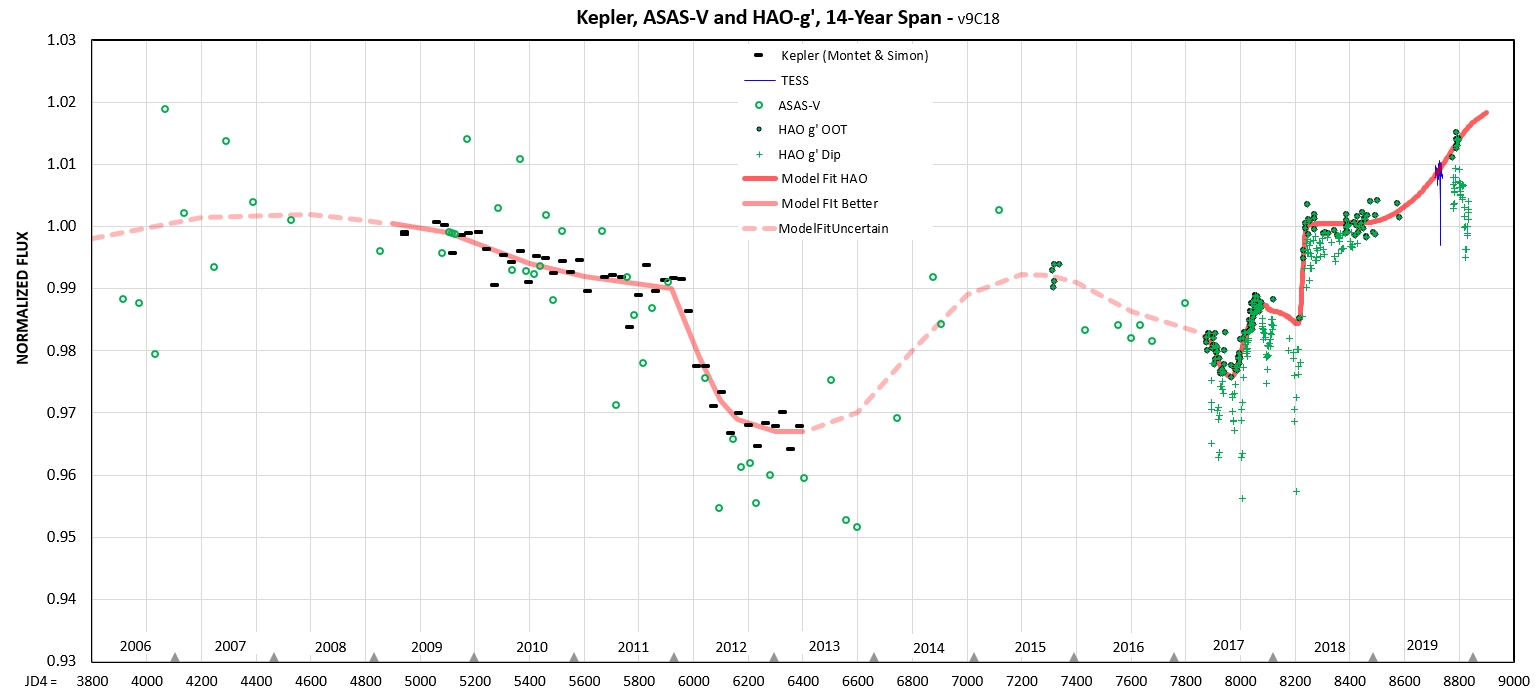
The Big Picture .
My collaboration policy
Speculations about physical model
References
Links on another web page
HAO precision explained (580 ppm)
DASCH comment
This is the 10th web page devoted to my observations of Tabby's Star for the date interval 2020.09.27 to 2020.12.20
The 11th edition (for 2021.04.25 and later) is available at http://www.brucegary.net/ts11/
Go back to 9th of 10 web pages (for dates 2019.01.20 to 2020.01.11)
Go back to 8th of 10 web pages (for dates 2018.10.10 to 2019.01.19)
Go back to 7th of 10 web pages (for dates 2018.08.12 to 2018.10.04)
Go back to 6th of 10 web pages (for dates 2018.02.25 to 2018.08.01)
Go back to 5th of 10 web pages (for dates 2017.11.13 to 2018.01.03)
Go back to 4th of 10 web pages (for dates 2017.09.21 to 2017.11.13)
Go back to 3rd of 10 web pages (for dates 2017.08.29 to 2017.09.18)
Go back to 2nd of 10 web pages (for dates 2017.06.18 to 2017.08.28)
Go back to 1st of 10 web pages (for dates 2014.05.02 to 2017.06.17)
Reference Star Quality Assessment (the 10 best stars out of 25 evaluated)
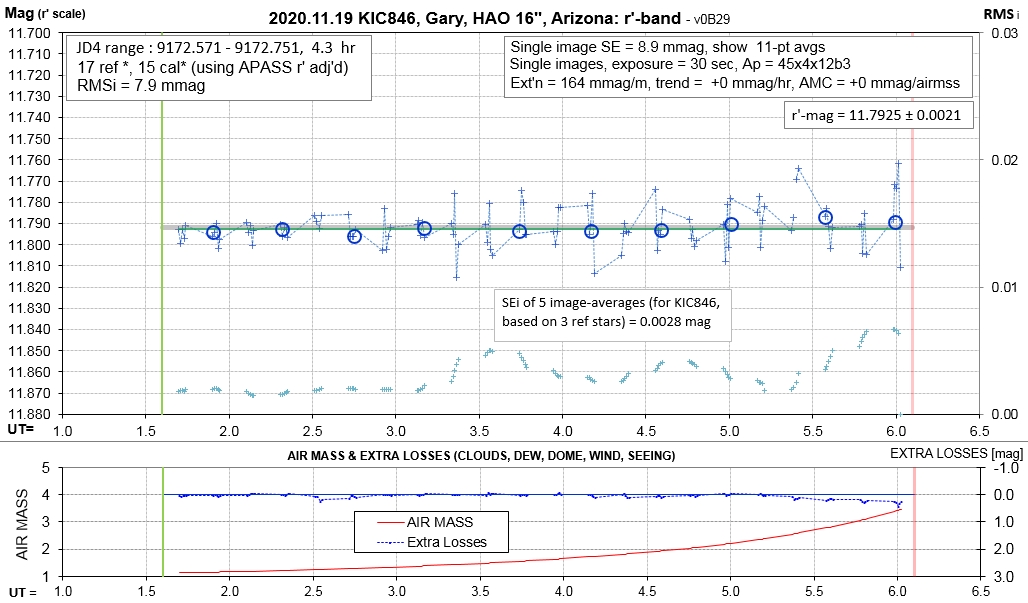
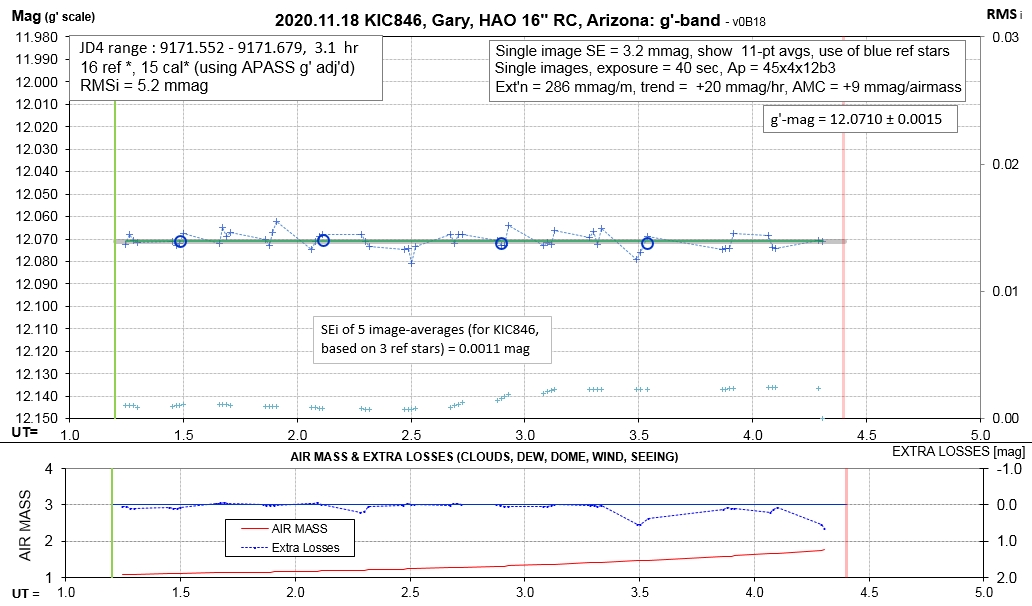
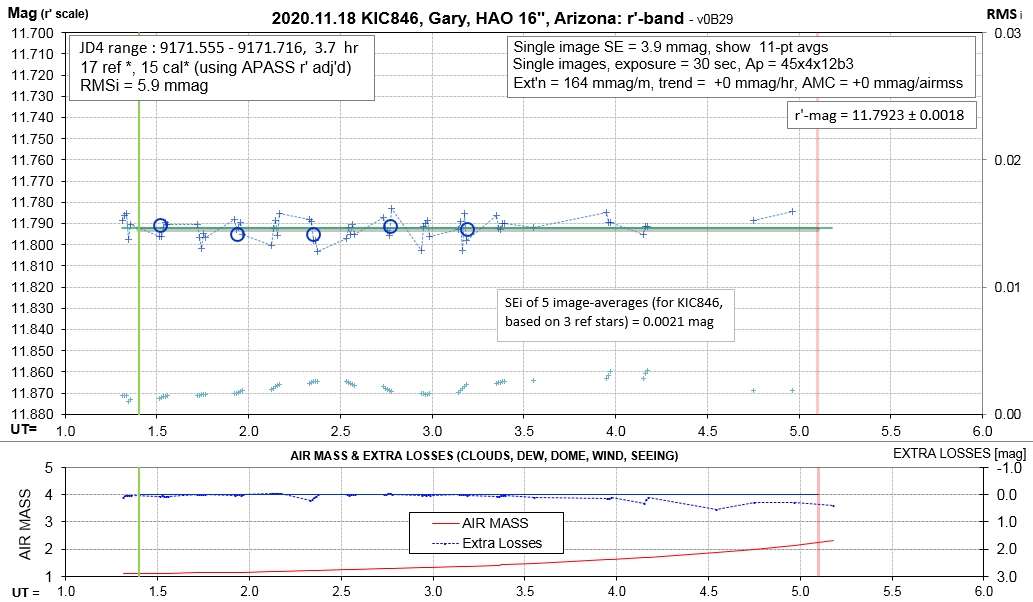
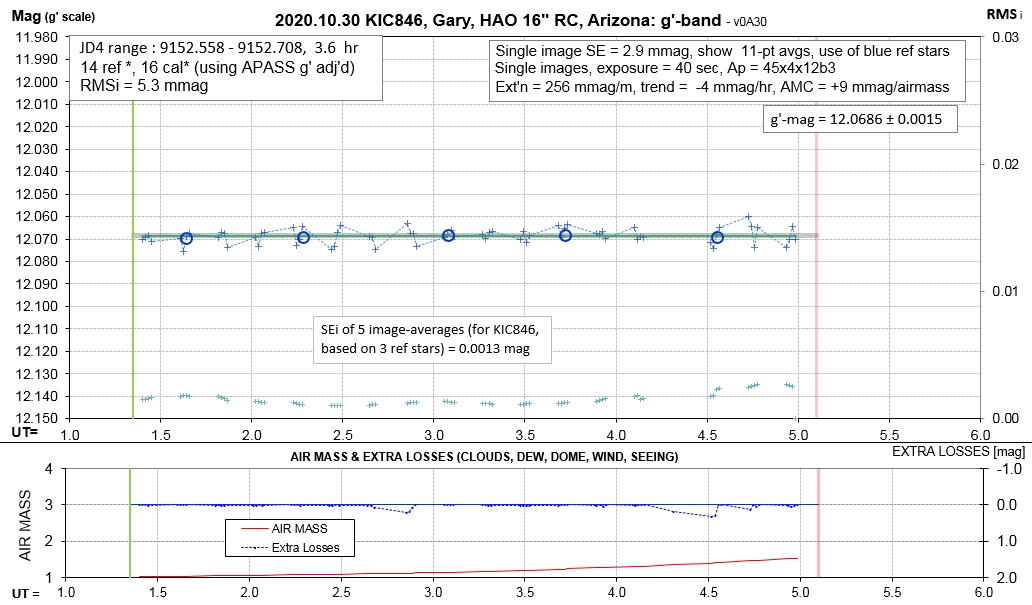
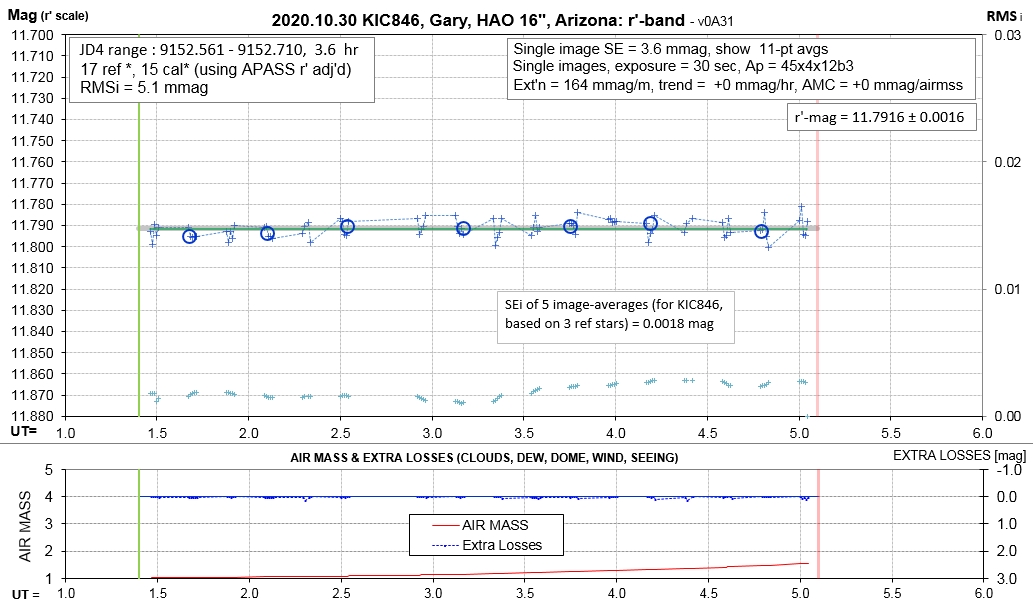
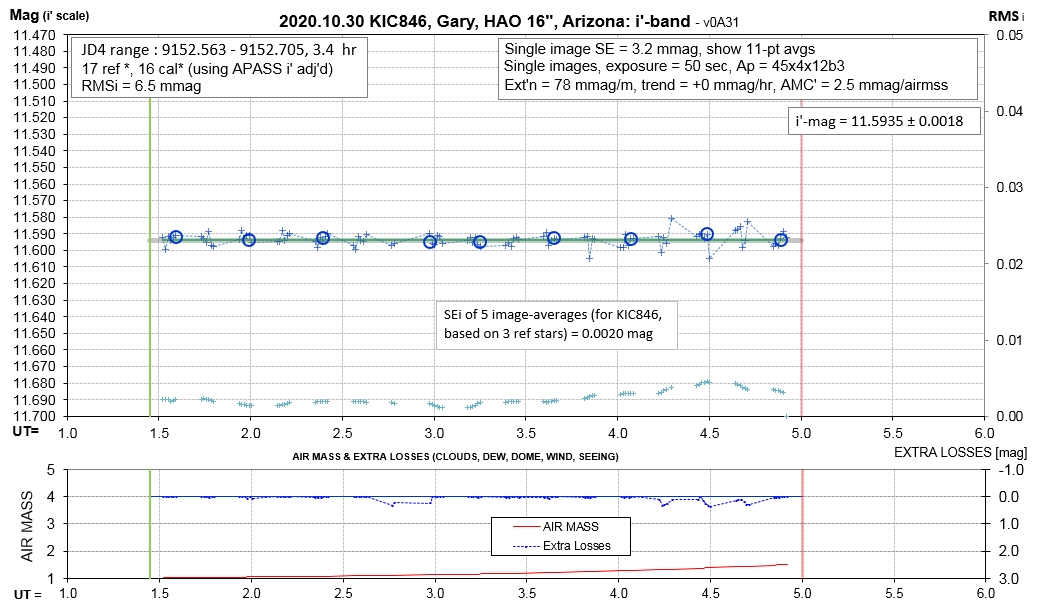
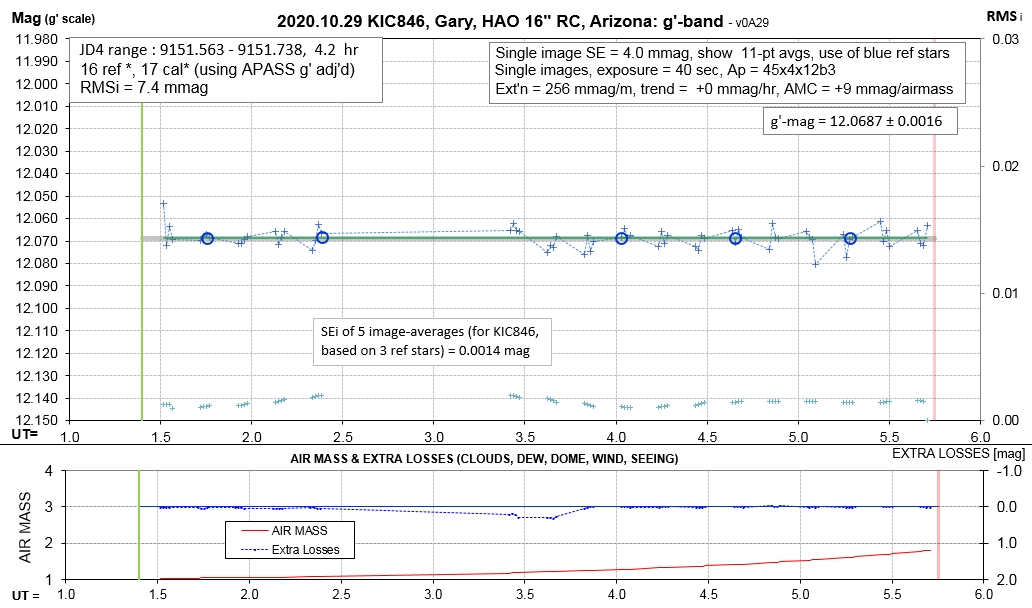
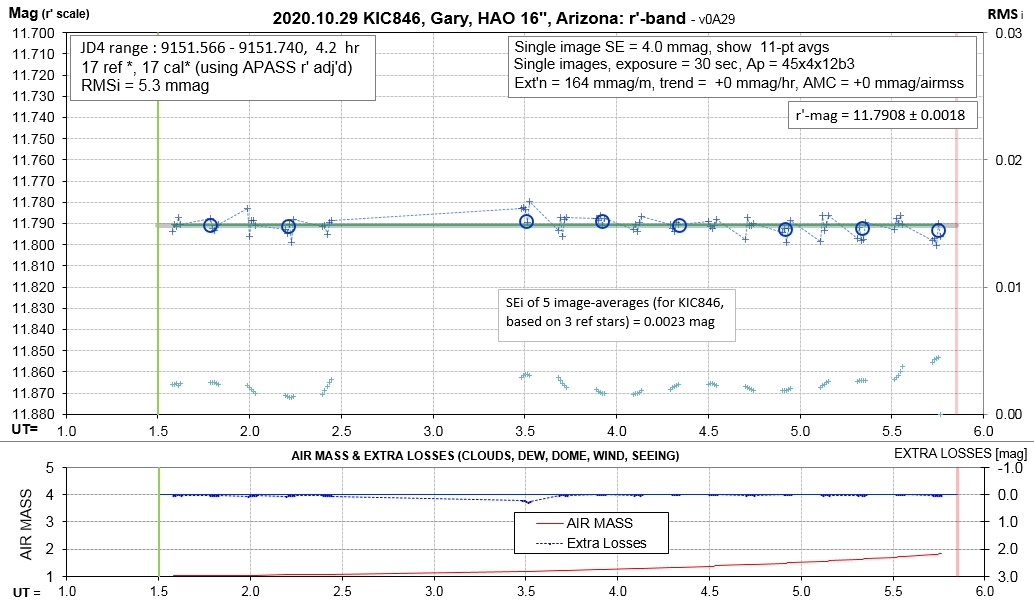
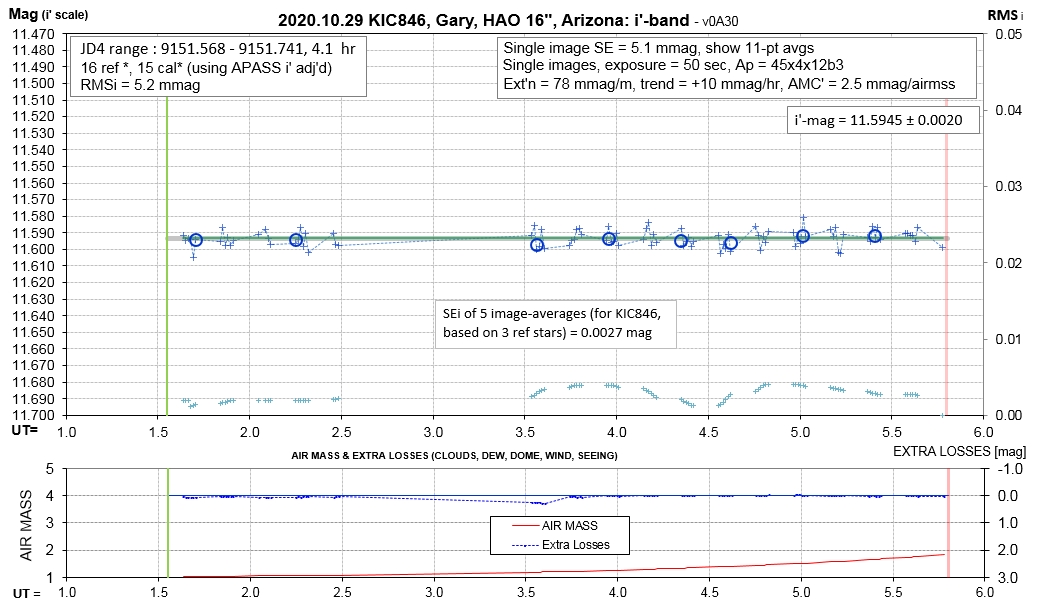
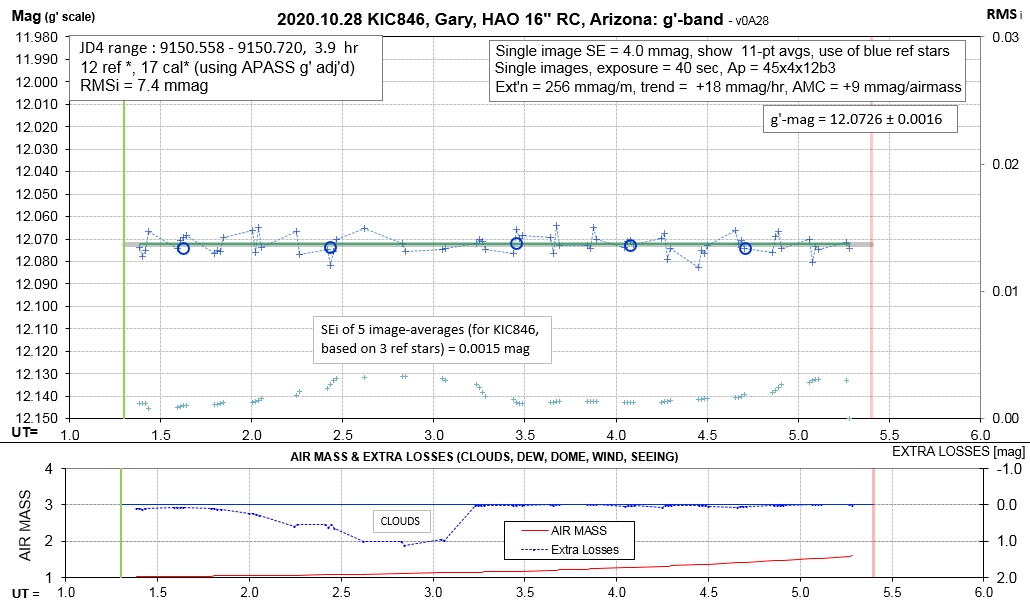
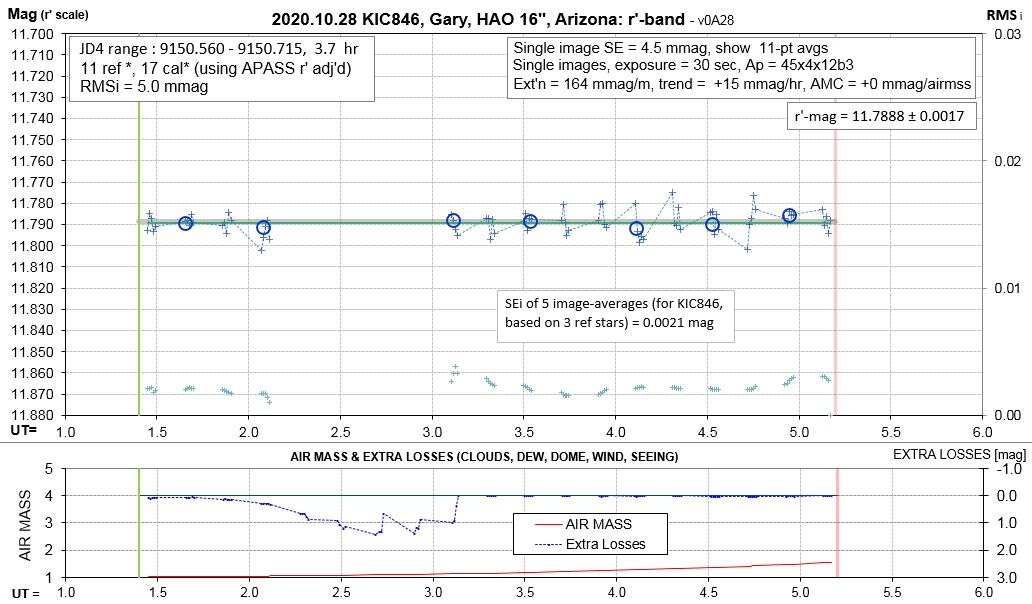
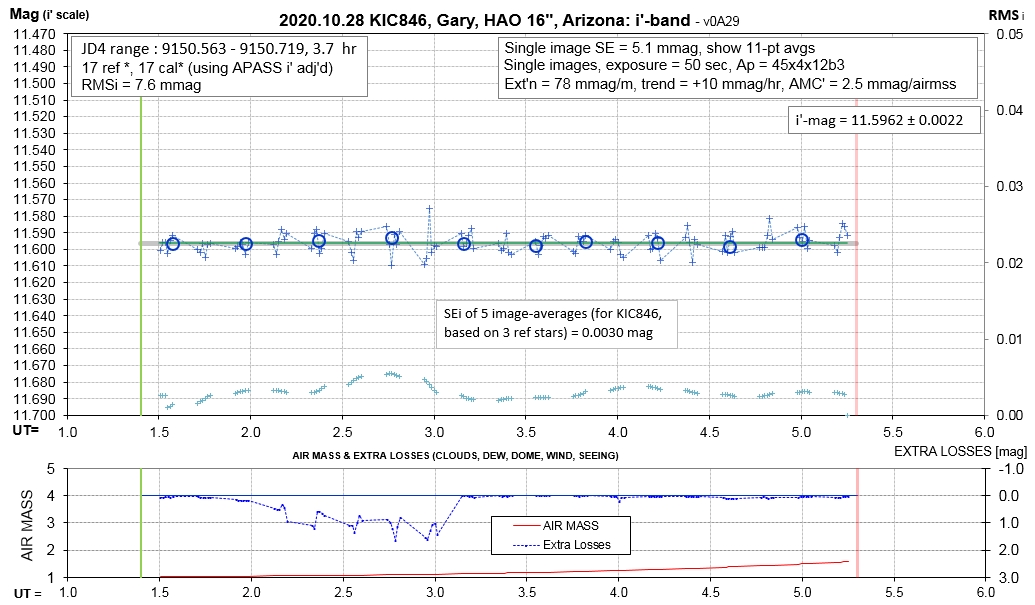
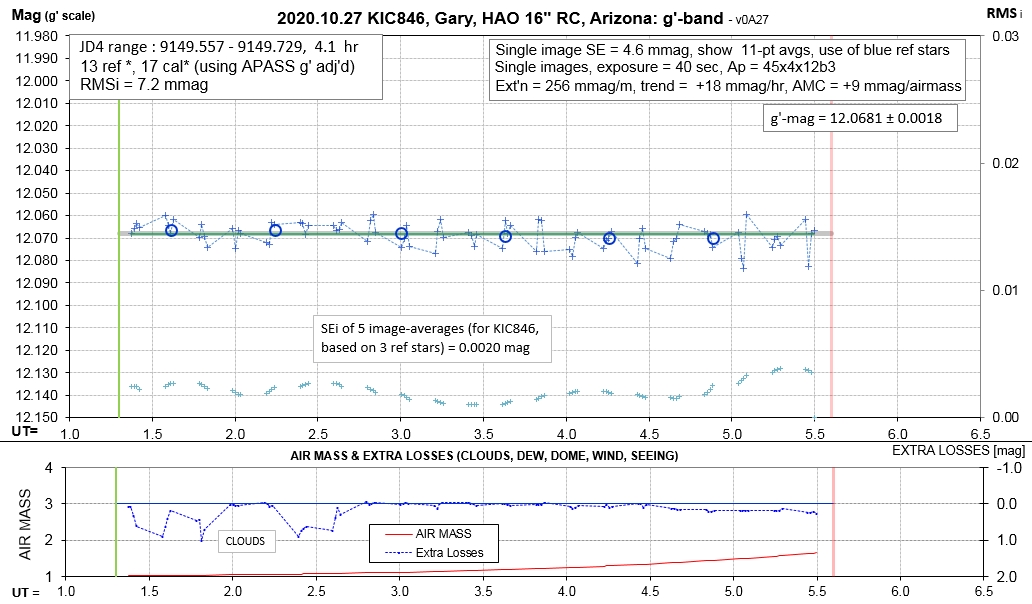
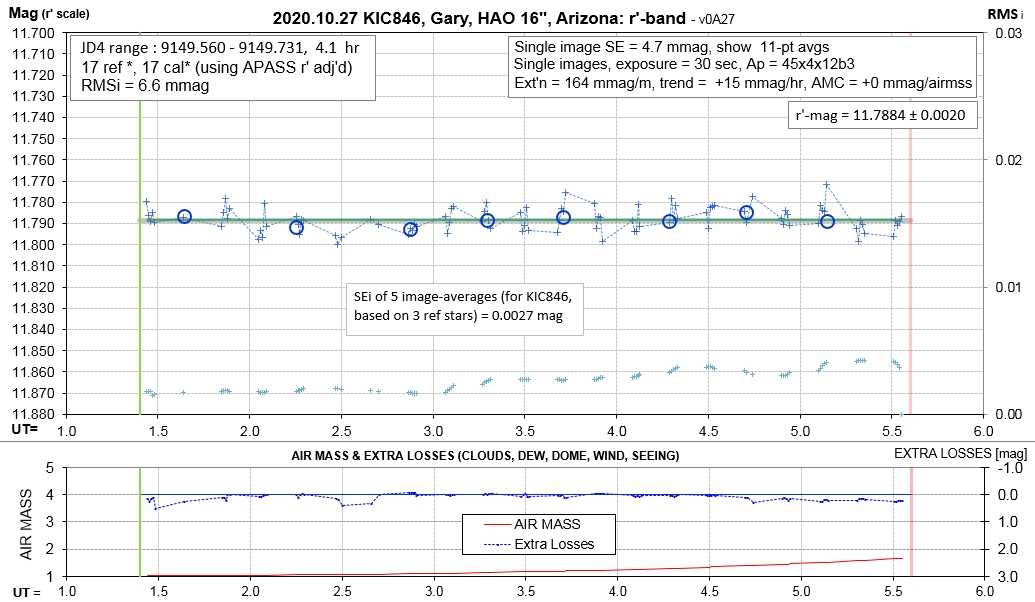
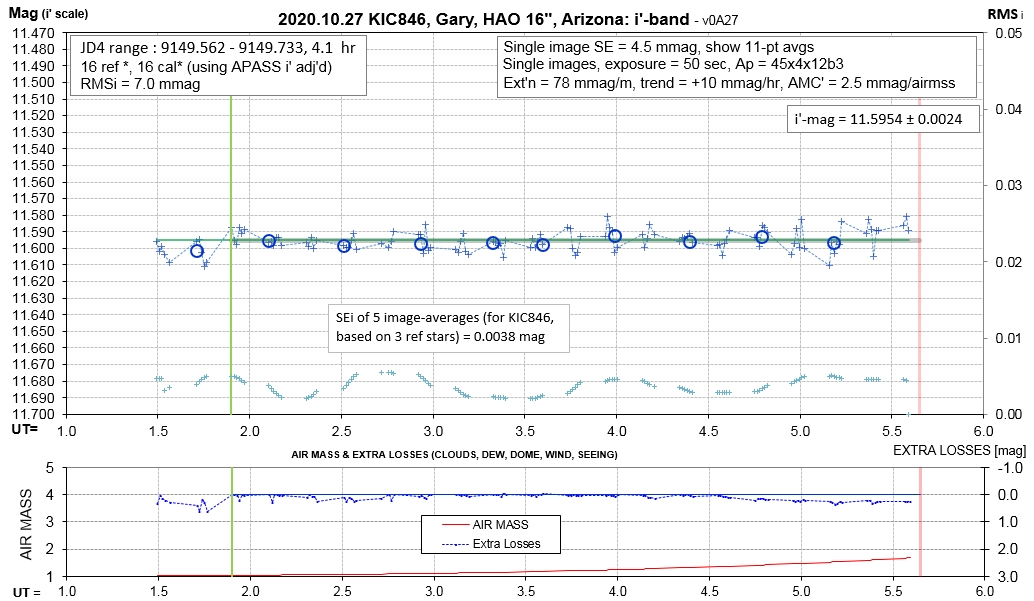
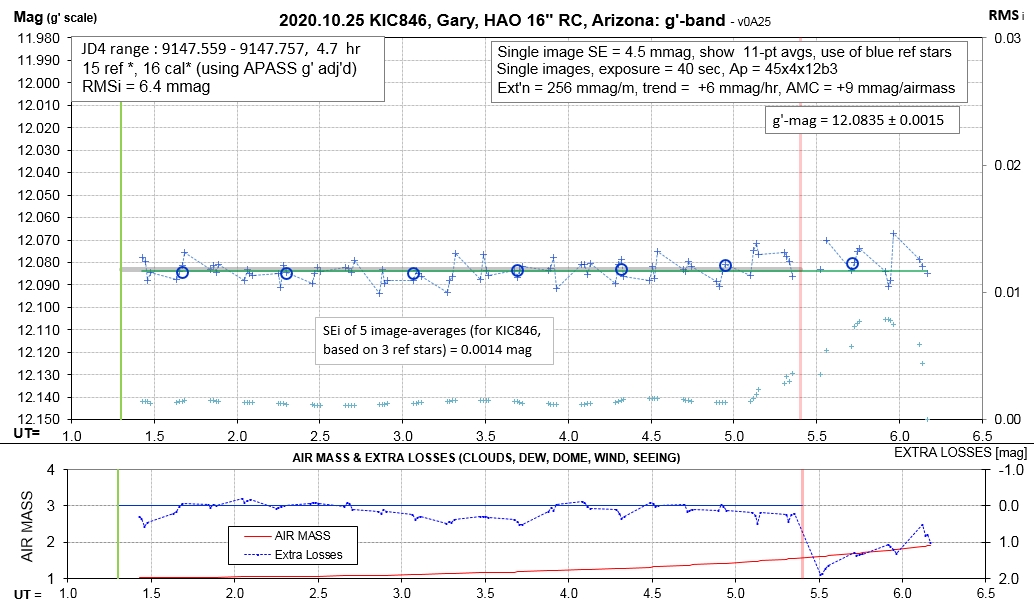
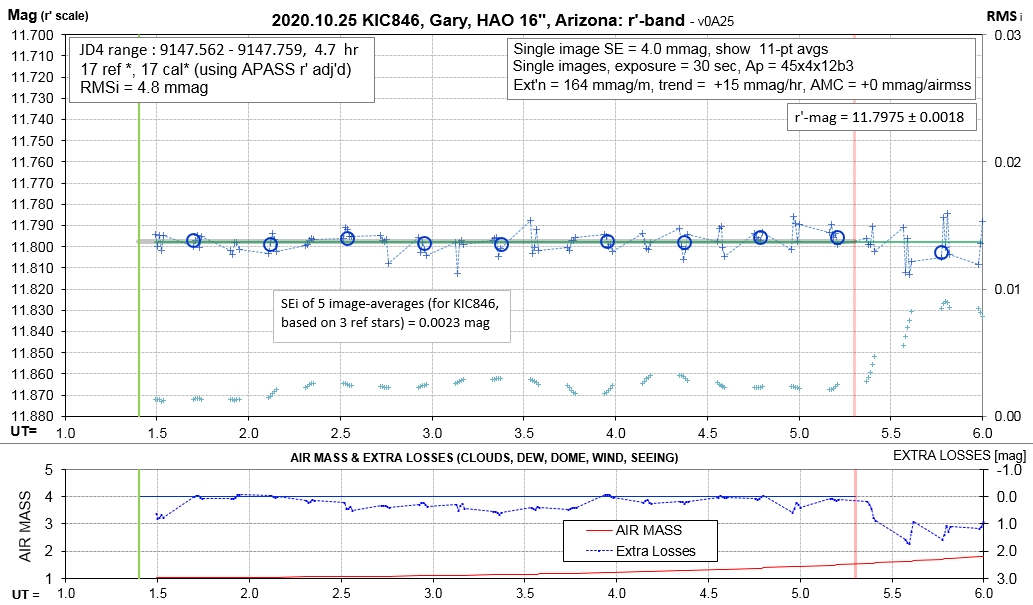
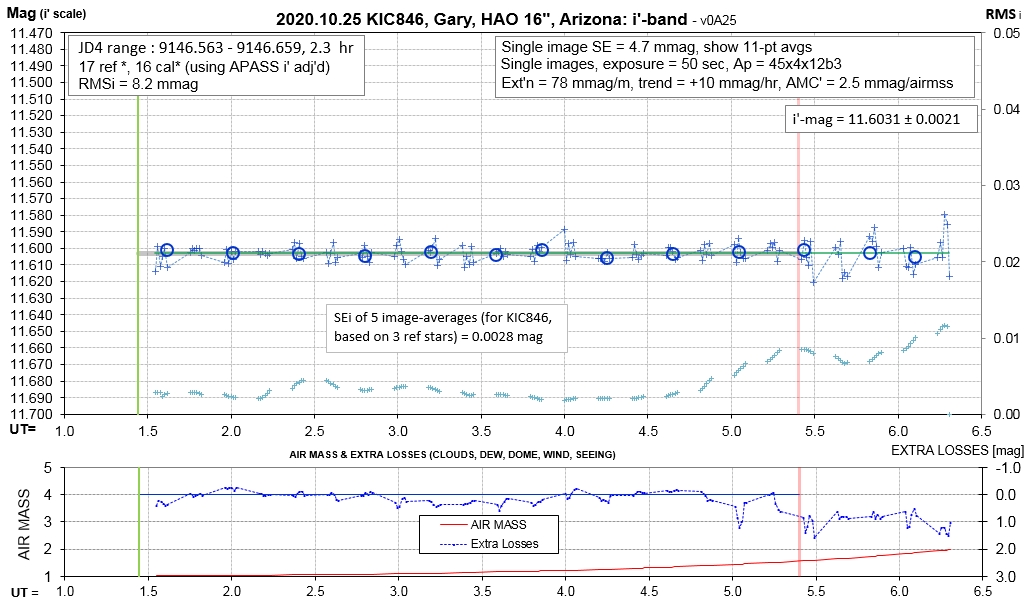
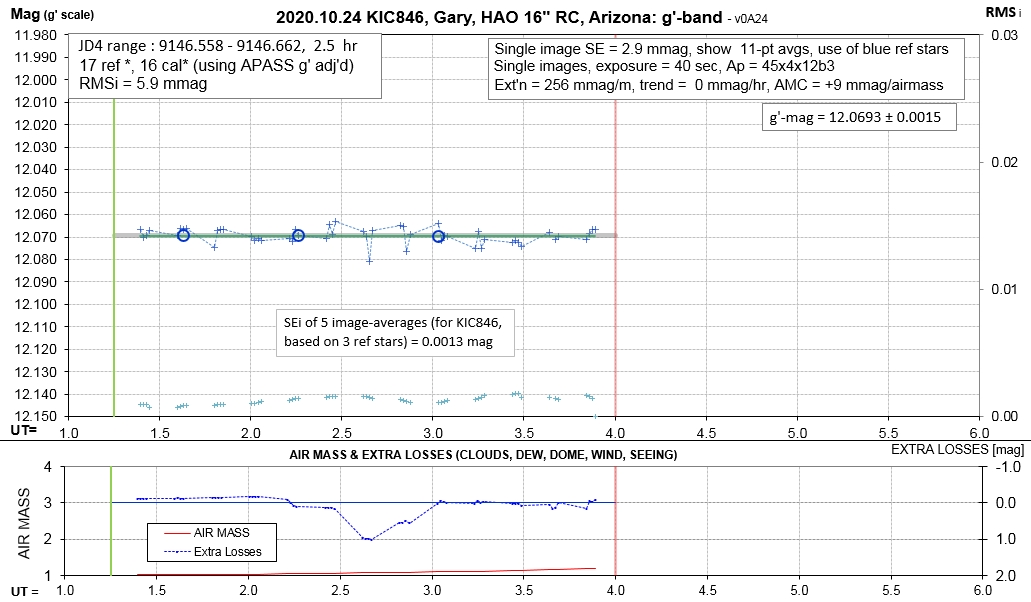
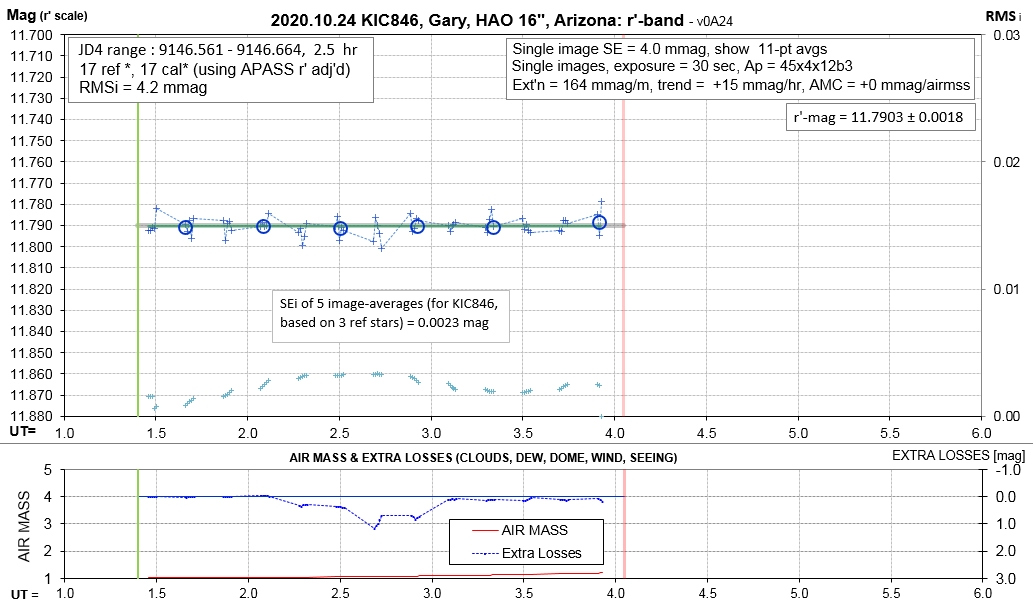
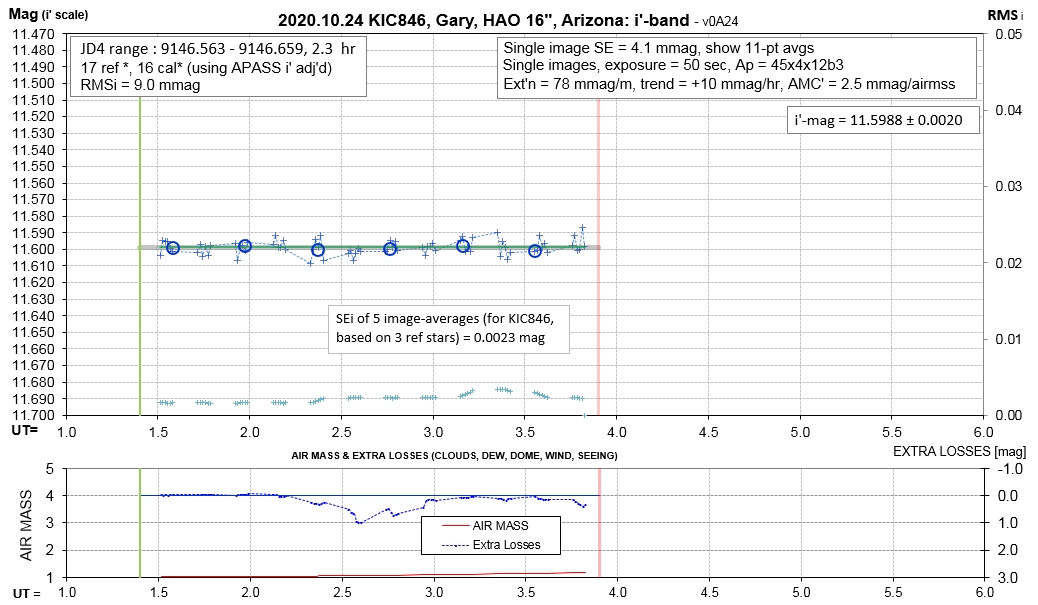
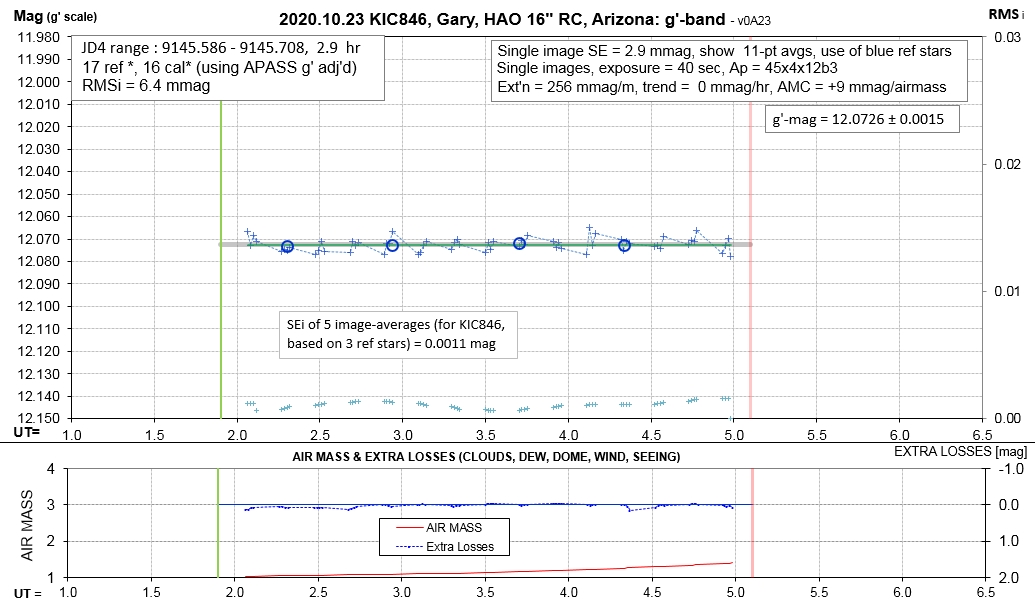
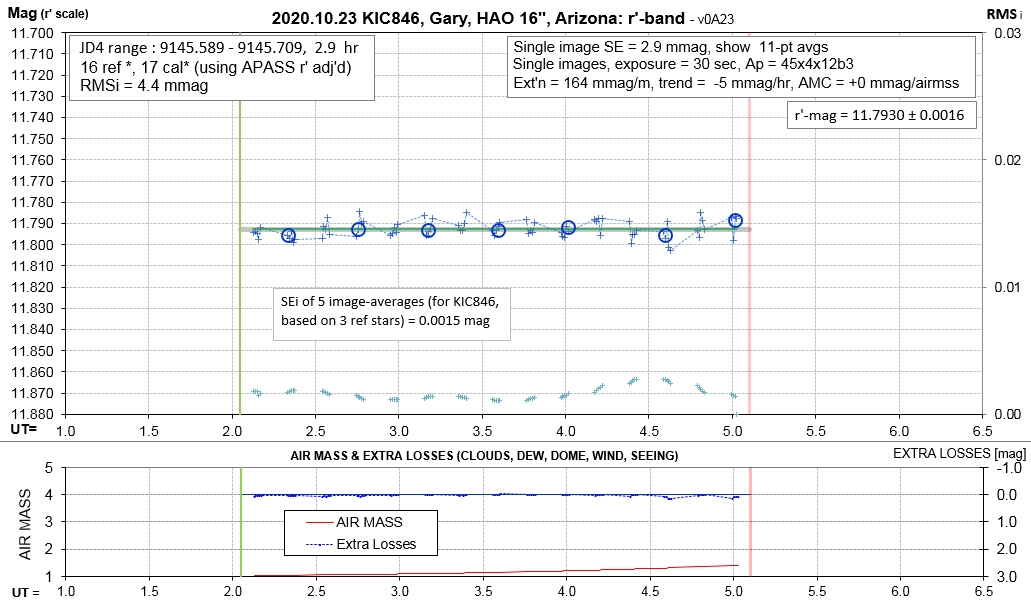
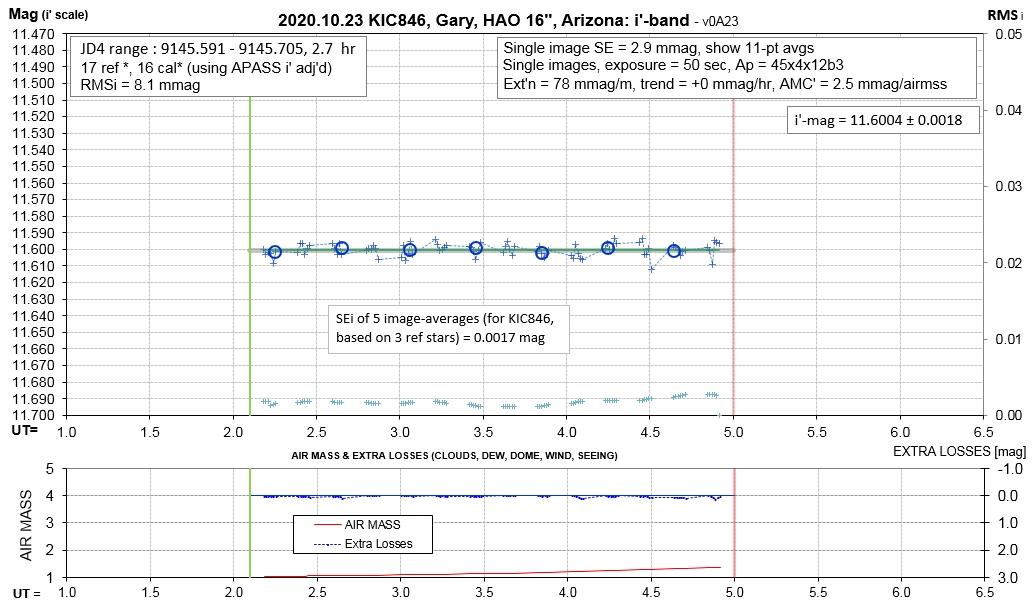
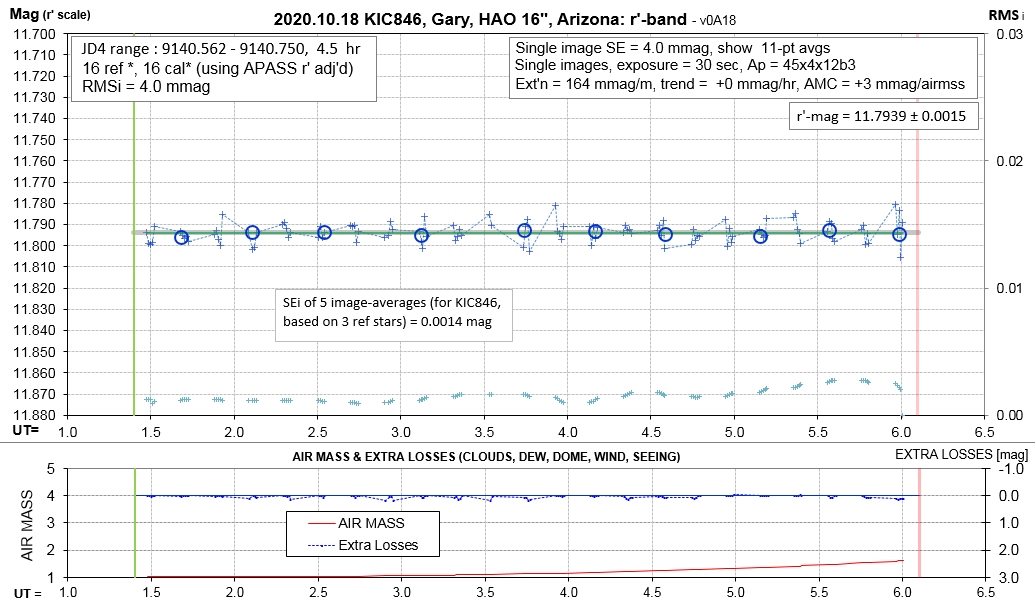
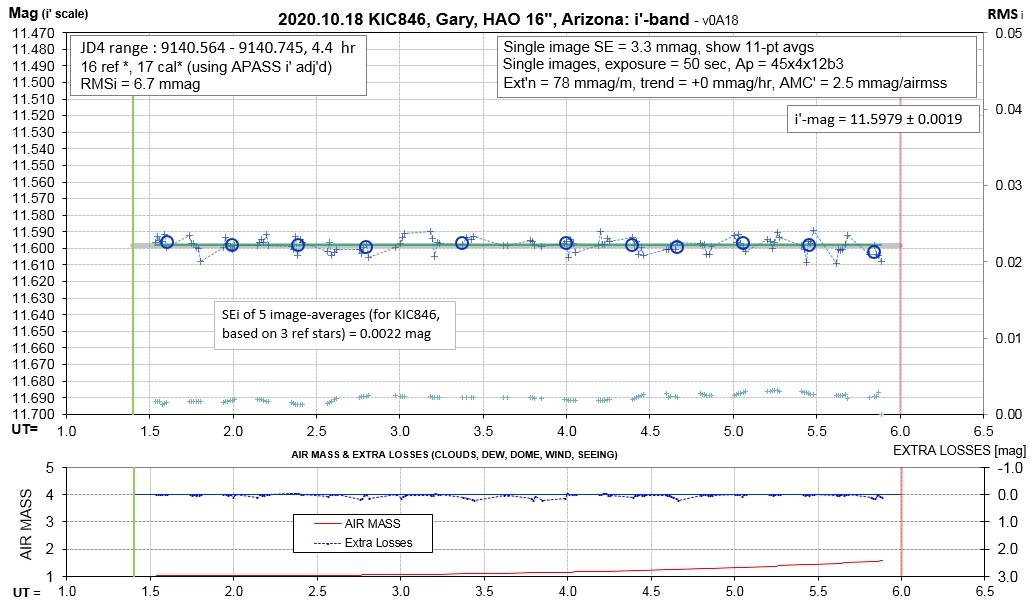
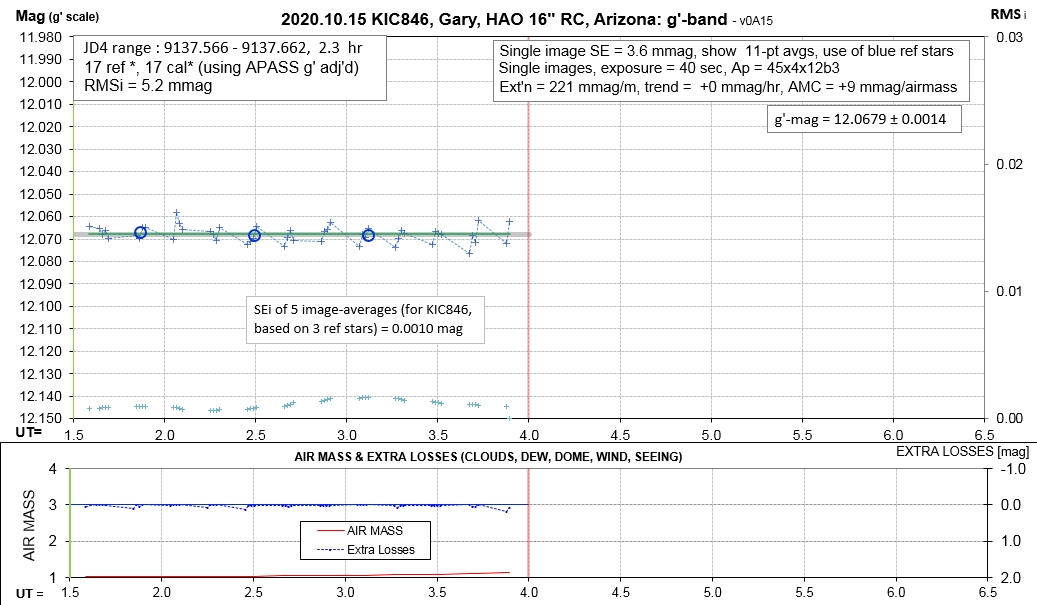
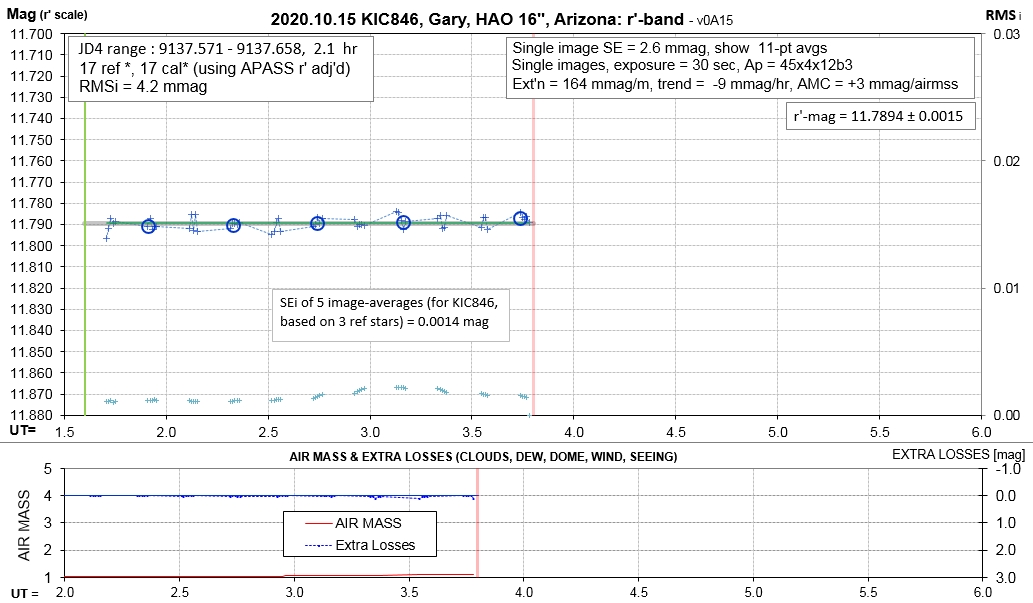
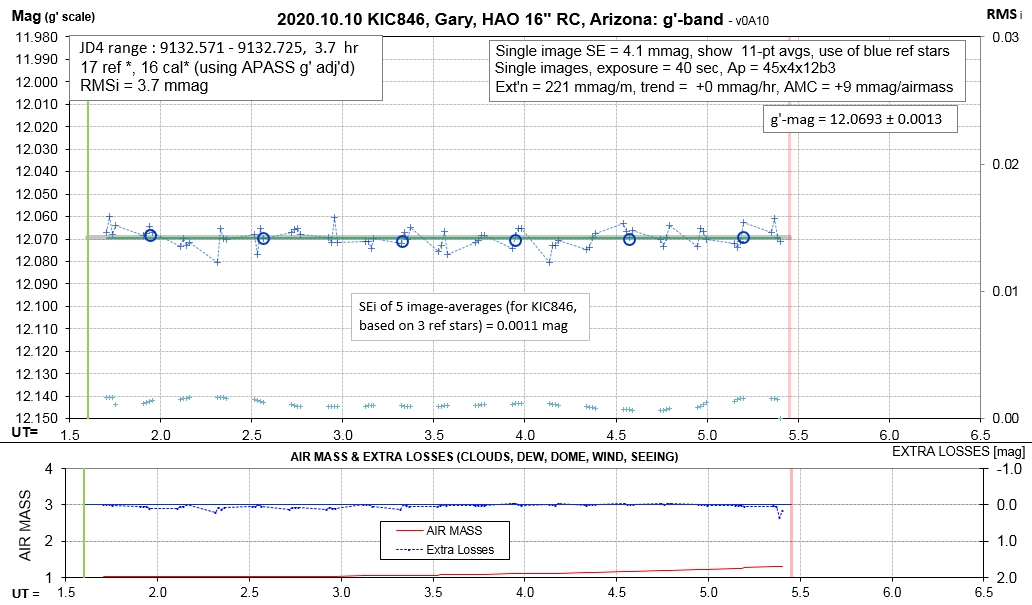
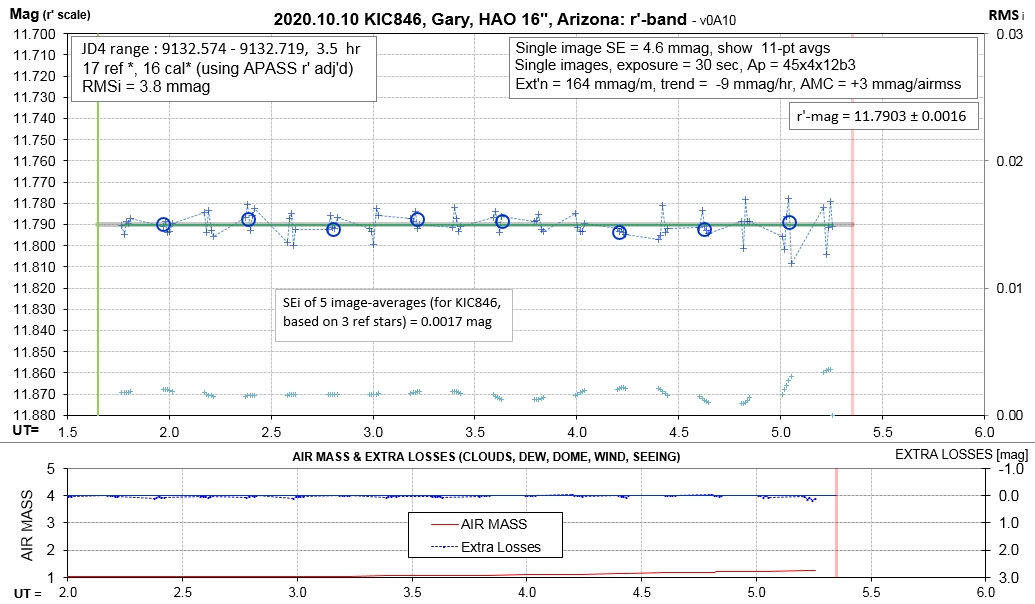
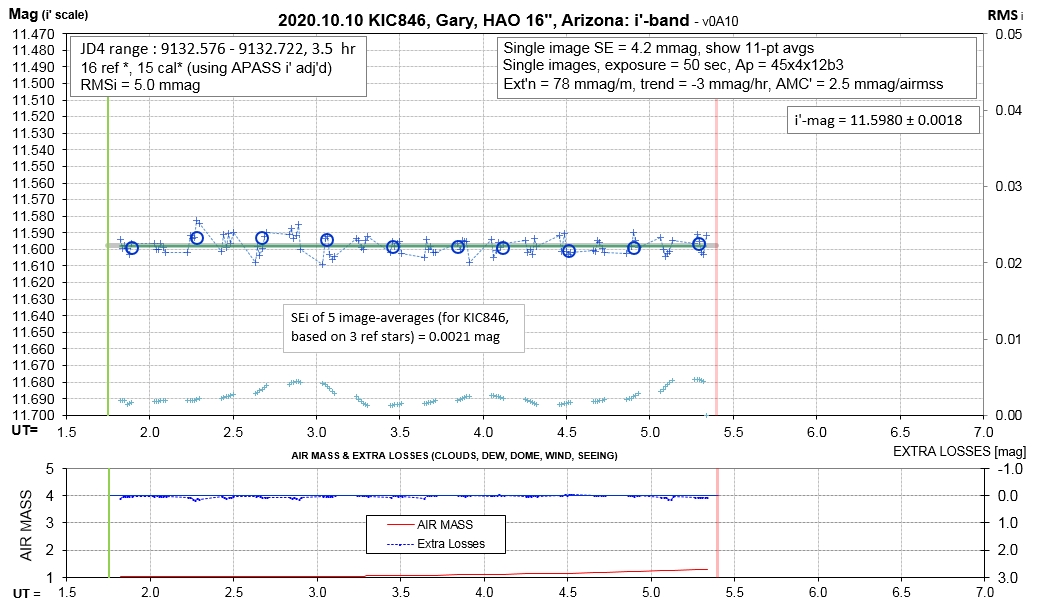
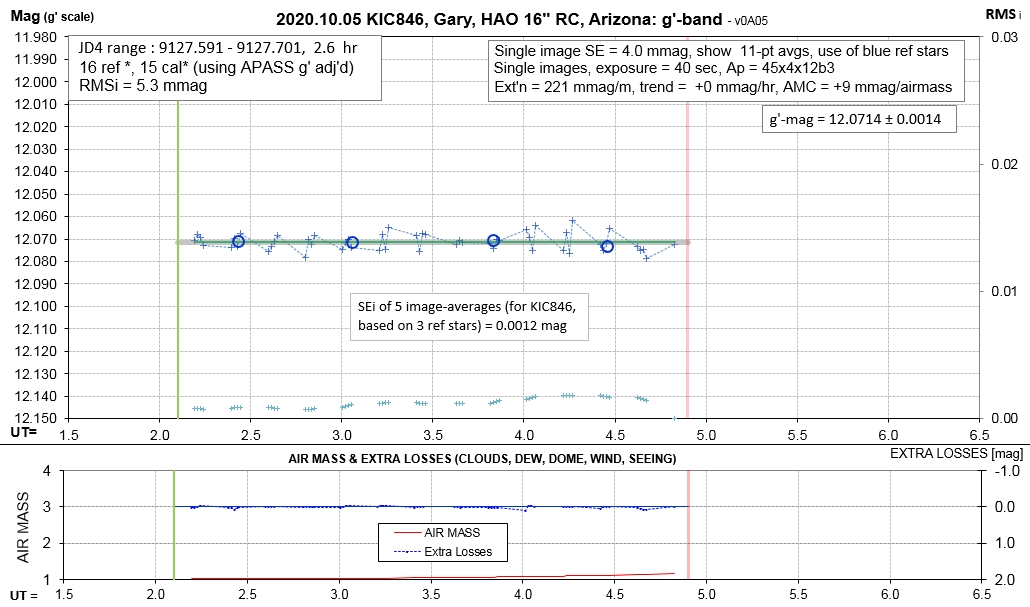
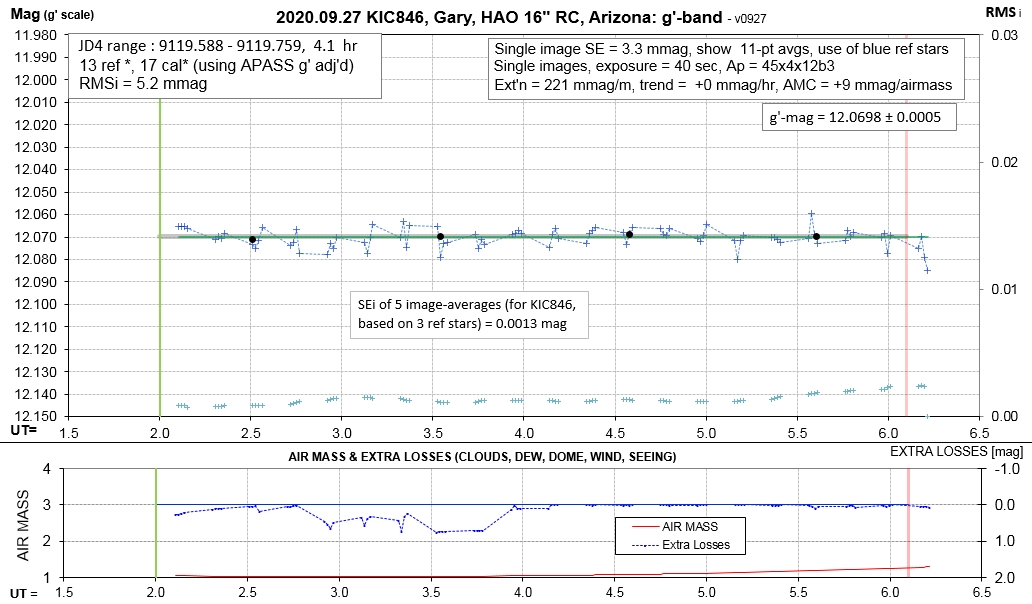
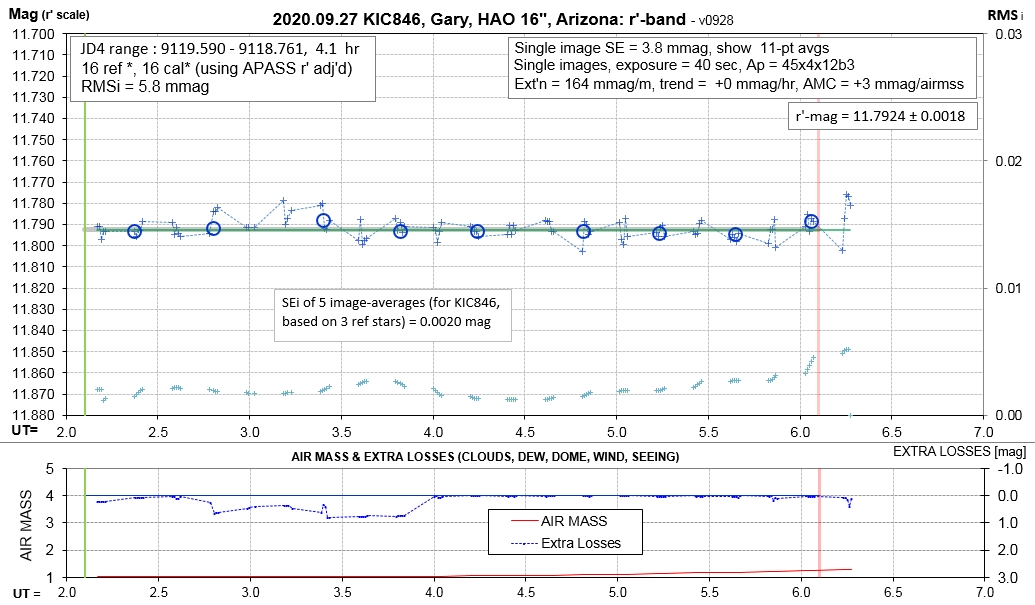
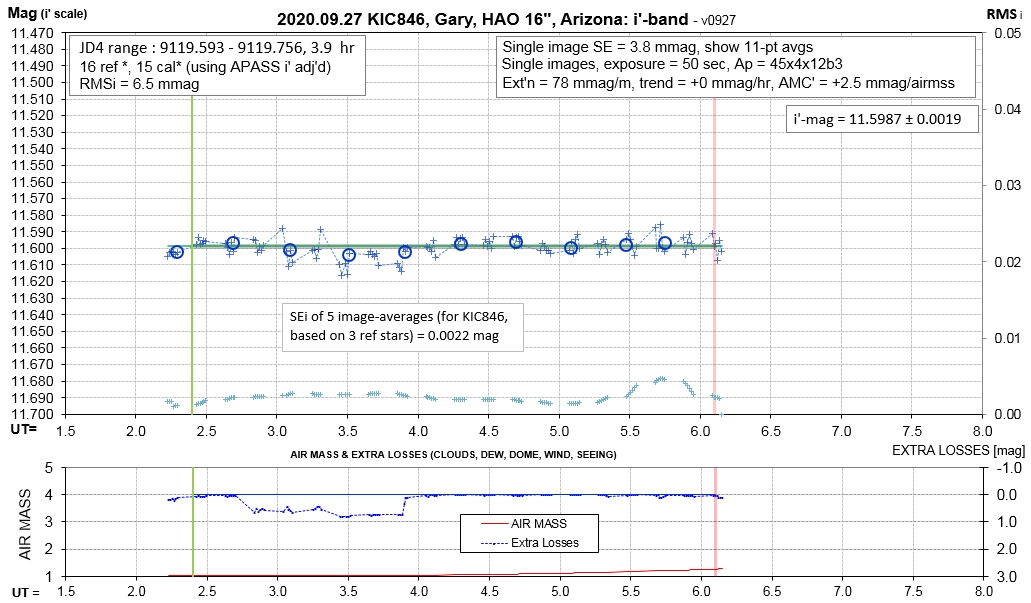
g', r' and i' Mag's vs. Date
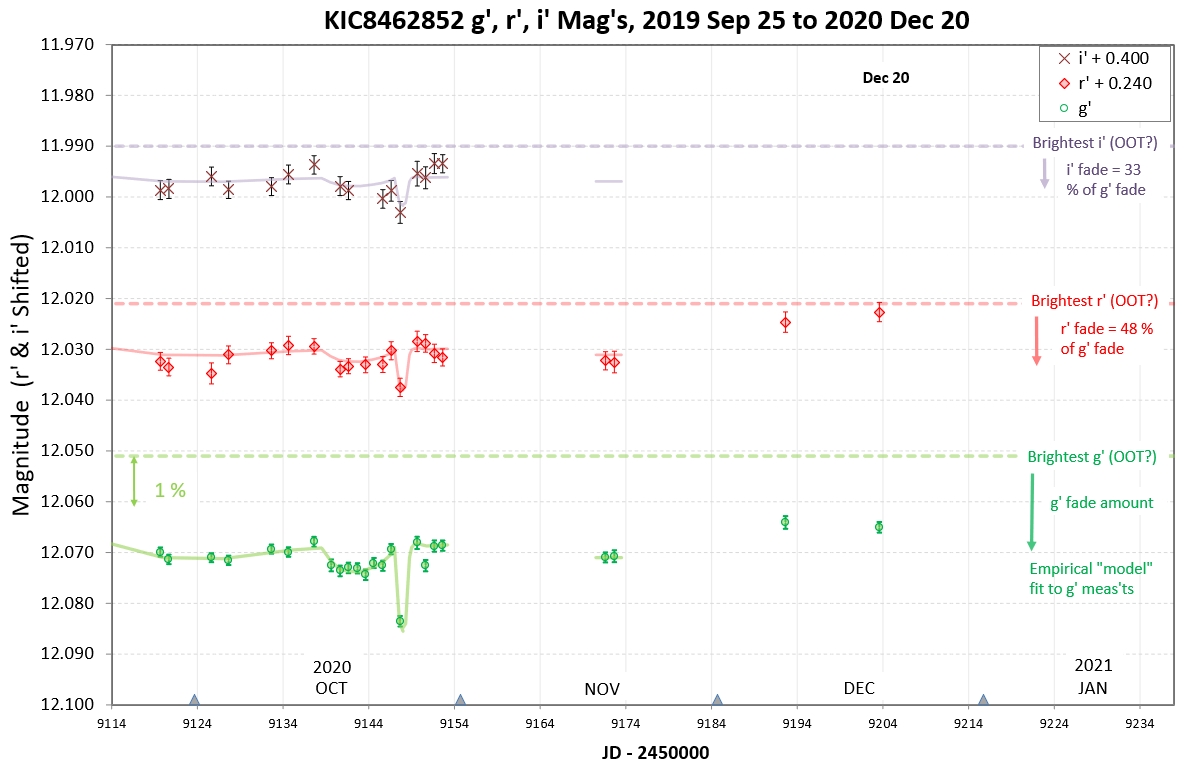
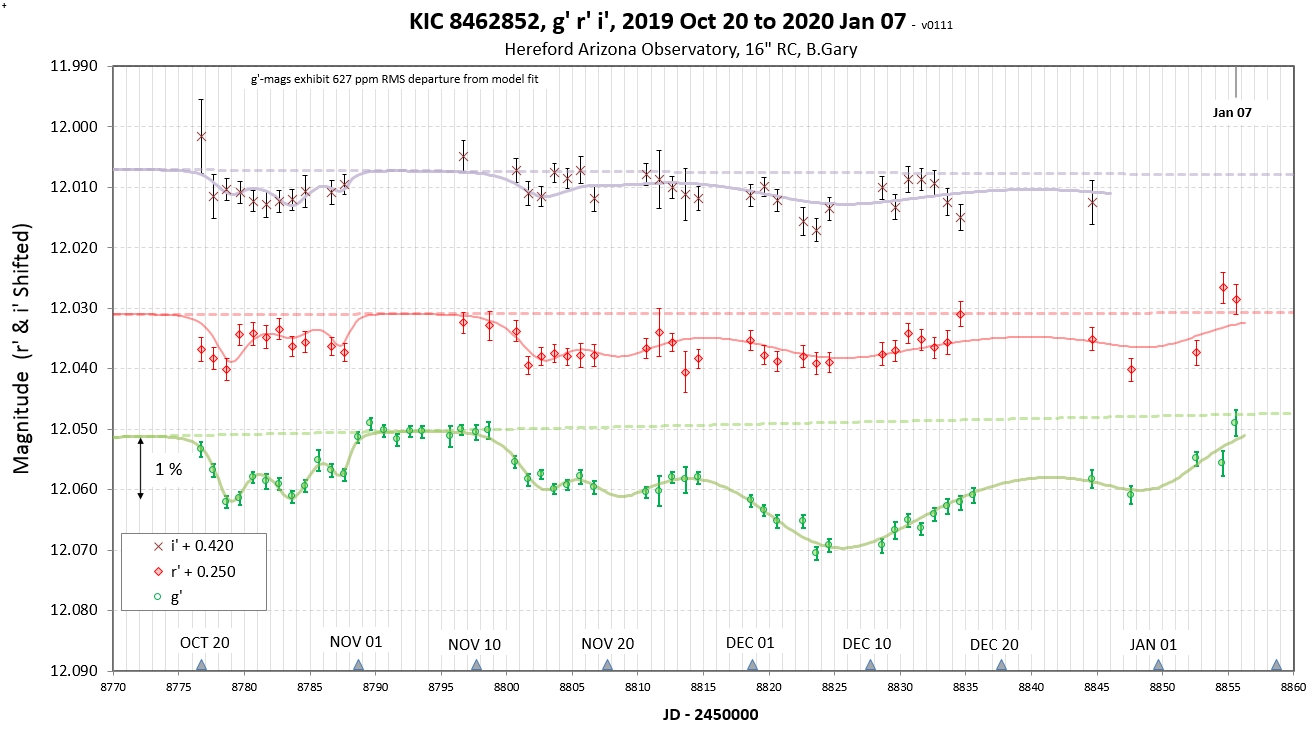
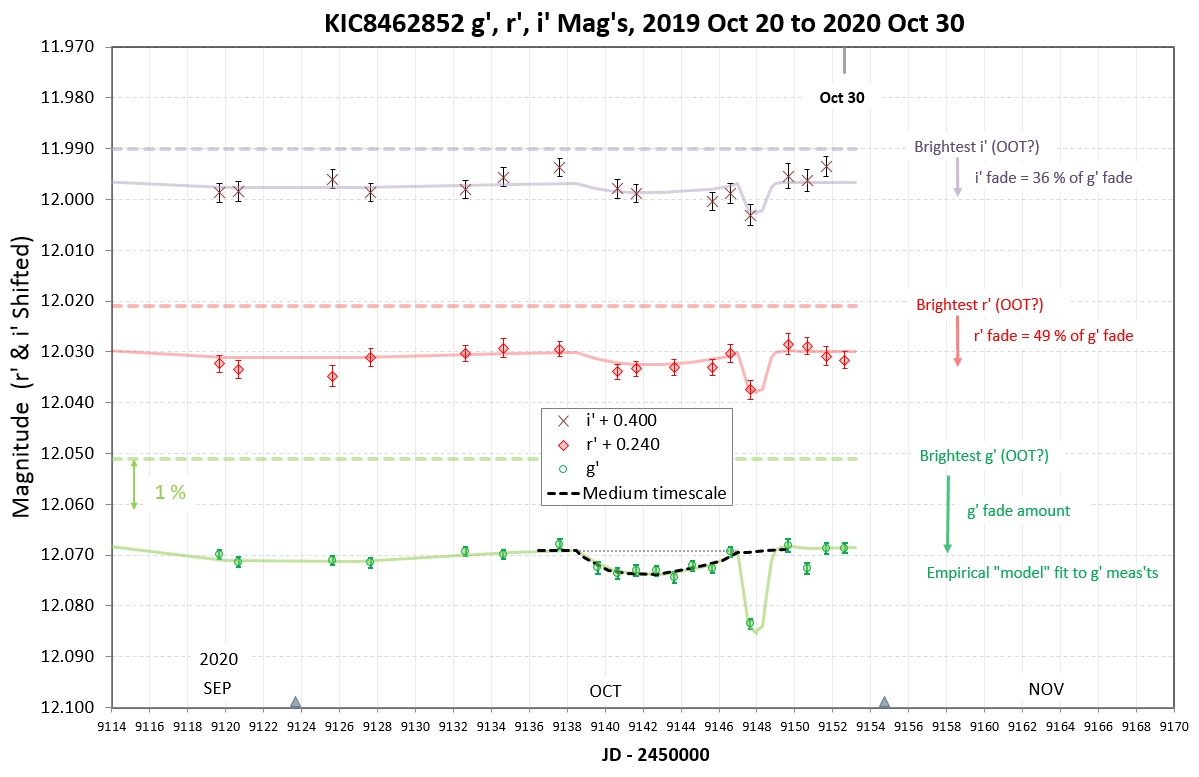
Figure 1. HAO g', r' and i'-magnitudes for the past month. The horizontal dashed lines are suggestions for OOT levels, set to the brightest magnitudes observed during the past two years (when I began observing in three bands).
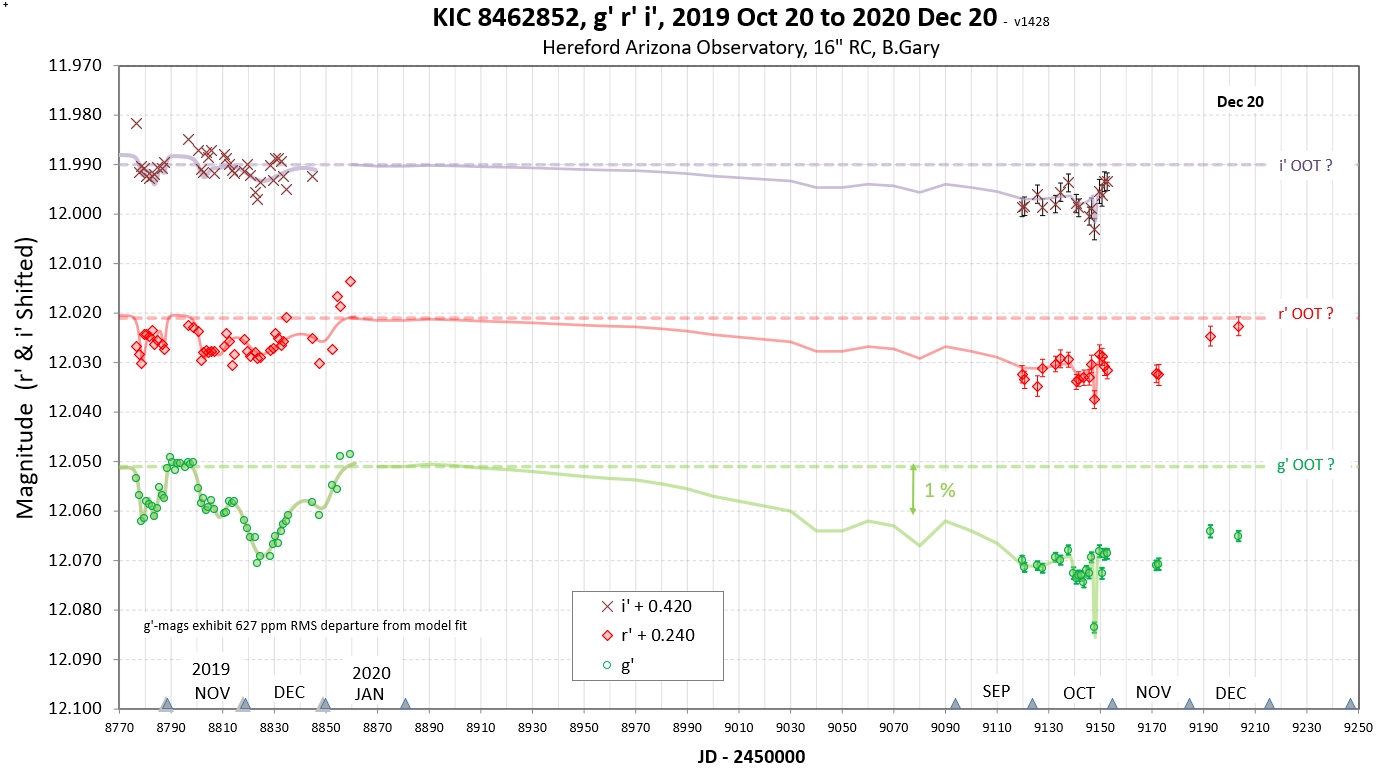
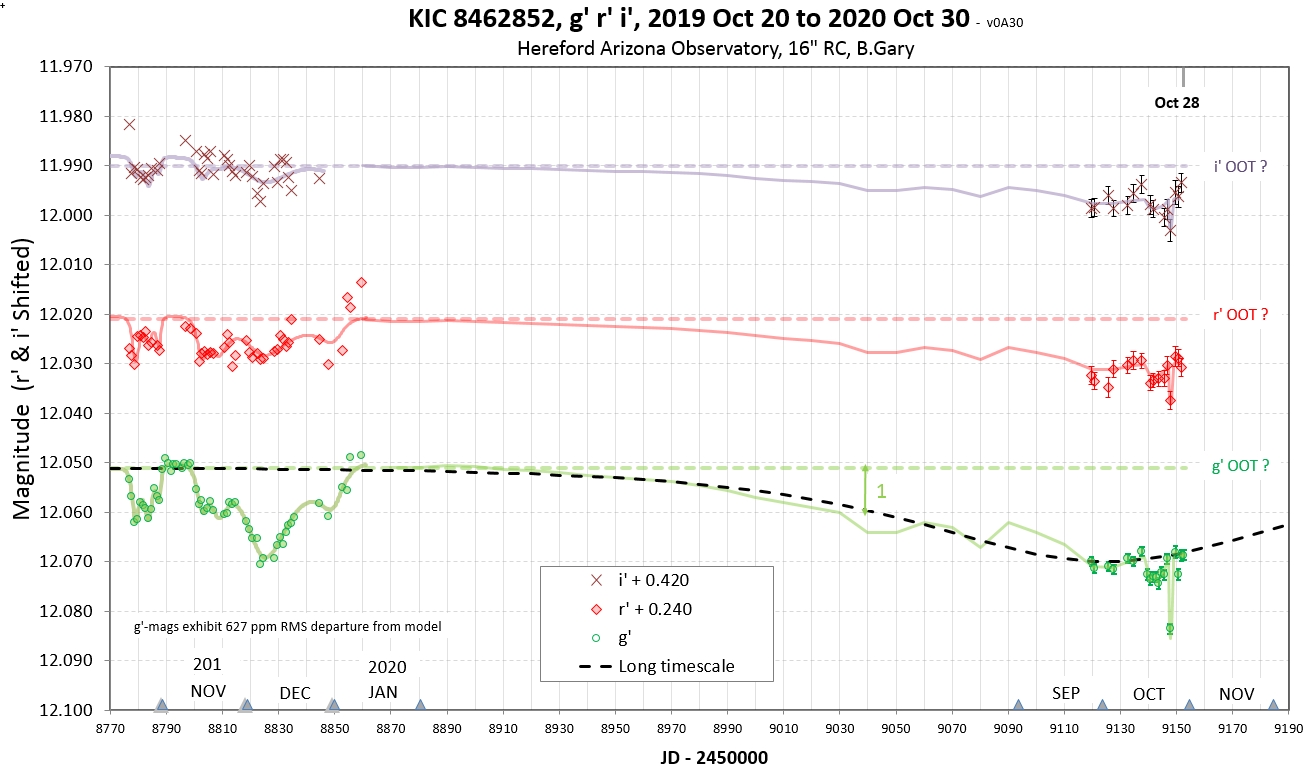
Figure 2. HAO g', r' and i'-magnitudes for the past year. The g' trace from JD4 9000 to 9120 are from Sjoed Dufoer's AAVSO-submitted V band magnitudes (shift adjusted to match my g'-mags, and smoothed). The r' and i' traces are departures from the respective OOT levels multiplied by the g'-mag departures from the g' OOT level. The multipliers for r' band and i' band are 0.56 and 0.40. In other words, the r' and i' fade amounts are 56 and 40 % of the g' fade amounts.
Here's my suggestion for understanding the previous two figures:
1) During the past two years there was a 10-day interval (early November, 2019) when all bands were at their maximum brightness. I interpret these to be OOT levels (no dust clouds, just an unobstructed view of the star).
2) There are two components of dust cloud: broad, producing slow fades of brightness (month timescale) and small, producing brief fades (a few days timescale).
3) Both dust cloud components have similar "particle size distributions" (PSDs) that are dominated by small particles (< 0.5 micron radius), so they produce greater fades at shorter wavelengths.
4) The fade ratios for r' to g' and i' to g' would be the same for all dust clouds if they had the same PSDs. Since specific dust cloud PSDs may differ the observed ratios may vary over time.
5) On the assumption that all dust clouds have the same PSD it should be possible to predict r' and i' fade amounts by multiplying the g' fade amount by fixed ratios.
6) So far it appears that the fixed ratios are 0.54 and 0.40. These values should provide a constraint on PSD functions. (I need help with that.)
The overall conclusion from these observations is that both the short-timescale dipping and long-timescale variations are caused by dust clouds dominated by small particles!
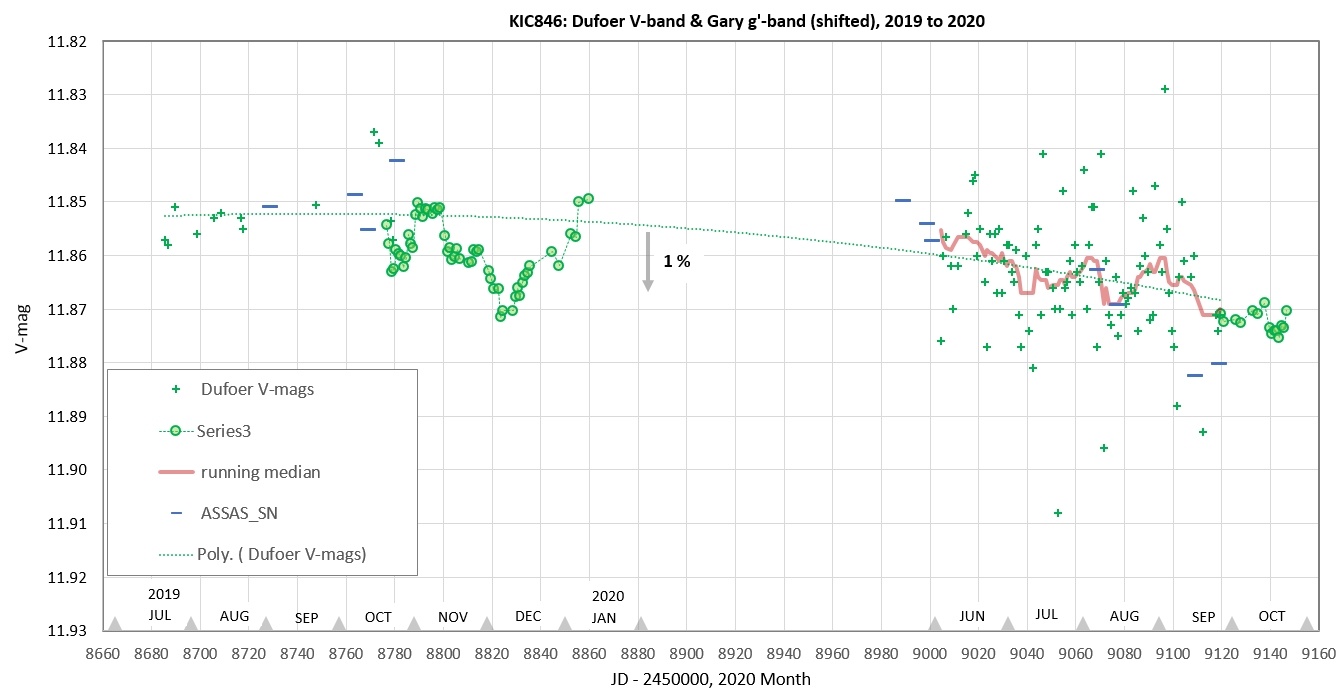
Figure 3. Comparison of Sjoed Dufoer's AAVSO-submitted V band magnitudes and my g' band magnitudes (shifted for approximate "agreement").
ASASS SN B band measurements support the above fade variation (as Rafik Bourne has determined).
Links on this web page
g', r' & i' magnitudes vs. date (for last 2 months & last year)
List of observing sessions (starting 2019 Oct 04)
Finder image (showing my ref stars)
The Big Picture .
My collaboration policy
Speculations about physical model
References
Links on another web page
HAO precision explained (580 ppm)
DASCH comment
This is the 10th web page devoted to my observations of Tabby's Star for the date interval 2020.09.27 to 2020.12.20
The 11th edition (for 2021.04.25 and later) is available at http://www.brucegary.net/ts11/
Go back to 9th of 10 web pages (for dates 2019.01.20 to 2020.01.11)
Go back to 8th of 10 web pages (for dates 2018.10.10 to 2019.01.19)
Go back to 7th of 10 web pages (for dates 2018.08.12 to 2018.10.04)
Go back to 6th of 10 web pages (for dates 2018.02.25 to 2018.08.01)
Go back to 5th of 10 web pages (for dates 2017.11.13 to 2018.01.03)
Go back to 4th of 10 web pages (for dates 2017.09.21 to 2017.11.13)
Go back to 3rd of 10 web pages (for dates 2017.08.29 to 2017.09.18)
Go back to 2nd of 10 web pages (for dates 2017.06.18 to 2017.08.28)
Go back to 1st of 10 web pages (for dates 2014.05.02 to 2017.06.17)
Reference Star Quality Assessment (the 10 best stars out of 25 evaluated)
g', r' and i' Mag's vs. Date
Figure 1. HAO g', r' and i'-magnitudes for the past month. The horizontal dashed lines are suggestions for OOT levels, set to the brightest magnitudes observed during the past two years (when I began observing in three bands).
Figure 2. HAO g', r' and i'-magnitudes for the past year. The g' trace from JD4 9000 to 9120 are from Sjoed Dufoer's AAVSO-submitted V band magnitudes (shift adjusted to match my g'-mags, and smoothed). The r' and i' traces are departures from the respective OOT levels multiplied by the g'-mag departures from the g' OOT level. The multipliers for r' band and i' band are 0.56 and 0.40. In other words, the r' and i' fade amounts are 56 and 40 % of the g' fade amounts.
Here's my suggestion for understanding the previous two figures:
1) During the past two years there was a 10-day interval (early November, 2019) when all bands were at their maximum brightness. I interpret these to be OOT levels (no dust clouds, just an unobstructed view of the star).
2) There are two components of dust cloud: broad, producing slow fades of brightness (month timescale) and small, producing brief fades (a few days timescale).
3) Both dust cloud components have similar "particle size distributions" (PSDs) that are dominated by small particles (< 0.5 micron radius), so they produce greater fades at shorter wavelengths.
4) The fade ratios for r' to g' and i' to g' would be the same for all dust clouds if they had the same PSDs. Since specific dust cloud PSDs may differ the observed ratios may vary over time.
5) On the assumption that all dust clouds have the same PSD it should be possible to predict r' and i' fade amounts by multiplying the g' fade amount by fixed ratios.
6) So far it appears that the fixed ratios are 0.54 and 0.40. These values should provide a constraint on PSD functions. (I need help with that.)
The overall conclusion from these observations is that both the short-timescale dipping and long-timescale variations are caused by dust clouds dominated by small particles!
Figure 3. Comparison of Sjoed Dufoer's AAVSO-submitted V band magnitudes and my g' band magnitudes (shifted for approximate "agreement").
ASASS SN B band measurements support the above fade variation (as Rafik Bourne has determined).

 B L G a r y at u m i c h dot e d u
Hereford
Arizona Observatory resume
B L G a r y at u m i c h dot e d u
Hereford
Arizona Observatory resume