KIC 8462852 Hereford Arizona Observatory Photometry Observations #4
Bruce Gary, Last updated: 2017.11.14, 19 UT

http://www.brucegary.net/ts5/ is where the next group of KIC846 observations can be found
This web page has become too large, causing slow downloads, and that's why I have begun a new web page for KIC846 observations (starting with 2017.11.13)

_____________________________________________________________________________________________________________________________________ 

Some History for a Transit Geometry Model (not Physical Mechanism Model) for KIC846 Behavior

About three months ago someone e-mailed me a prediction of a brightening after the series of 2017 dips was over, and mentioned late September or October for when this should occur. At the time I didn't understand why he was predicting this, but a few weeks ago we began to collaborate on a joining of my HAO observations with his modeling (he has developed a 2-D transit model for complicated ring systems, comas and dust clouds that appears to be more sophisticated than anything published). I now understand why he was predicting a brightening, and since it is underway we want to "go public" with this prediction.

I want to present an overview of what we know about the brightness behavior of KIC 8462852 (hereafter, KIC846). Two very basic observational facts should be beyond dispute by now:

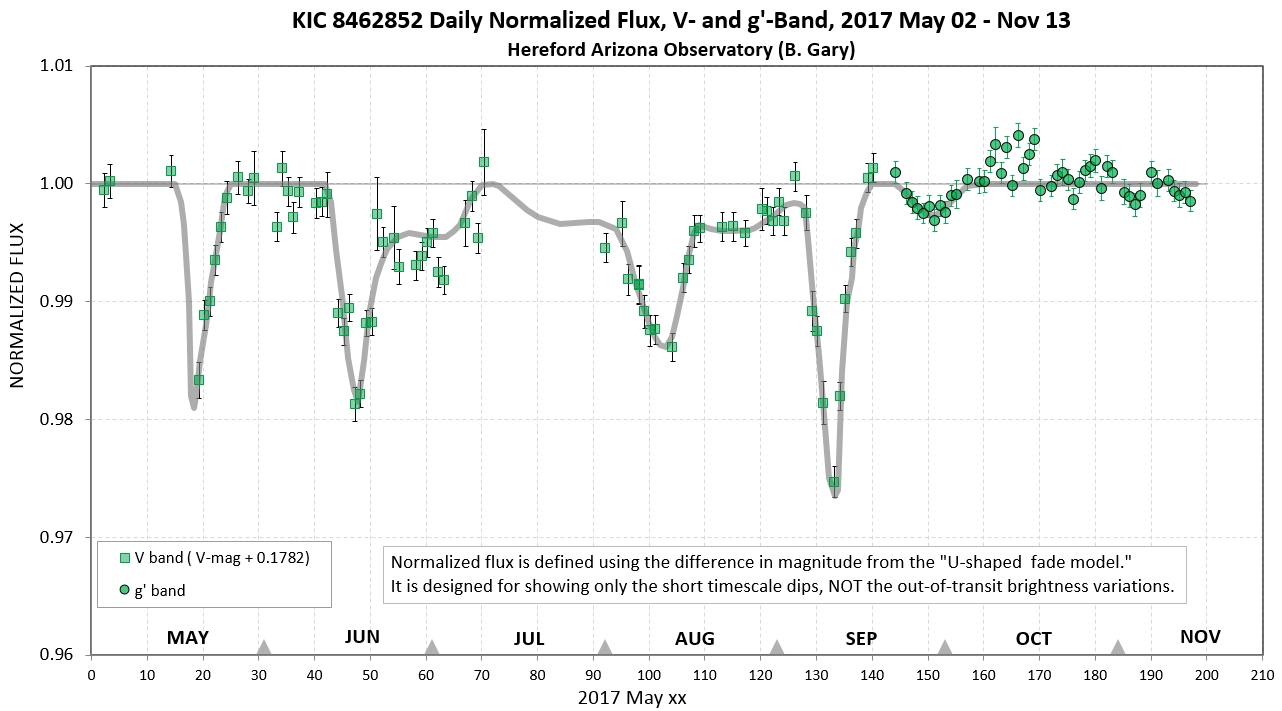
    1) U-shaped fade events of ~ 2 %, lasting about a year, occur at 1600-day intervals, and
    2) Near the end of the U-shaped fade event a half dozen short-term dips occur.

If anyone questions the above two "observational facts" I would like to get an e-mail with the argument (no opinions, please) for disputing them. As one professional astronomer likes to say: "Mysterious objects usually can't be understood until they exhibit periodicity of some sort." Well, the above two "observational facts" provide a periodicity of sorts! I view them as a good "starting place" for developing new understandings, as I present the following (self-evident) surmises:

     3) Something orbits KIC846 with a period of ~ 1600 days (ie., at an average distance of 3.0 AU).
     4) Things orbit the above object, and their dust produces the short-term dips. The object being orbited must be a "massive object."
            Why? Because a set of objects can't be in an identical orbit this close to each other; only the 5 Lagrange regions permit stability in orbits with the same period.
     5) The things that orbit the 1600-day "massive object" have orbits that extend on each side by "an orbit circumference fractional amount" = (400 days / 2)  / 1600 days = ~ 1/16.
            Note: 400 days is the length of the "1-year fade feature" (which is actually closer to 1.2 years).
     6) Assuming the objects that orbit the "massive object" are within the massive object's Hill sphere, the massive object must have a mass of  > 14 × M_Jupiter.
            Note: Anything more massive than ~ 13 × M_Jupiter is a candidate for being a brown dwarf (BD); hereafter I'll refer to the "massive object" as a BD.
     7) The dips are produced by dust (that could be configured as a tail, a coma or a ring system) that originates from moon-size objects orbiting either the BD or planets that orbit the BD.
           Why? Because the "gravity well" for the BD, or any orbiting planets, will be too deep! Comets produce dust tails because their gravity wells are shallow.

Again, if anyone questions the above 5 points, I would like to hear from you with your argument (no opinions, please).

Let's review some of the photometric evidence for everything that forces us to the Fact#1 and Fact #2 starting points. (A fuller development of all of the above will be treated in a manuscript, in preparation, that I'm working on with two other authors - one of whom is the person who e-mailed me 2 or 3 months ago predicting a brightening in September or October). By the way, if anyone is aware of a professional astronomer predicting a brightening (and making that prediction before it began) I would really appreciate hearing about that.

Figure 1.1 shows how my collaborators view what the Kepler light curve would have looked like if Kepler observations had continued beyond Kepler day 1590. Let's refer to the 2 % fade (starting at "B" in Fig. 1.1 and ending at "D") as a "long-term drop fade," or "drop" for short. We suggest that the beginning of the "drop" repeated ~ 11 months ago (2016.11.08). Similarly, we suspect that the group of dips ("C" in Fig. 1.1) repeated this year, during May to August. If so, then a brightening should follow this year's group of dips, and it could start at at time now.


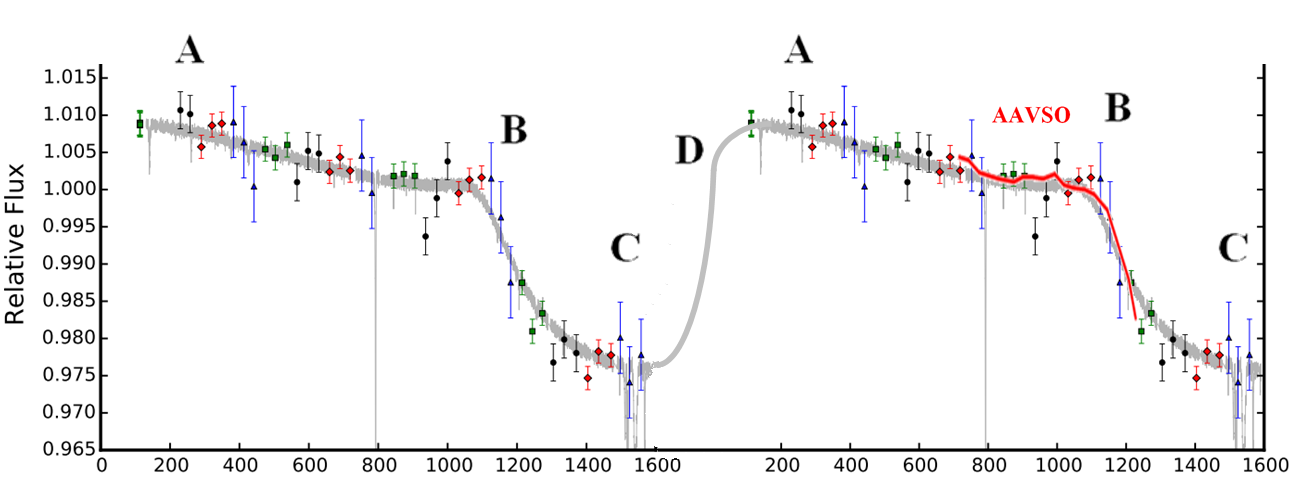
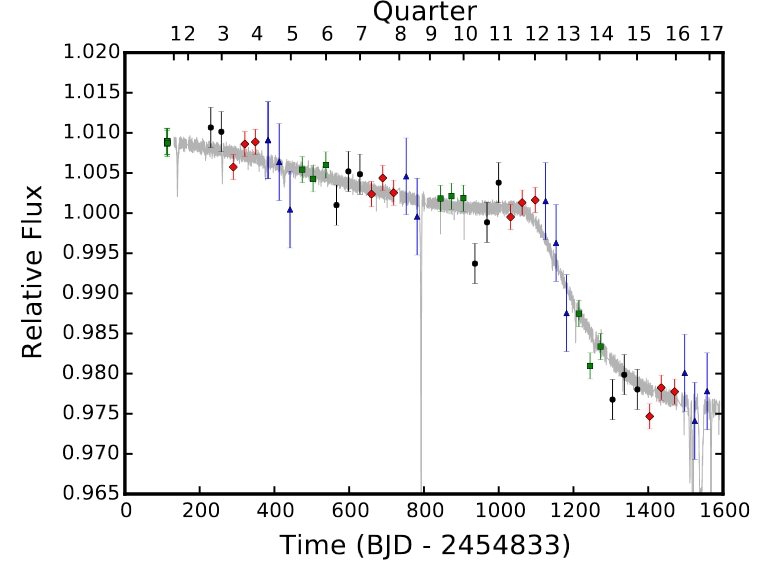
Figure 1.1. Kepler observations, as re-processed and published by Montet and Simon (2016). We have repeated the Kepler data (1580 days worth) with a repeat interval of 1800 days in order to illustrate what might have been observed if Kepler had been able to continue observing KIC846. AAVSO data in the second "B" region agree with the shape of the repeated Kepler "drop" fade. (We prefer a repeat interval of 1600 days, but the details of this are still being worked out.) The letters denote locations of the brown dwarf in its orbit, shown in the next figure.

The interval between the median activity level of Kepler short-term dips and this years dip activity is 1584 ± 44 days (as I described a few days ago on this web page). My collaborator (he is "shy" and he doesn't want me to use his name until receiving a positive review of his work) has developed a model for simulating the transit of complicated ring structures (many rings, each with their own opacity), comas and dust clouds. He has applied this model to a configuration consisting of a brown dwarf (BD) in a 1600-day eccentric orbit. The BD has a ring system, and in addition at least 3 planets (with moons) in orbit about it (within the BD's Hill sphere). Every time the BD and its planets orbit close to KIC846 (periapsis is shortly after "C" in Fig. 1.1), volatiles and dust are released, just like what happens to comets in our solar system (note: this idea is consistent with the KIC846'"snow line"). The BD planets have moons, and they are the source for the release of volatiles and dust (note: the moons have a lower escape speed than the planets they orbit, so volatile-driven dust is able to escape the moons but not the planets). 

Figure 1.2 is the eccentric 1600-day orbit that my colleague has developed to account for these events (as well as others), to be described in a forthcoming paper. It's my view that the BD has a planet and ring system that is the source for dust that escapes the BD Hill sphere to produce a dust cloud that is responsible for the 1 or 2 % fade every 1600-day orbit. The cloud is kept from continually expanding due to light pressure from KIC846. This implies that dust production is continuous. The "drop" events last ~ 1 year, and they are followed by a brightening due to a clean line-of-sight to the star following passage (in addition, there's a component of brightening due to a change in geometry of starlight illumination of the dust cloud and rings).


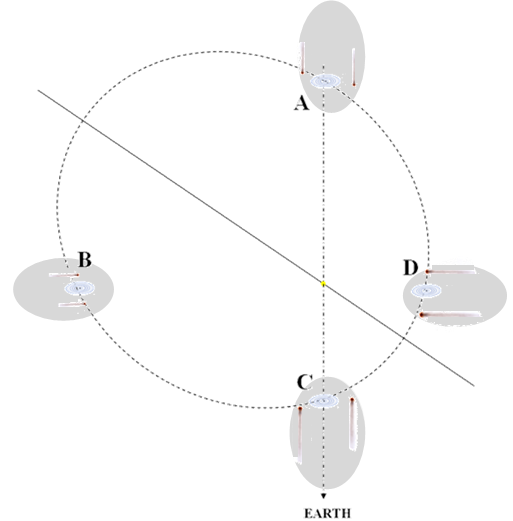
Figure 1.2. Brown dwarf eccentric 1600-day orbit that my colleague has developed to account for the U-shaped "fade" and short-term dips. The BD has a ring system, as well as a couple planets with moons that are subject to the release of volatile molecules and dust (similar to comets) when they are close to periastron (which is now). The dust cloud is just one speculation that might account for the U-shaped "fade" at 1600-day intervals. Another model for the U-shaped fade is being evaluated, which relies upon changes in geometry of reflected light off large particles. The increasing orbital speed may be a factor in producing the ingress/egress asymmetry of the U-shape.   

The next figure shows Kepler data (re-analyzed by Montet & Simon, 2016) and HAO measurements of g'-band (and V-band, converted to g'-band) for a 9-year interval. The model trace is a crude representation of an asymmetric U-shaped "fade" with a shape this is approximately compatible with the Kepler observations (assuming their overall pattern repeats every 1600 days). The trace is just a mathematical model; a physical model is now under development for inclusion in a forthcoming paper.  


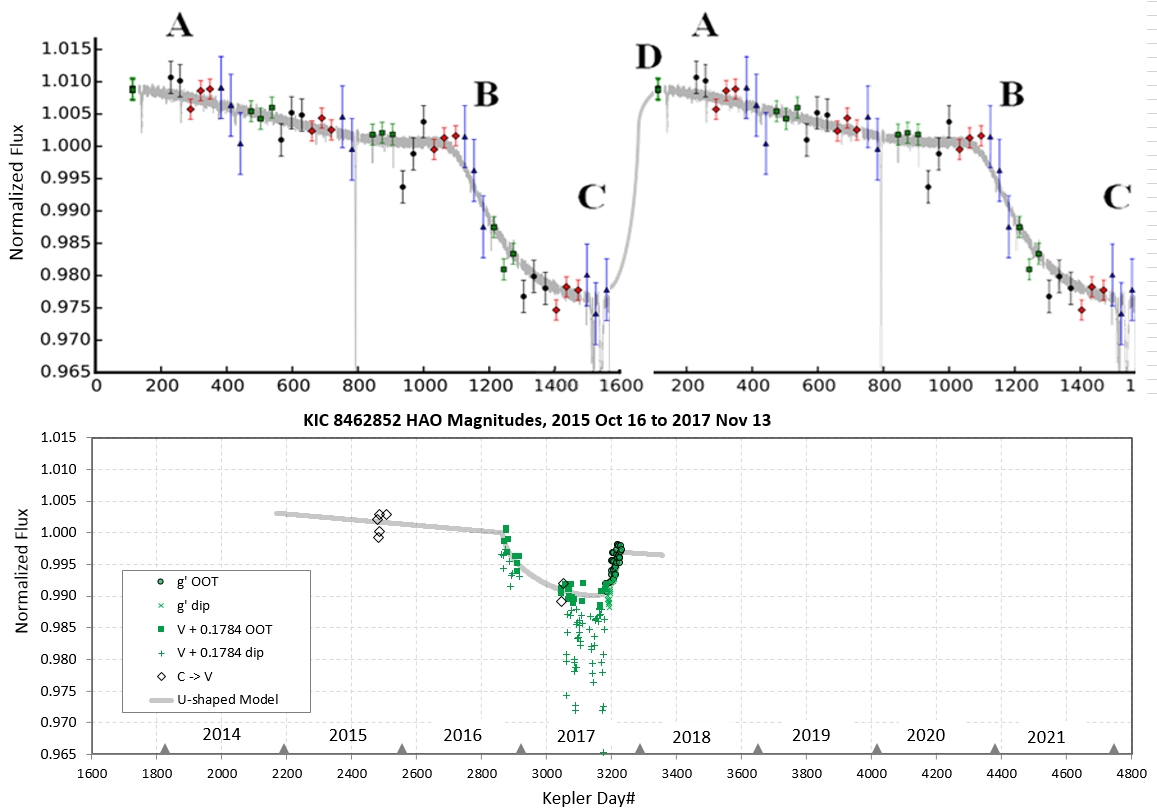
Figure 1.3. Kepler data (upper panel, as re-analyzed by Montet & Simon, 2016) and HAO data vs. Kepler Day# (lower panel). A model for long-term normalized flux that is inspired by the Kepler data has been created to fit the HAO data. The U-shaped "fade" that fits HAO data appears 1600 days later than the U-shaped fade feature that fits Kepler data. The model also includes a linear trend between the U-shaped fades (1600 days apart). The U-shape is asymmetric, meaning that ingress occurs slowly and egress occurs rapidly (with "cosine((t-to)/tau)^0.4" shapes for each half). The current U-shaped fade has a minimum brightness on 2017.07.06; ingress is at 2016.11.08 and egress is at 2017.11.09. The OOT brightness is now approximately half way to a full recovery, according to this mathematical model.

In Fig. 1.3 notice that whereas the shape of this year's U-shaped fade is the same as the U-shaped fade that we claim represents Kepler data, the depth and length differ. According to my simple model fit to the current long-term "drop" fade, its length will be ~ 1.0 years, from ingress to egress. The previous event, observed by Kepler, lasted at least 1.4 years (observations ended before egress, so we can only speculate on the length of the U-shaped fade). Another difference is depth: the current event has a depth of 1.0 % (from ingress to mid), whereas the Kepler depth was ~ 2.4 %.

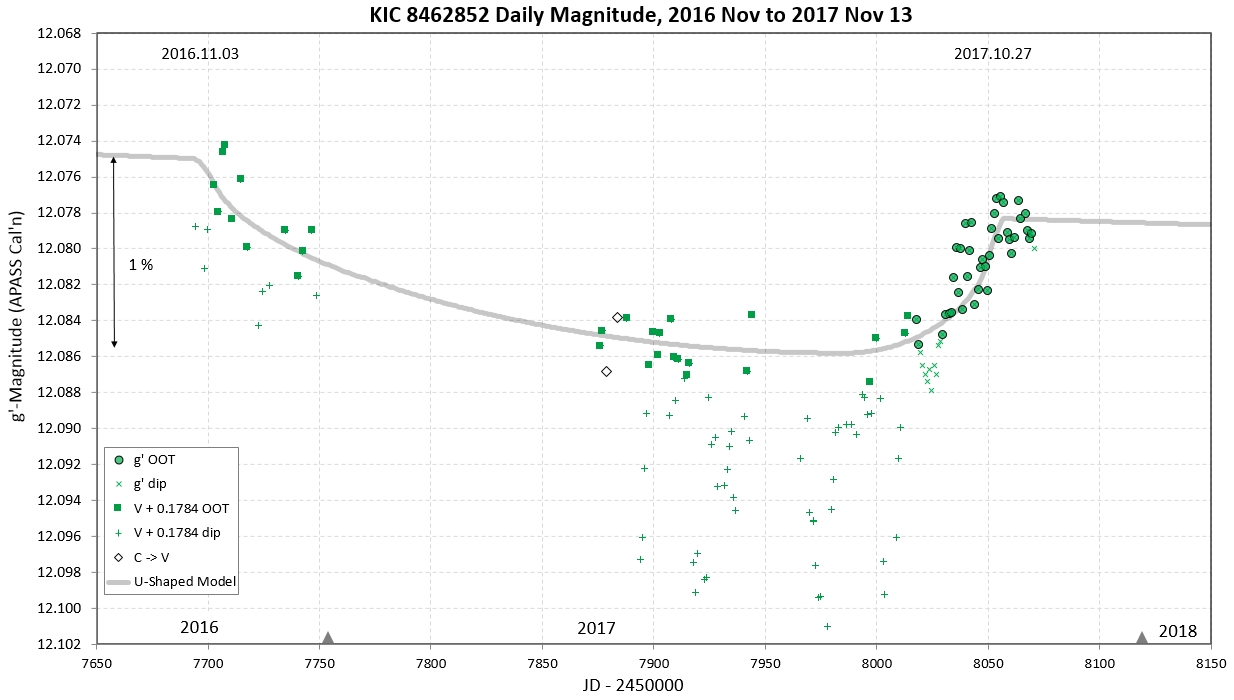
Here's a "zoom" of the lower panel of the previous figure.


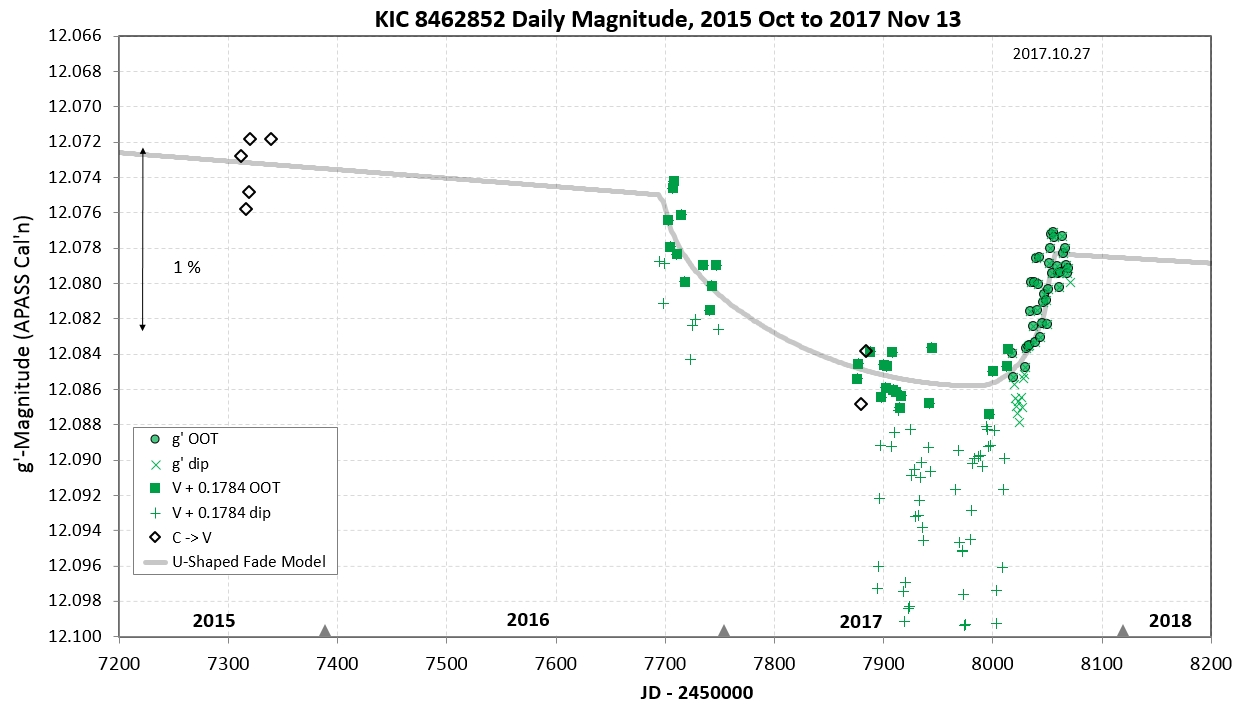
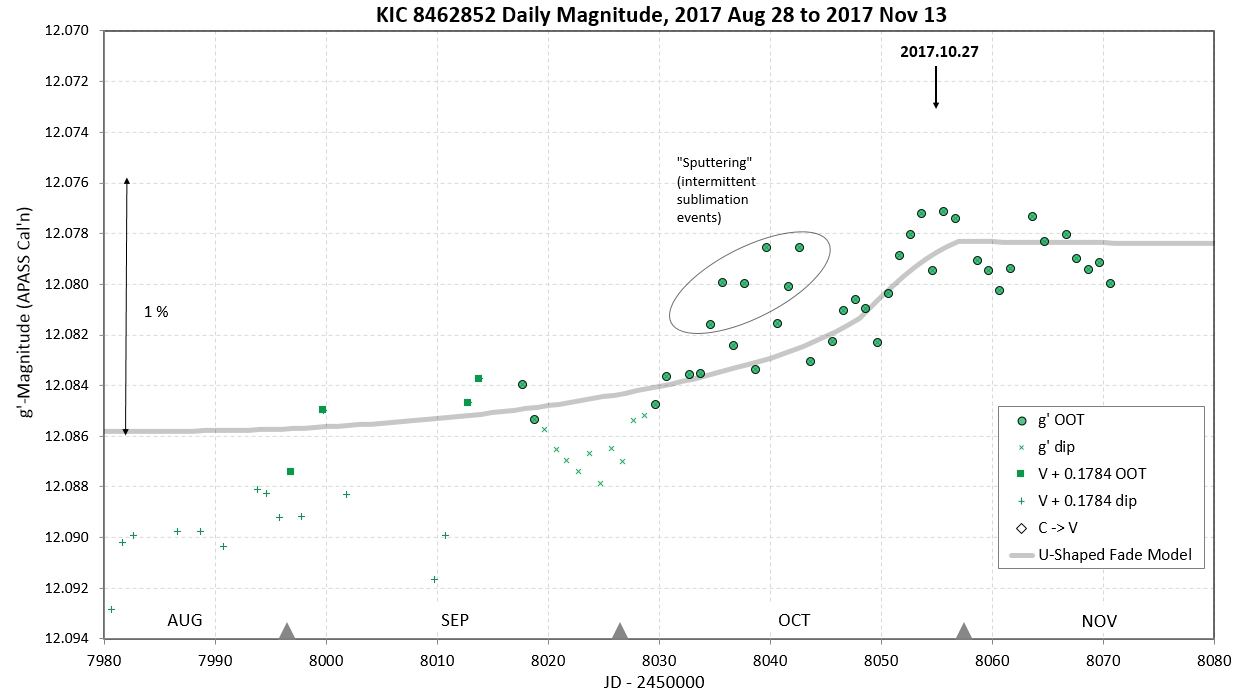
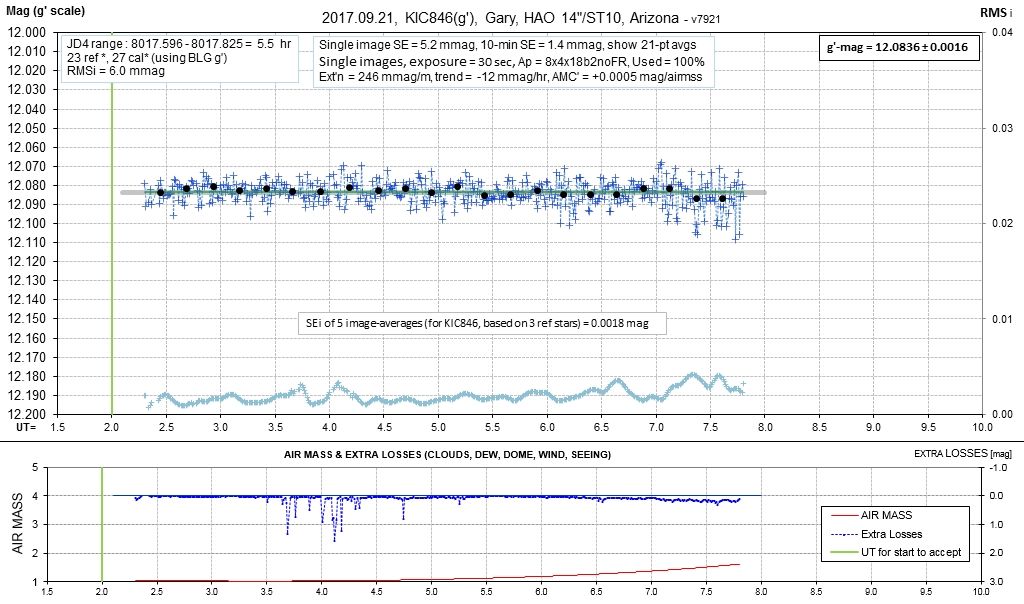
Figure 1.4. HAO  g'-magnitude (and V-mag's converted to g'-mag scale) for the last 1000-day.

We have a draft of a paper that is undergoing "informal" review by a couple experts in the field, and if they endorse submission for publication (subject to the usual suggested changes) we will submit the paper to MNRAS (we can't afford any journal with page charges). If that journal eventually accepts the paper for publication, after many months of reviewer negotiations, it will appear in the journal sometime next year and at arXiv sometime this year. If MNRAS rejects the paper then it will appear at this web site sometime in November.
____________________________________________________________________________________________________________________________________________________________________


Figure 2. Light curve of normalized flux  for "May to now" for HAO V-band and g'-band observations. "Normalized" means that magnitudes have been compared with a long-term model for magnitude vs. date, and since the model I employ includes a U-shaped "fade" feature, with a fast brightening occurring at the present time, any datum that is close to the "1.00 line" is simply confirming that the short-term dips are over and the long-term changes in brightness are continuing to obey the model. The slight rise of recent measurements above the 1.00 line merely means that my U-shaped model is slightly under-estimating the fast rise in brightness now underway. The purpose for this graph is to show the presence and behavior of the short-term dips, not any long-term changes in brightness! (I know this may be a difficult concept to grasp, but try!)

Note: g'-band and r'-band dip depths (and shapes) may differ, with g'-band being more sensitive to dust cloud scattering due to its shorter wavelength (0.47 vs. 0.62 micron). For a reasonable particle size distribution (e.g., Hanson, 0.2 micron) the extinction cross section ratio would produce a depth at r'-band that is 0.57 x depth at g'-band. If g'-band depth is 0.3 %, for example, depth at r'-band could be 0.17 %. The "Tabby Team" measurements (Fig. 4) at r'-band are compatible with that small dip depth. Incidentally, none of these shapes resemble exo-comet tail transits (as described by Rappaport et al, 2017 link); so the mystery of what's producing these week-timescale dips continues! Actually, long oval shapes are known to produce V-shaped dips (think of rings with a high inclination).


Figure 3.  Expansion of previous light curve, showing normalized flux for dates starting with 2017 August.
The g'-band measurements exhibit a smaller scatter than the V-band measurements. (Repeat of above note: measurements of normalized flux near 1.00 simply mean that my OOT model continues to be valid, which includes a fast brightening at this time). The data in the oval is probably real, and records activity that we'll describe in paper#2. 

Apparently the light curves that appear at reddit are not officially in the public domain, so I am discontinuing posting them at this web page.

Tabby's Star undergoes variations on many timescales. The ASAS and ASAS-SN V-band observations reported by Simon et al. (2017) illustrate the presence of multi-year and multi-month variations. Also, the Kepler data, plus recent ground-based data, show multi-day variations (dips). If one category of variation is to be studied in isolation of the others some method must be devised for modeling the longer-timescale variations in order to remove them for the study of the shorter ones. For example, for the study of multi-day dips it is necessary to model the multi-month variation (underway at the time of the short-timescale variations to be studied). This process is inherently subjective, both in the timescale to be represented by the model and the model chosen for that purpose. I claim that doing something imperfectly, because it's subjective, is better than doing nothing when something should be done (in order to avoid being accused of doing something subjective - which really scares professional astronomers).

Significance of Interval Between Kepler Major Dip Activity and 2017 Dip Activity

The major episode of Kepler mission dip activity
(the first dip greater than 1 % associated with the main group of dips) occurred on JD = 2456344. My estimate of the centroid of activity is JD = 2456370 ± 30. Kepler observations ended before this episode ended so we may consider use of both dates when determining the interval between Kepler dip activity and 2017 dip activity.  The 2017 episode began on JD = 2457893 (May 20), and my estimate of a centroid of activity is JD = 2457954 ± 30. The difference between the Kepler and 2017 dates is 1549 days (using onset dates) and 1584 ± 44 (using centroids of activity). Let's round-up to 1600 days, and adopt it as a tentative interval between repeating dip activity for KIC846.

Let's recall the careful re-analysis of Kepler mission data for KIC846 by Montet & Simon (2016), showing a gradual fade rate followed by an abrupt fade, near the end of which is the main group of dip activity.


Figure 6. Kepler data (Montet & Simon, 2016) 1600-day light curve. Fade rate is 0.34 %/year up to Kepler day 1100, after which there is a rapid decline of ~ 2.4 %. Note the onset of the main group of dips near the end, at ~ Kepler day 1537 (JD 2456370). 

The following graph shows my measurements of KIC846 during the past two years. The first set of observations, in 2015, were unfiltered (C-band). In late 2016 I switched to V-band. In early 2017 I made two unfiltered measurements for the purpose of estimating an offset for adjusting C-band mag's to V-band. On 2017 Sep 21 I switched from V-band to g'-band (for reasons described in another section of this web page). Since this switch-over occurred when KIC846 was in OOT state it was possible to convert all previous observations to a g'-mag equivalent. In the following 1600-day light curve I attempted to distinguish between OOT and dip state. The OOT measurements are fitted with a model that is inspired by the Montet and Simon (2016) analysis.


Figure 7a.  Magnitude vs. date for a 1000-day interval showing long-term variation model used for converting g'-band mag's to normalized flux. The model consists of two components, a linear fade from the end of one drop event to the start of the next drop, and a "cosine^0.5" shape with different timescales for ingress and egress. Notice the rising OOT level currently underway!

The OOT model has no physical basis; it is merely a simple mathematical construction that does two things: 1) it fits the OOT data, and 2) it resembles the Montet & Simon (2016) Kepler light curve (in the sense of having a slow decline followed by an abrupt fade during which dip activity occurs). Eventually, a physics-based model for OOT will have to be derived (I'm working with someone on this), and when a physics-based model is derived I expect it to resemble the model in Fig. 7. 

I suggest thinking about the "drop" feature as caused by a cloud
of dust that is obscuring star light (that has escaped the Hill spheres of several objects in orbit around a big planet, or BD, in a 1600-day orbit). The small fade before the "drop" feature start may correspond to the Kepler 0.34 %/year fade region that preceded the Kepler 2.4 % drop. The current 1.0 % "drop" may be analogous to the Kepler 2.4 % drop. Yes, I'm suggesting that the two drop depths differ, which could simply mean that the optical depth of this broad dust cloud, or its inclination (impact parameter), varies with time.


Figure 7b.  An expanded version of the previous figure, showing magnitude vs. date for a 10-month interval (500 days) that includes a brightening, or recovery, from the 2017 "Drop Fade" event. Recovery is shown to be complete (using this purely mathematical, not physical model) at the end of October.

The next figure shows g'-mag for a 100-day interval, during the recovery (egress).


Figure 8.  Magnitude vs. date for the 2017 100-day interval of U-Shaped Fade recovery (egress). One might make the argument that the g'-band measurements have become noisier as the "edge" of the large obscuring dust cloud, the one producing the long-term "drop" of  flux, crosses our line-of-sight; of course.  


Figure 9.  COuld there be a 11-day perodicity during the past 24 days?

Links on this & other web pages


Significance of Interval Between Kepler & 2017 Dip Activity
   
List of observing sessions
   
Why I switched from V- to g'-band  
    Comment on overall dip pattern  
    Finder image showing new set of reference stars
    References    

    Go back to 3rd of four web pages    (for dates 2014.08.29 to 2017.09.20)
    Go back to 2nd of four web pages   (for dates 2014.05.02 to 2017.08.28)
    Go back to 1st of four web pages    (for dates 2017.06.18 to 2017.06.17)
    Reference Star Quality Assessment  (the 10 best stars out of 25 evaluated)  

This is the fourth web pages devoted to my observations of Tabby's Star. When a web page has many images the download times is long, so this is the latest "split."

List of Observations (for all earlier observations, before Aug 29, go to link)

2017.11.13 g'  
2017.11.12 g'  
2017.11.11 g'  
2017.11.10 g'  
2017.11.09 g'  
2017.11.07 g'  
2017.11.06 g'  
2017.11.04 g'  
2017.11.03 g'  
2017.11.02 g'  
2017.11.01 g' 
2017.20.30 g'  
2017.10.29 g'  
2017.10.28 g'  
2017.10.27 g'  
2017.10.26 g'  
2017.10.25 g'  
2017.10.24 g'  
2017.10.23 g'  
2017.10.22 g'  
2017.10.21 g' 
2017.10.20 g'  
2017.10.19 g'  
2017.10.17 g'  
2017.10.16 g'  
2017.10.15 g'  
2017.10.14 g'  
2017.10.13 g'  
2017.10.12 g'  
2017.10.11 g'  
2017.10.10 g'  
2017.10.09 g'  
2017.10.08 g'  
2017.10.07 g'  
2017.10.06 g'  
2017.10.04 g'  
2017.10.03 g'  
2017.10.02 g'  
2017.10.01 g'  
2017.09.30 g'  
2017.09.29 g'  
2017.09.28 g'  
2017.09.27 g'  
2017.09.26 g'  
2017.09.25 g'  
2017.09.24 g'  
2017.09.23 g'  
2017.09.22 g'
2017.09.21 g'   

Daily Observing Session Information (most recent at top)

2017.11.13, g'-band, 2.8 hrs (so far)


2017.11.12, g'-band, 4.1 hrs  DataExchangeFile  


2017.11.11, g'-band, 3.4 hrs  DataExchangeFile  


2017.11.10, g'-band, 3.8 hrs   DataExchangfile  


2017.11.09, g'-band, 4.1 useful hrs   DataExchangeFile  


2017.11.07, g'-band, 2.3 hrs   DataExchangeFile  


2017.11.06, g'-band, 1.8 hrs so far


2017.11.04, g'-band, 1.3 hrs DataExchangeFile  

Clouds were everywhere, so I observed through "holes."


2017.11.03, g'-band, 2.4 hrs so far


2017.11.02, g'-band, 2.5 hrs   DataExchangeFile 

Winds forced an abort, but I got 2.5 hrs of good data before that.


2017.11.01, g'-band, 3.5 hrs total, but only ~ 0.5 hrs of good data


2017.10.31 Rained!

2017.10.30, g'-band, 4.4 hrs  DataExchangeFile   


2017.10.29, g'-band, 3.5 useful hrs   DataExchangeFile   


2017.10.28, g'-band, 3.9 hrs  DataExchangeFile  


2017.10.27, g'-band, 2.8 hrs   DataExchangeFile  


2017.10.26, g'-band, 4.5 hrs   DataExchangeFile  


2017.10.25, g'-band, 4.8 useable hrs  DataExchangeFile  


2017.10.24, g'-band, 5.6 hrs   DataExchangefile  


2017.10.23, g'-band, 3.6 useable hrs   DataExchangeFile  


2017.10.22, g'-band, 3.0 hrs  DataExchangeFile  


2017.10.21, g'-band, 4.7 hrs  DataExchangeFile 


2017.10.20, g'-band, 2.3 hrs DataExchangeFile  


2017.10.19, g'-band, 3.1 hrs


2017.10.17, g'-band, 1.7 useful hrs DataExchangeFile 


2017.10.16, g'-band,


2017.10.15, g'-band, 5.0 hrs   DataExchangeFile  


2017.10.14, g'-band, x hrs DataExchangeFile  

Cloud patches, but I was able to observe through holes.


2017.10.13, g'-band, 3.4 hrs, DataExchangeFile  


Clouds produced the gap.


2017.10.12, g'-band, 4.0 hrs, DataExchangeFile   
(Using 18 stable ref stars for calibration)


2017.10.11, g'-band, 4.4 hrs, DataExchangeFile   (Using 18 stable ref stars for calibration) 


2017.10.10, g'-band,  4.5 hrs (useful), DataExchangeFile   (using 19 stable ref stars for calibration)


2017.10.09, g'-band, 2.4 hrs, DataExchangeFile  
(using 19 stable ref stars for calibration)  


2017.10.08, g'-band, 4.7 hrs   DataExchangeFile 
(using 19 stable ref stars for calibration)


2017.10.07, g'-band, DataExchangeFile  
(using 19 stable ref stars for calibration)

For some reason, that I'm still trying to figure out, measurement quality begins to suffer after ~ 10:30 PM, local. That's when PSF begins to bloat.


2017.10.06, g'-band, 3.9 hrs (useful)  DataExchangeFile  
(using 19 stable ref stars for calibration)


2017.10.04, g'-band, 2.8 hrs   DataExchangeFile  
(using 19 stable ref stars for calibration)


2017.10.03, g'-band, 3.9 hrs, DataExchangeFile  
(using 19 stable ref stars for calibration)


2017.10.02, g'-band, 3.1 hrs, DataExchangeFile  
(using 19 stable ref stars for calibration)
 
"Atmospheric seeing" was quite bad due to surface winds, so this data may have an additional component of systematic uncertainty.


2017.10.01, g'-band, 6.5 hrs, DataExchangeFile  
(using 19 stable ref stars for calibration)


2017.09.30, g'-band, 4.3 hrs, DataExchangeFile  (Using 19 stable ref stars for calibration) 


2017.09.29, g'-band, 4.4 hrs, DataExchangeFile 
(Using 19 stable ref stars for calibration)


2017.09.28, g'-band, 3.9 hrs, DataExchangeFile  


2017.09.27, g'-band, 4.1 hrs, DataExchangeFile  


2017.09.26, g'-band, 4.8 hrs, DataExchangeFile   


 2017.09.25, g'-band, 4.4 hrs, DataExchangeFile   


 2017.09.24, g'-band, 5.0 hrs, DataExchangeFile     


2017.09.23, g-band, 3.6 hrs, DataExchangeFile  


2017.09.22, g'-band, 1.4 hrs, DataExchangeFile  


2017.09.21, g'-band, 5.5 hrs, DataExchangeFile  


Why I Switched from V- to g'-band 

There are three reasons I expect my g'-band observations to be better quality than my previous V-band observations: 1) I've adopted a fixed set of photometry apertures after determining that in a crowded star field (like KIC846) the use of variable (or dynamic) photometry signal aperture radius produces systematic artifacts. This is caused by the PSF of stars near the reference star encroaching into the signal aperture of the reference star (in fact, whereas using a dynamic signal aperture size that broadens when PSF becomes larger the opposite behavior should be employed for minimizing these systematics; e.g., signal aperture size should instead become smaller when PSF increases). 2) the g'-band passband is "cleaner" than the V-band passband; g'-band doesn't have "wings" because the transmission function is rectangular-shaped instead of Gaussian-shaped (as exists for V-band); g'-band measurements are therefore less influenced by star-specific SED structure (e.g., short of 400 nm) and also less influenced by star color. 3) The g'-band has a higher "through-put" so more photons are available, providing a higher SNR.

Another reason for switching to g'-band is that g'-mags compared with with r'-mags are scientifically more useful because the effective wavelength of g'-band is less than V-band (460 nm vs. 540 nm); g'-band is between B- and V-band. In other words, the wavelength difference between g' and r' is greater than that for V and r'. This is useful when dust cloud scattering is occurring because g'-band should exhibit deeper dip depths than at V-band, so the ratio of r' depth to g' depth should differ from 1.0 more than the ratio of r' depth to V depth.

I expect that there should be lower systematic errors for my new use of g'-band than my old procedures that used V-band. So far, this is borne out by measurement, where my g'-band measurements exhibit a day-to-day scatter of < 1 ppt.


Figure 2.1. Filter passbands for the classical BVRcIc and SDSS g'r'i'z' bands. 


Figure 2.2 The g'-mag's, derived using new processing procedures. Prior to Oct 09 (x = 162), internal-scatter (precision) exhibited an RMS of ~ 0.6 mmag ( 0.6 ppt, or 600 ppm). Since then the RMS appears to become erratic. Are the variations real? Is there really a 10.9-day sinusoidal variation lately? It's tempting to speculate that these variation are real, and associated with spatial structure at the edge of the dust cloud that produces the long-timescale "U-Shaped" fade.


General Comment on Overall Dip Pattern

Reviewing the Kepler LC and the 2017 ground-based LCs, it's my impression that KIF846 exhibits an overall pattern of an "episode" of dips at intervals of ~ 4.4 years. An episode consists of ~ 7 to 10 dips during 4 or 5 months (based on the 2017 observations). Kepler observations of KIC846 ended during a dip episode, and this may account for the shorter (2-month) Kepler episode. In addition, the Kepler LC has one deep dip (16 %) half way between dip episodes (assuming a 4.4-year interval between episodes).

This pattern suggests
the presence of a cluster of dust cloud sources, in orbit about something massive enough for them to be within the Hill sphere, all of which orbit with a 4.4-year period (average distance of 3.0 AU). The radius of the cluster is ~ 4.5 % of the orbit circumference (2.5 months / 4.4 years). This means the Hill sphere radius Rh = 0.42 AU (0.045
× pi × 3.0 AU). To have a Hill sphere this large requires an object with a mass, M_obj, at least 0.0082 × M_star. Assuming M_star = 1.43 × M_sun, M_obj > 12 × M_Jupiter. This is at the lower boundary for brown dwarf masses. This object must be either a very massive planet or a small brown dwarf. Let's refer to it as a brown dwarf (BD) since our mass derivation was a lower limit. The BD may have a half dozen planets in orbit based on the number of transits during the 2017 observations. There could be fewer planets, because a planet with an orbit radius = 0.25 × Rh, for example, would have a period of < 117 days. Such a planet could produce two dips per 5-month "episode." Planets in smaller orbits could produce even more dips per "episode." (By the way, celestial mechanics essentially forbids a set of objects to be in identical orbits at orbit phases within a 4.5 % of each other for more than a few orbits, because such a configuration is not stable. Small perturbations, such as the gravitational attraction of the bodies for each other, would quickly modify their orbits. The only way to have several dust-sources remain this close to each other in orbit phase is for them to be orbiting something massive enough that its Hill sphere includes their orbits. Tha's what I described above.)

None of the above addresses the matter of dust cloud shape (e.g., rings, tails, coma, etc), or production mechanism (sublimation, collisions, etc), or how orbits evolved to such a state. Those are difficult problems. What I have presented is merely an obvious starting point for such modeling based on the overall pattern of dips already observed.

Finder Chart

It has taken over a year to figure out which stars are reliably stable. I now use the following 19 stars for reference (the star numbers differ from previous finder charts). 


Finder image, FOV = 15 x 10 'arc, north-east at upper-left, showing the 34 stars that have been evaluated for use in calibration (based on variability and trend). 19 stars have been adopted (circled) and 15 stars have been rejected (crosses).

I have evaluated stability of 34 stars near KIC846, and have accepted 19 for calibration use and have rejected 15. My acceptance criterion is based on RMS of daily averages, and also trend, during several months of data. My use of the 19 accepted stars began with observing date 2017.09.07. Some star behavior is described at link. The numbering is a ranking of stability; i.e, star #1 is the most stable and star#19 is the least stable among those accepted for use (the stars with crosses are either worse or exhibit a trend). I will eventually create a another web page summarizing behavior of all 34 stars. 

My Collaboration Policy

At my age of 78 I'm entitled to have fun and avoid work. Observing and figuring things out is fun. Writing papers is work. Besides, most people really don't care about what others have done. (For example, Google "WD 1145+017" and among the several pages of lame links none point to my web pages.)

My light curve observations are "in the public domain." This means anyone can and may download of all LC observations, and use or misuse any of that data for whatever purpose. If my data is essential to any publication just mention this in the acknowledgement section (I'm not interested in co-authorship).

Any researcher who wants to "collaborate" with me during the planning or conduct of observations (such as spectroscopic, or multi-wavelength photometry, or high precision/short timescale photometry) can do so without my sharing information about this collaboration with anyone else. I will not share information about any such collaboration with anyone.
 
References

    Neslusan, L. and J. & Budaj, 2016, "Mysterious Eclipses in the Light Curve of KIC8462852: a Possible Explanation, arXiv: 1612.06121v2  (a "tour de force"; I highly recommend this publication)
    Neslusan & Budaj web site with animation of their way of explaining Kepler D1540 dip:   http://www.astro.sk/~budaj/kic8462.html
    Wyatt, W. C., R. van Lieshout, G. M. Kennedy, T. S. Boyajian, "Modeling the KIC8462852 light curves: compatibiity of the dips and secular dimming with an exocomet interpretation," submitted to MNRAS, arXiv  
    Hippke, Michael and Daniel Angerhausen, "The year-long flux variations in Boyajian's star are asymmetric or aperiodic," submitted to ApJL, arXiv 
    Sacco, G., L. Ngo and J. Modolo, "A 1574-day Periodicity of Transits Orbiting KIC 8462852," arXiv
    Rappaport, S., B. L. Gary, A. Vanerdurg, S. Xu, D. Pooley and K. Mukai, "WD 1145+017: Optical Activity During 2016-2017 and Limits on the X-Ray Flux," arXiv, Mon. Not. Royal Astron. Soc.
    Steele, I. A. & 4 others, 2017, "Optical Polarimetry of KIC 8462852 in May-August 2017,"MNRAS (accepted), arXiv.
    Simon, Joshua D., Benjamen J. Shappee and 6 others, "Where is the Flux Going? The Long-Term Photometric Variability of Boyajian's Star," arXiv:1708.07822 
    Meng, Huan Y. A., G. Rieke and 12 others (including Boyajian), "Extinction and the Dimming of KIC 8462852," arXiv: 1708.07556  
    Sucerquita, M., Alvarado-Montes, J.A. and two others, "Anomalous Lightcurves of Young Tilted Exorings," arXiv: 1708.04600   Also: New Scientist link and Universe Today link.
    Rappaport, S., A. Vanderburg and 9 others, "Likely Transiting Exocomets Detected by Kepler," arXiv: 1708.06069 
    Montet, Benjamin T. and Joshua D. Simon, 2016, arXiv 
    Boyajian et al, 2015, MNRAS, "Planet Hunters X. KIC 8462852 - Where's the flux?" link
    Ballesteros, F. J., P. Arnalte-Mur, A. Fernandez-Soto and V. J. Martinez, 2017, "KIC8462852: Will the Trojans Return in 2011?", arXiv
    Washington Post article, 2015.10.15: link
    AAVSO Campaign Notice requesting KIC646 observations
    AAVSO LC Generator https://www.aavso.org/data/lcg (enter KIC 8462852)
    Web page tutorial: Tips for amateurs observating faint asteroids (useful for any photometry observing)
    Book: Exoplanet Observing for Amateurs, Gary (2014): link (useful for any photometry observing) 
    wikipedia description of Tabby's Star  
    My web pages master list, resume


    B L G a r y at u m i c h dot e d u    Hereford Arizona Observatory    resume 
 
This site opened: 
2017.09.28. 
Nothing on this web page is copyrighted.