6. White Dwarf WD 1145+017 Photometric Monitoring Observations by Amateur Observers B. Gary & T. Kaye
B. L. Gary, this is the 6th of 6 web pages. Last updated 2020.01.20 05 UT
1
of 7 - 2015.11.01 to 2016.01.21: LC
Observations - 1st set of LCs, for 2015/16 observing
season
2 of 7 - 2016.01.17 to 2016.07.13: LC Observations - 2nd set of LCs, for 2015/16 observing season
3 of 7 - 2015.11.01 to 2016.07.13: LC Observations - 3rd set of LCs, for 2015/16 observing season (N = 158) + Overview, Results & Model Speculations
4 of 7 - 2016.10.25 to 2017.06.18: LC Observations - 4th set of LCs, for 2016/17 observing season
5 of 7 - 2017.10.23 to 2018.06.18: LC Observations - 5th set of LCs, for 2017/18 observing season
6 of 7 - 2018.11.06 to 2018.07.09 LC Observations - 6th set of LCs, for 2018/19 observing season (YOU ARE HERE)
Previous 4 observing seasons: Observational findings that need to be explained by models
7 of 7 - 2019.12.02 to present LC Observations - 7th set of LCs, for 2019/20 observing season
Links on this web page:
Status & Summary of Results for this Observing Season
Observing session LCs
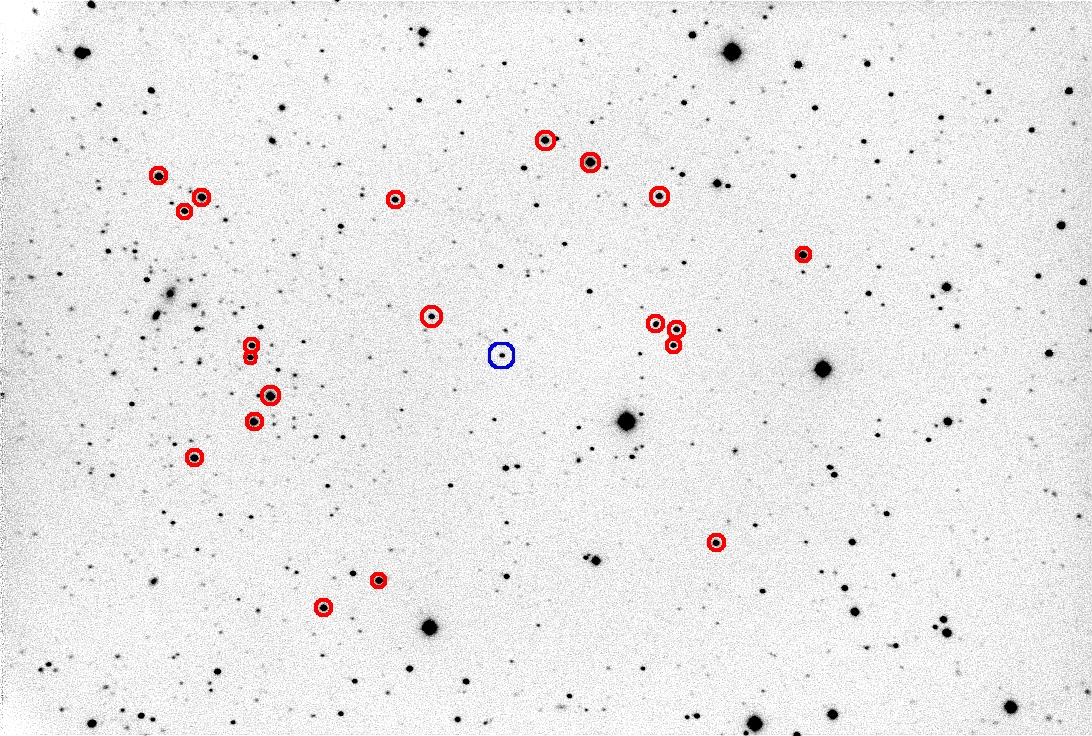
Finder image & basic info
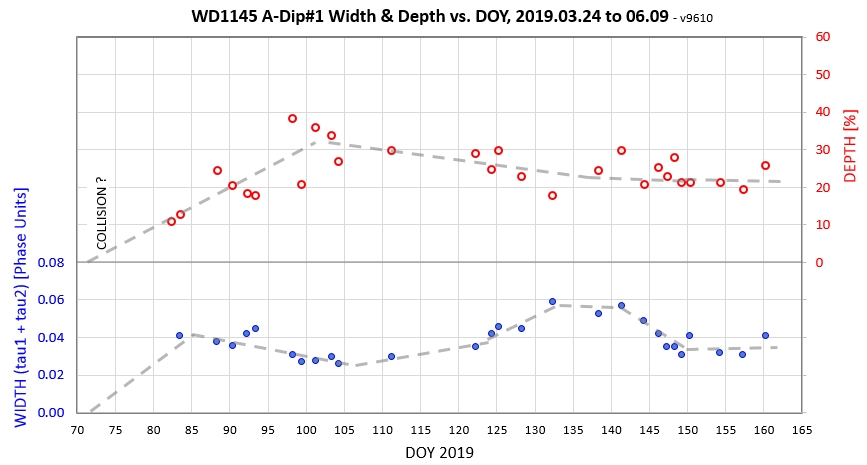
Miscellaneous analysis and speculation
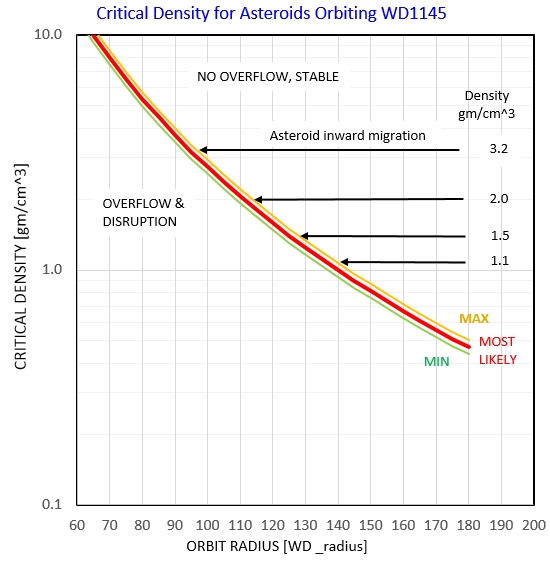
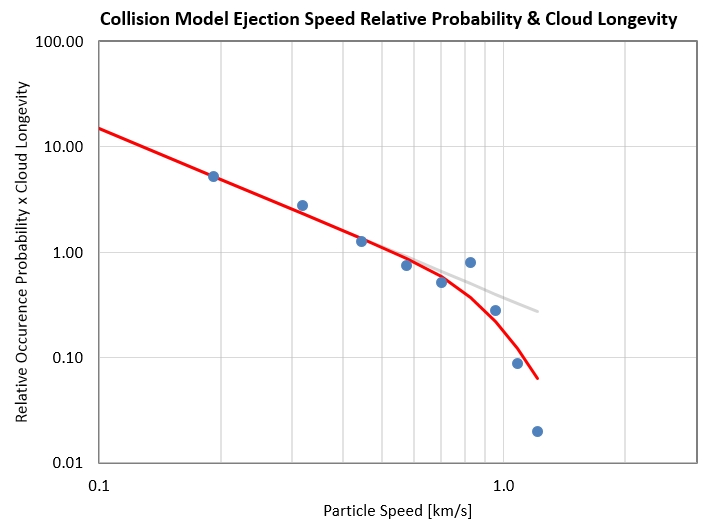
Collision model thoughts
Data exchange files (for all years: 2015/16, 2016/17, etc)
My collaboration policy
References & related external links
2 of 7 - 2016.01.17 to 2016.07.13: LC Observations - 2nd set of LCs, for 2015/16 observing season
3 of 7 - 2015.11.01 to 2016.07.13: LC Observations - 3rd set of LCs, for 2015/16 observing season (N = 158) + Overview, Results & Model Speculations
4 of 7 - 2016.10.25 to 2017.06.18: LC Observations - 4th set of LCs, for 2016/17 observing season
5 of 7 - 2017.10.23 to 2018.06.18: LC Observations - 5th set of LCs, for 2017/18 observing season
6 of 7 - 2018.11.06 to 2018.07.09 LC Observations - 6th set of LCs, for 2018/19 observing season (YOU ARE HERE)
Previous 4 observing seasons: Observational findings that need to be explained by models
7 of 7 - 2019.12.02 to present LC Observations - 7th set of LCs, for 2019/20 observing season
Links on this web page:
Status & Summary of Results for this Observing Season
Observing session LCs
Finder image & basic info
Miscellaneous analysis and speculation
Collision model thoughts
Data exchange files (for all years: 2015/16, 2016/17, etc)
My collaboration policy
References & related external links
Status
& Summary of Results for this Observing Season:
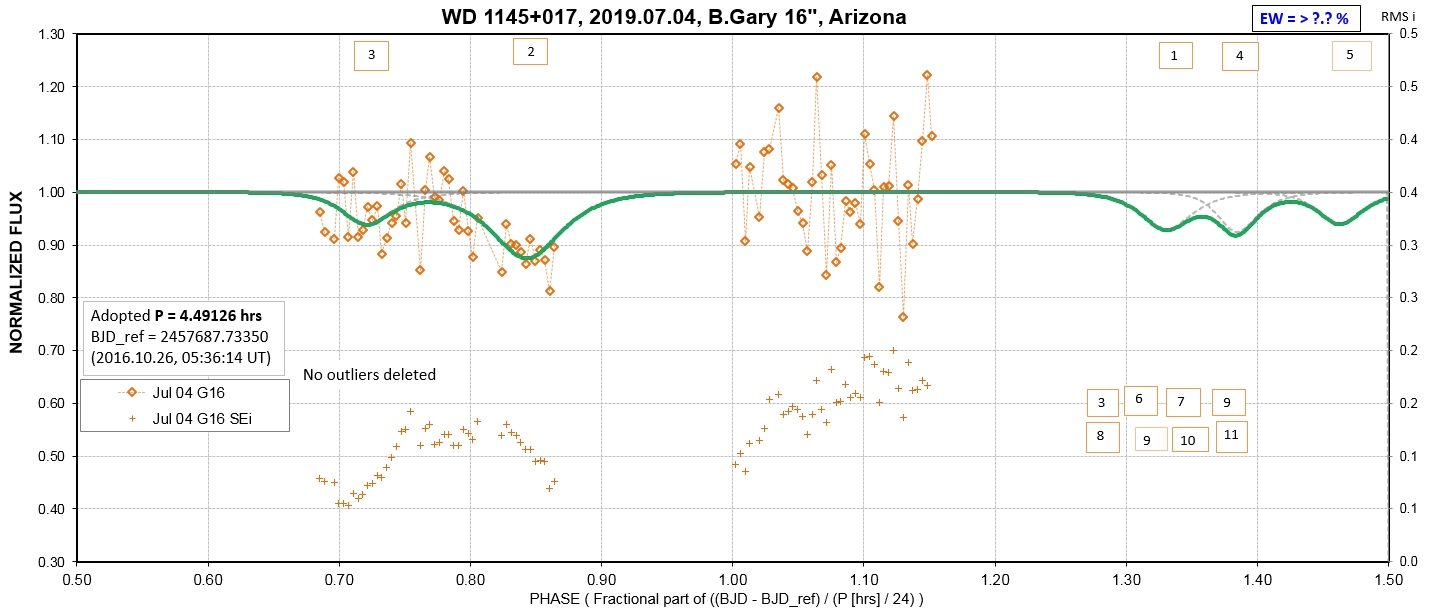
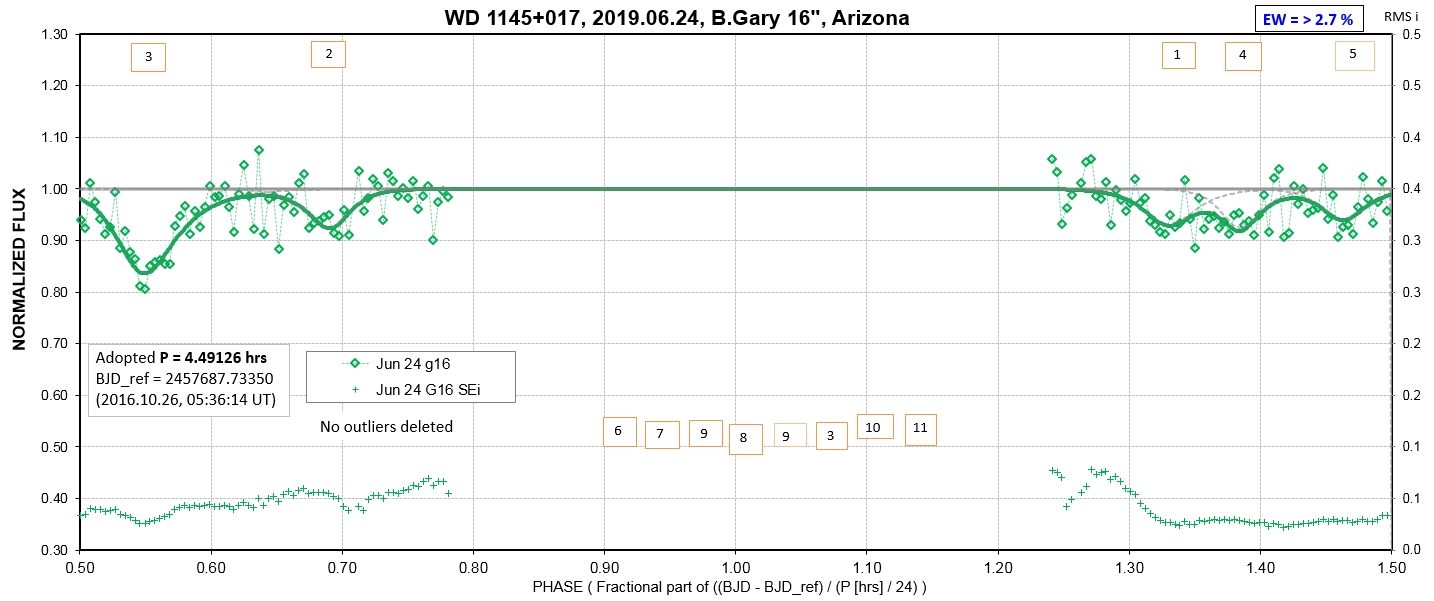
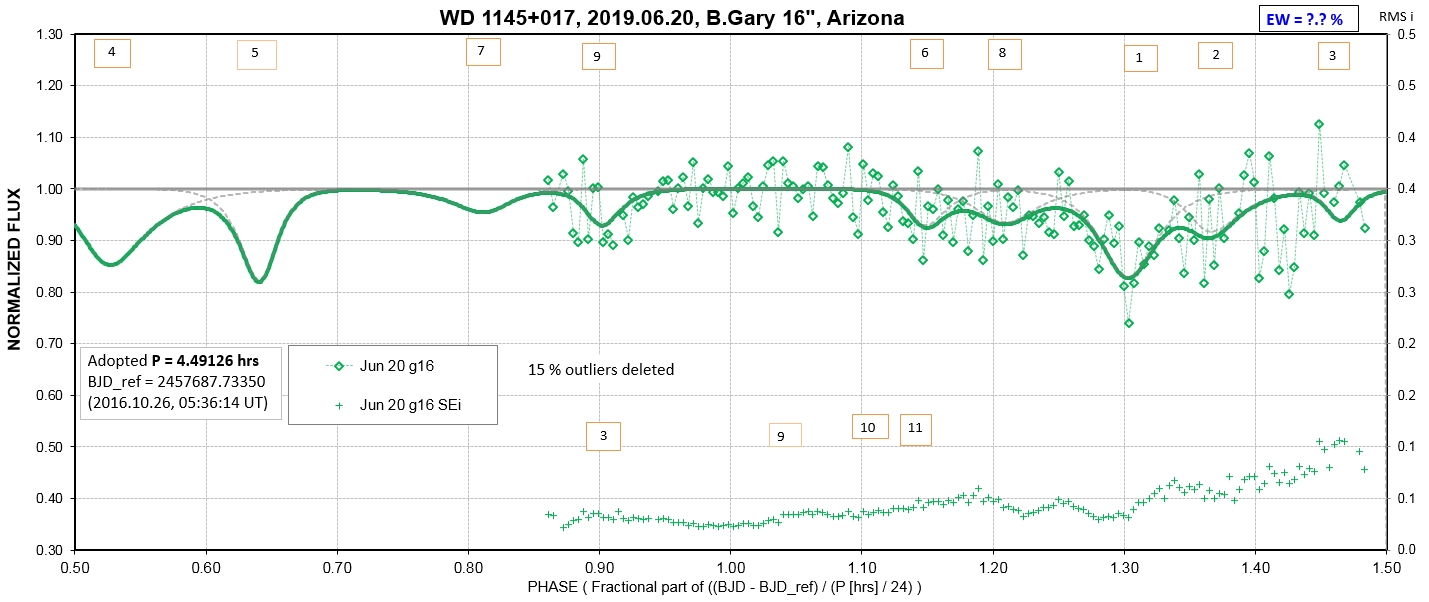
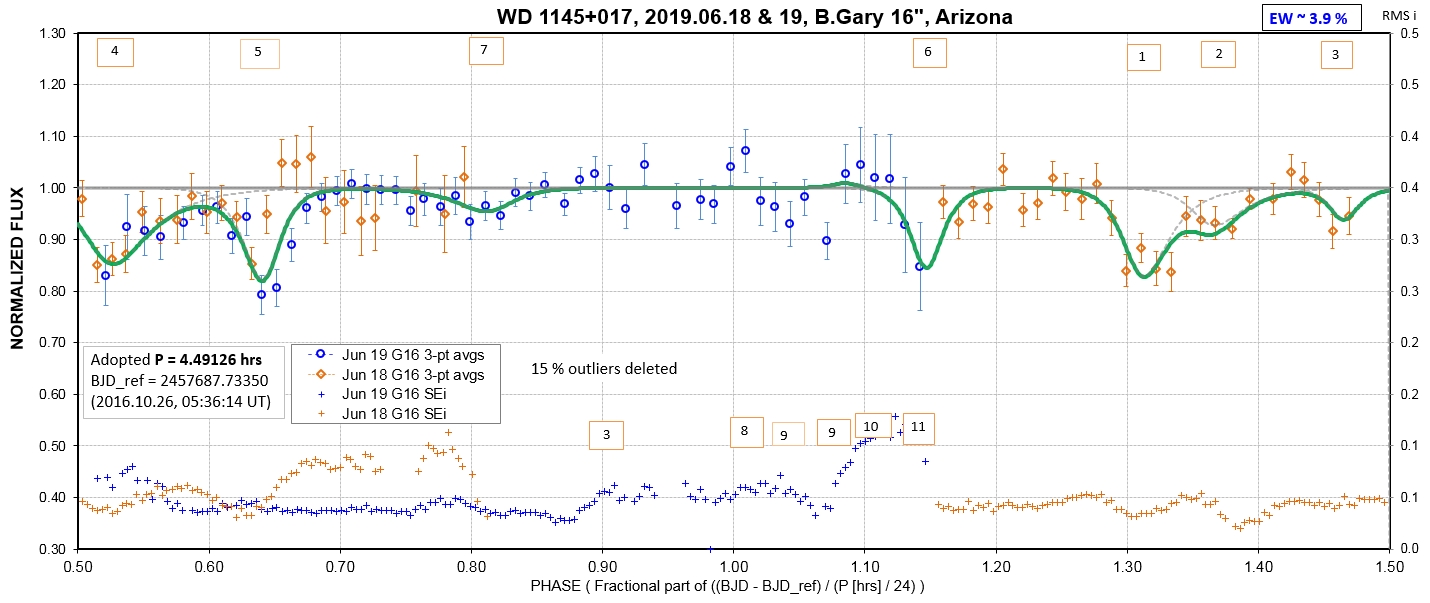
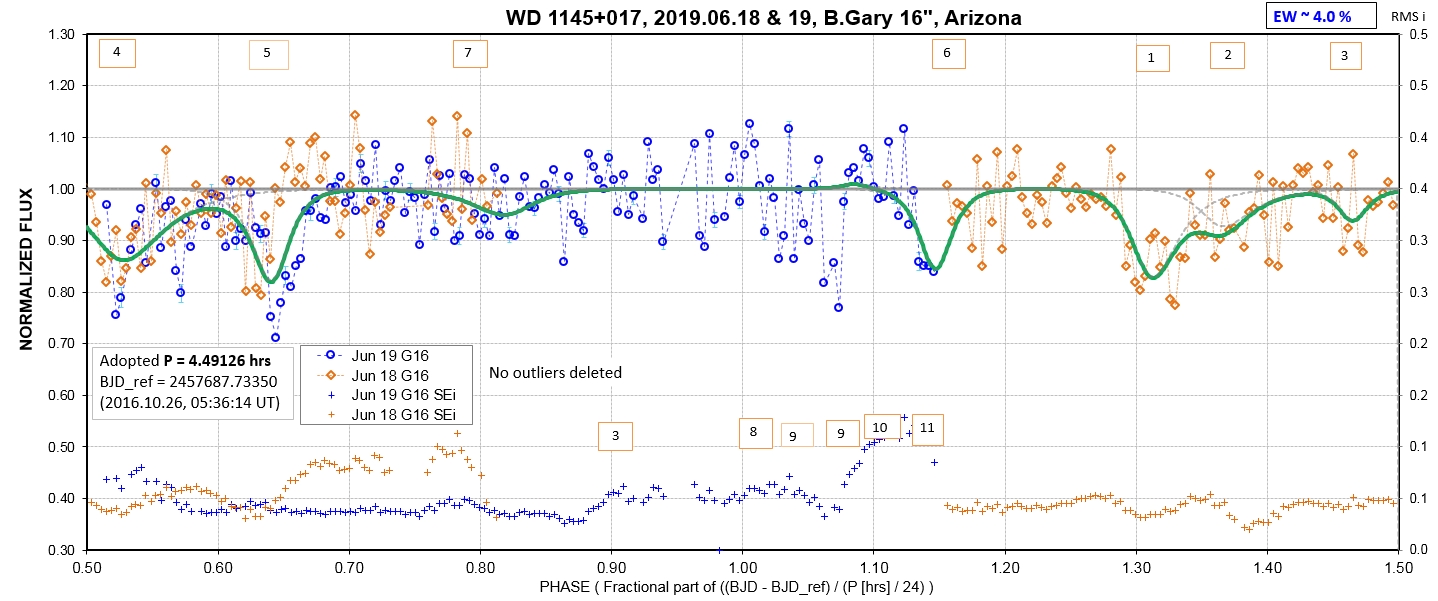
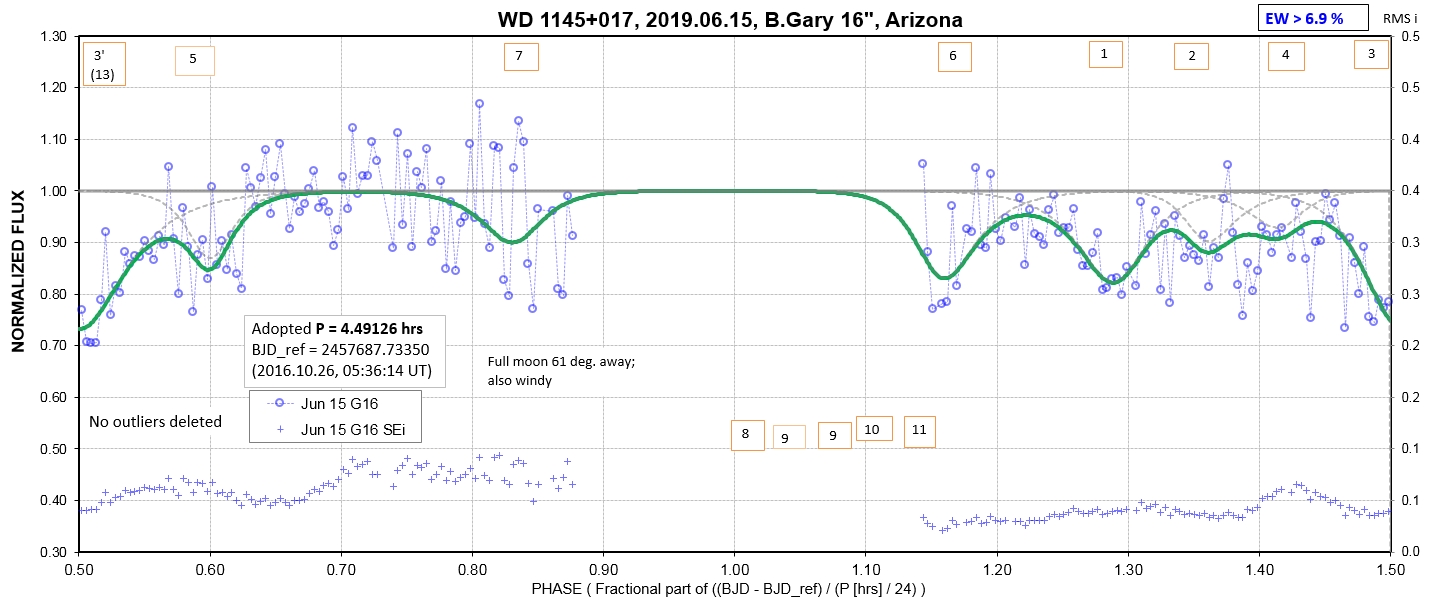
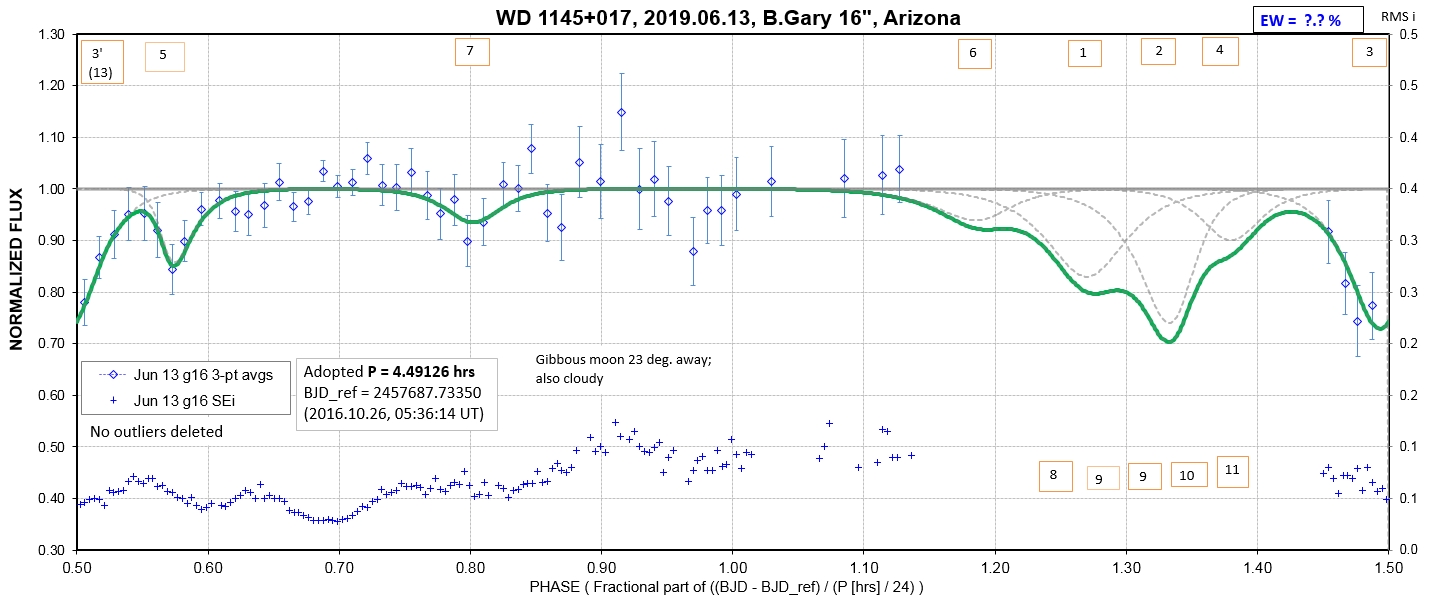
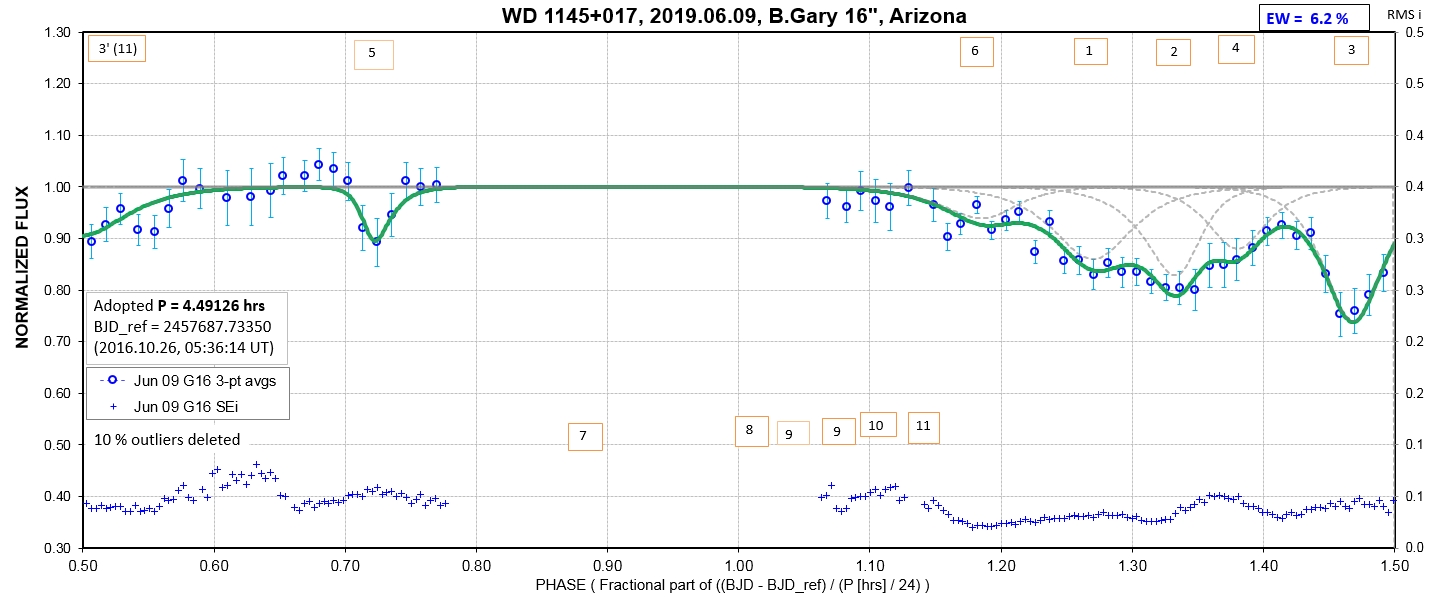
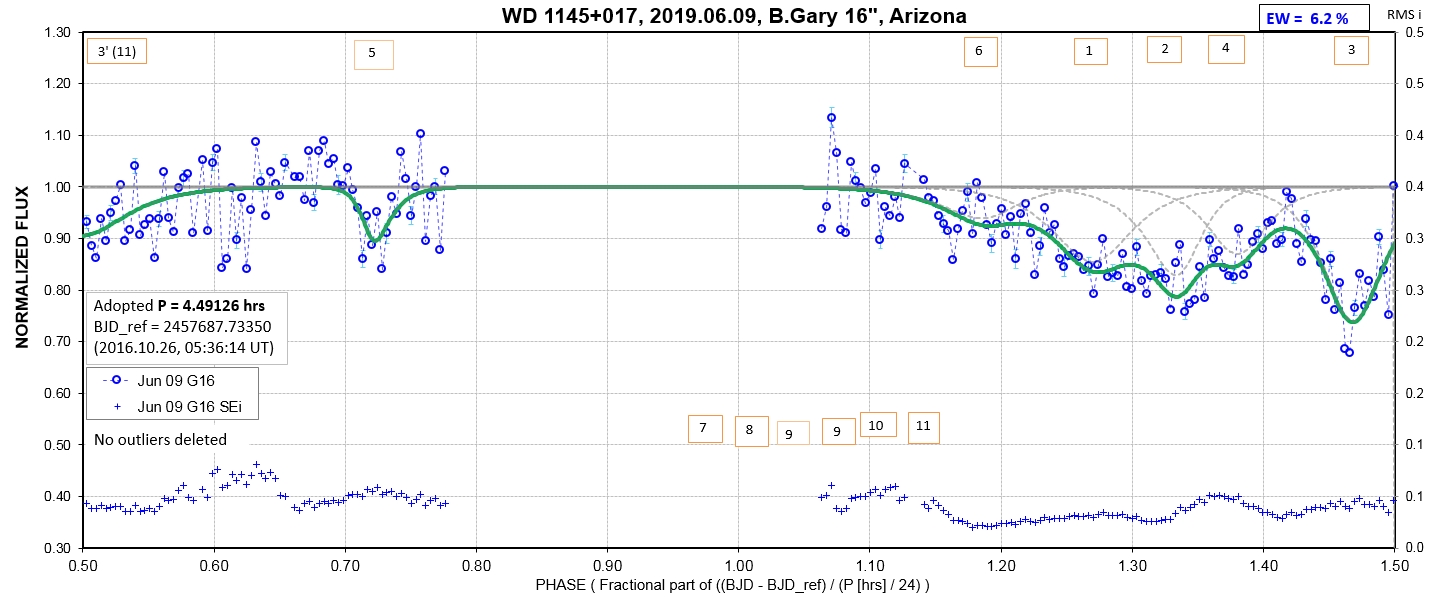
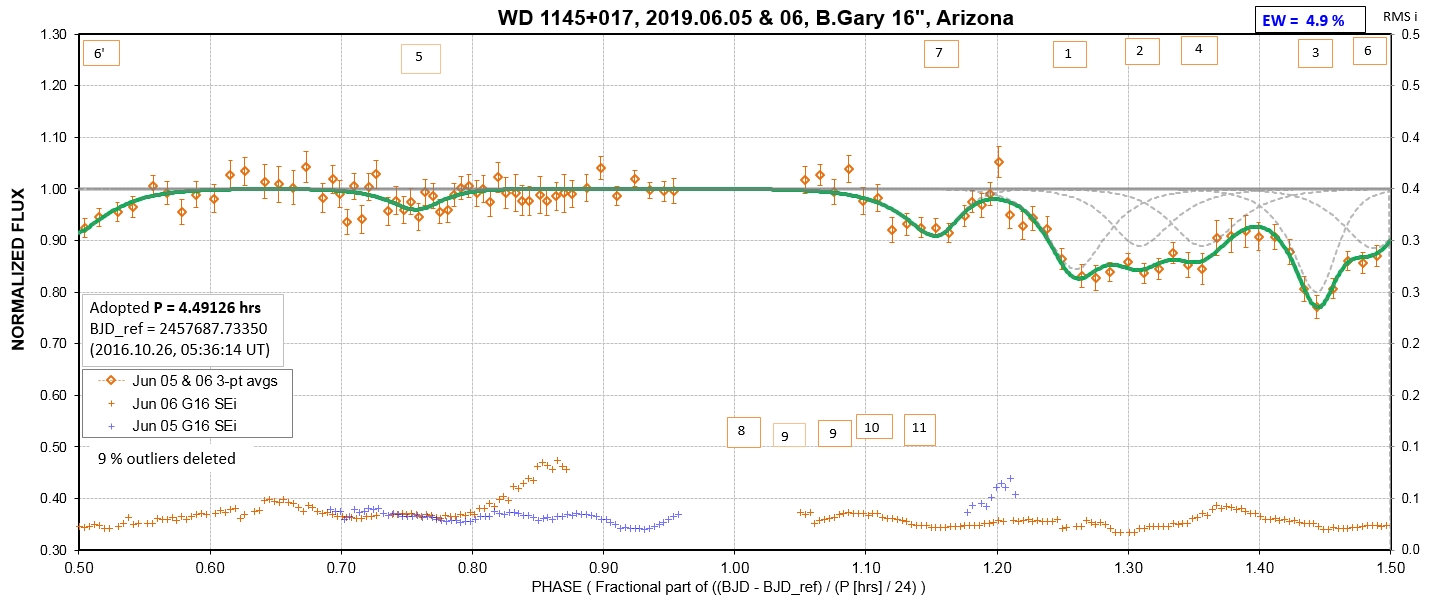
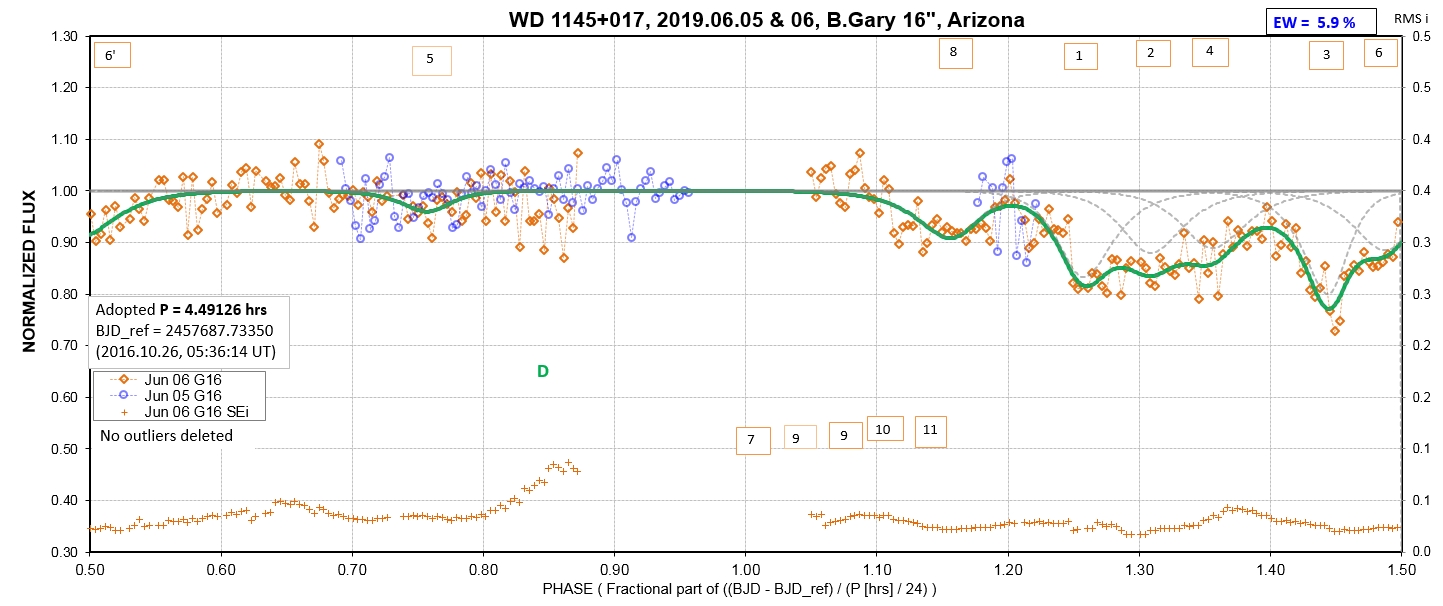
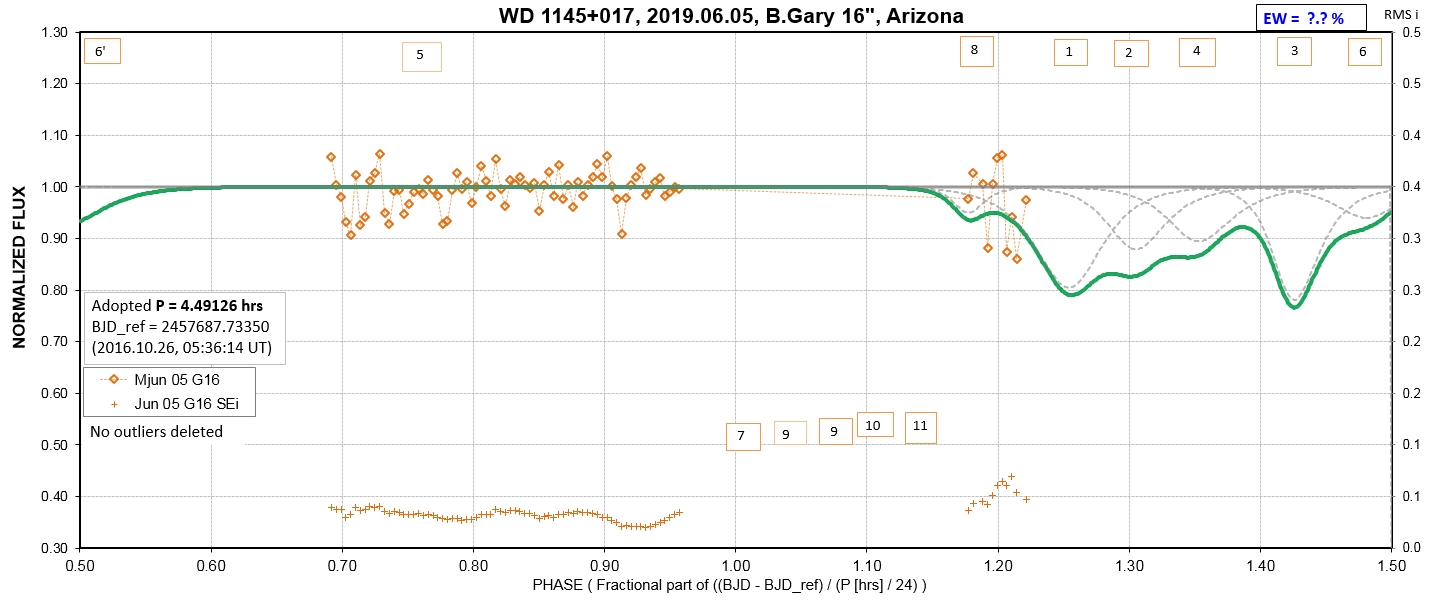
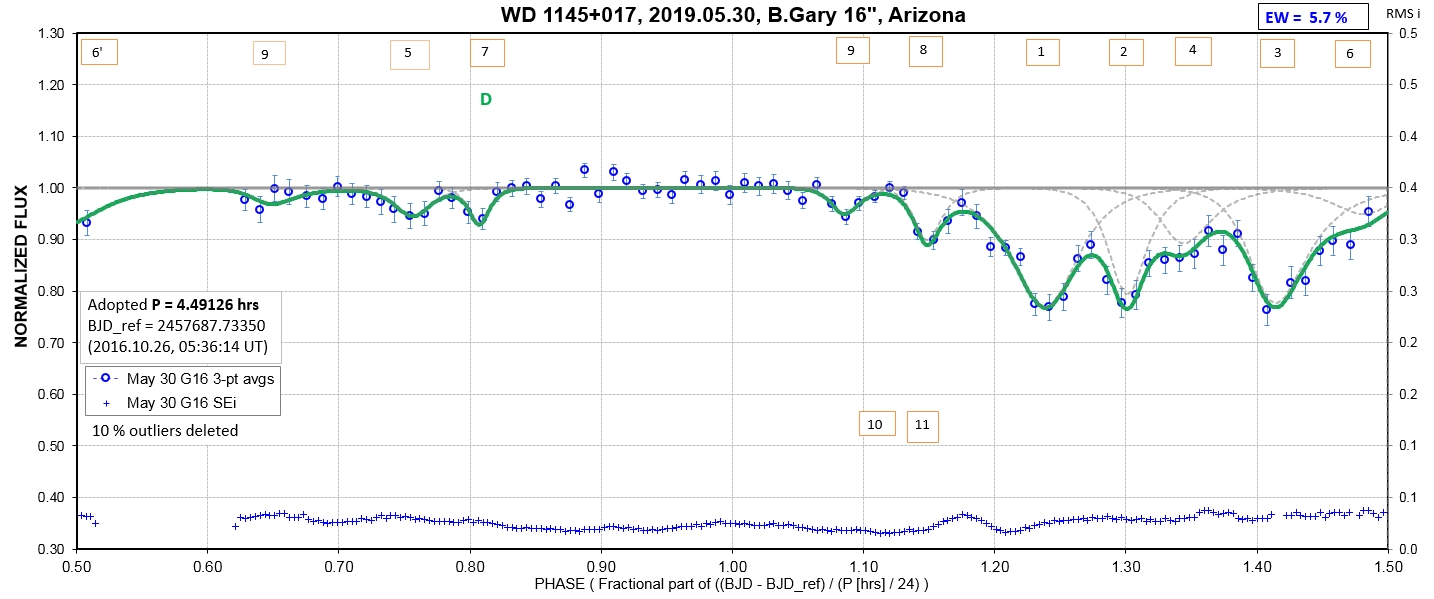
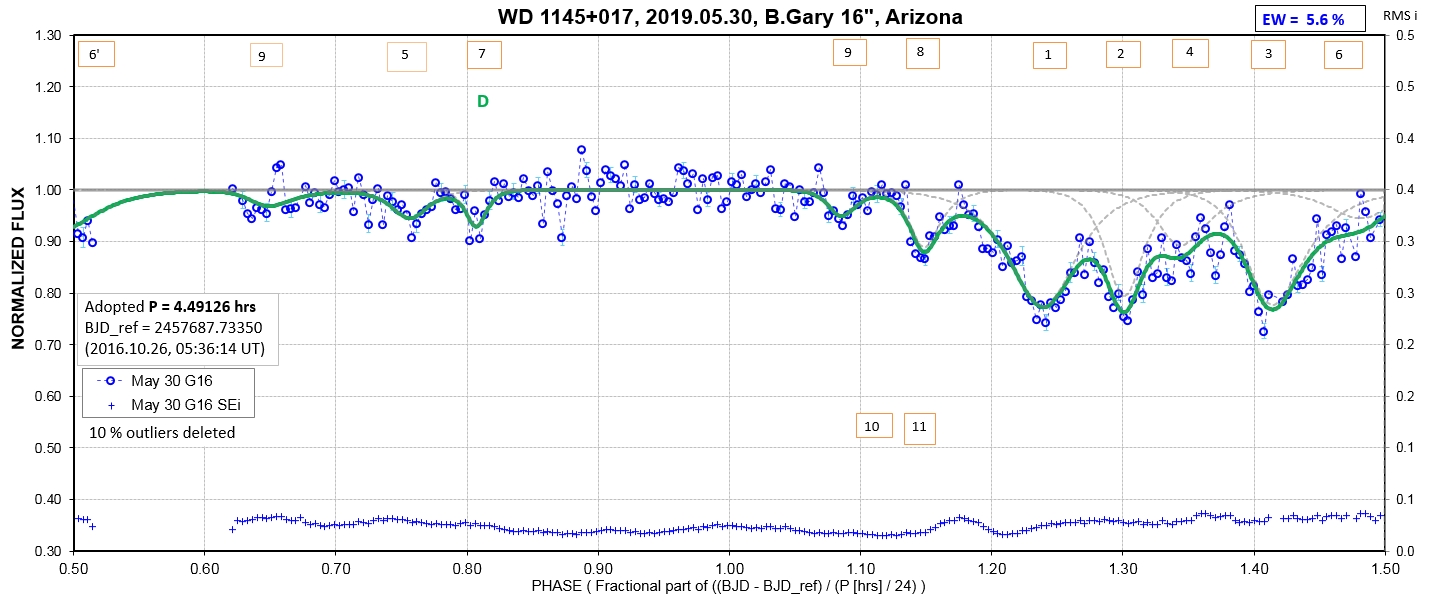
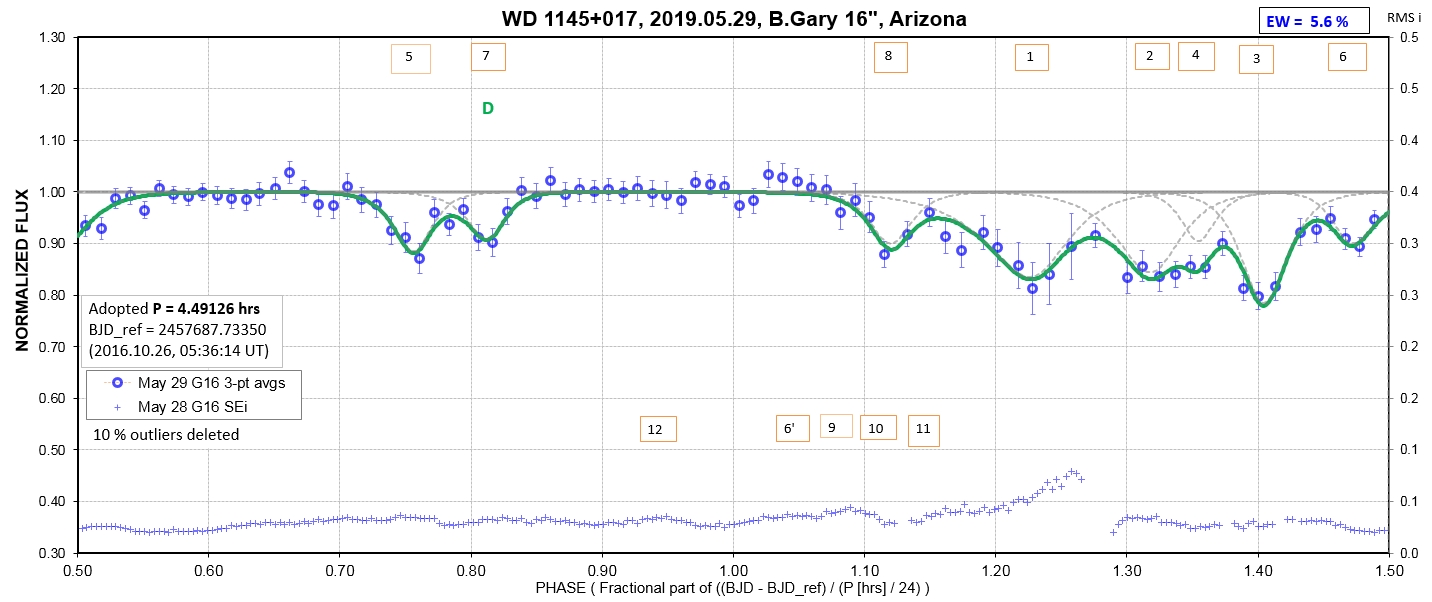
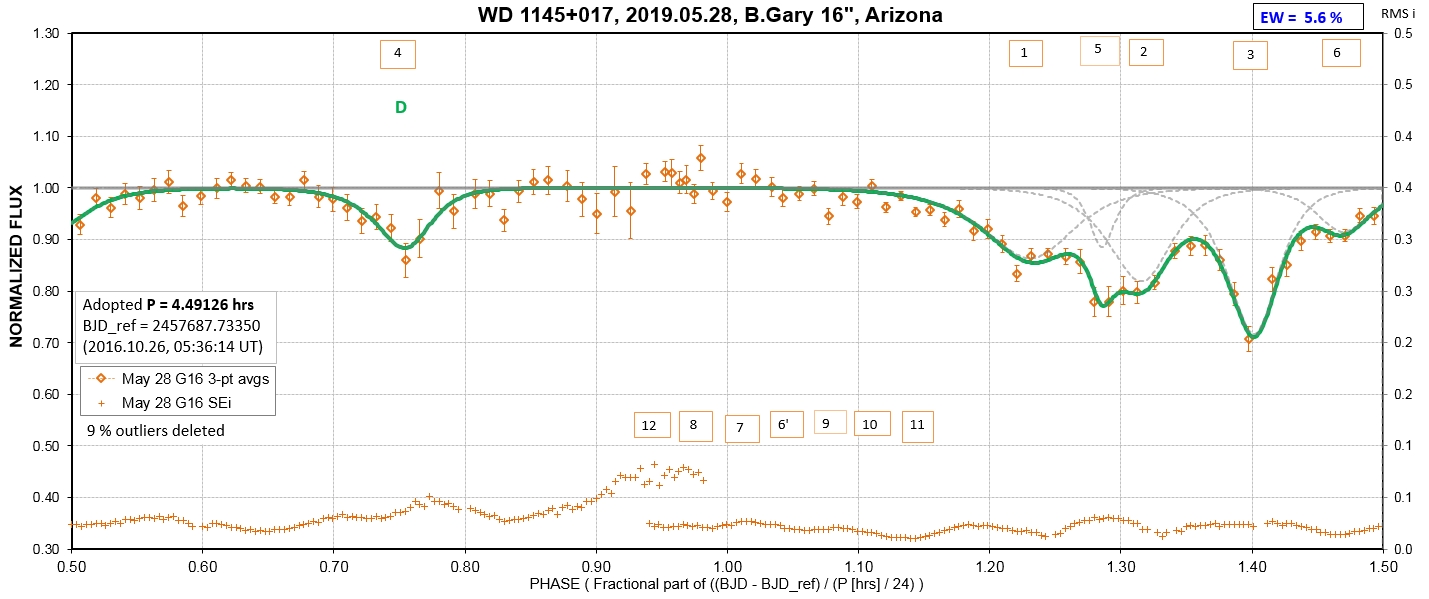
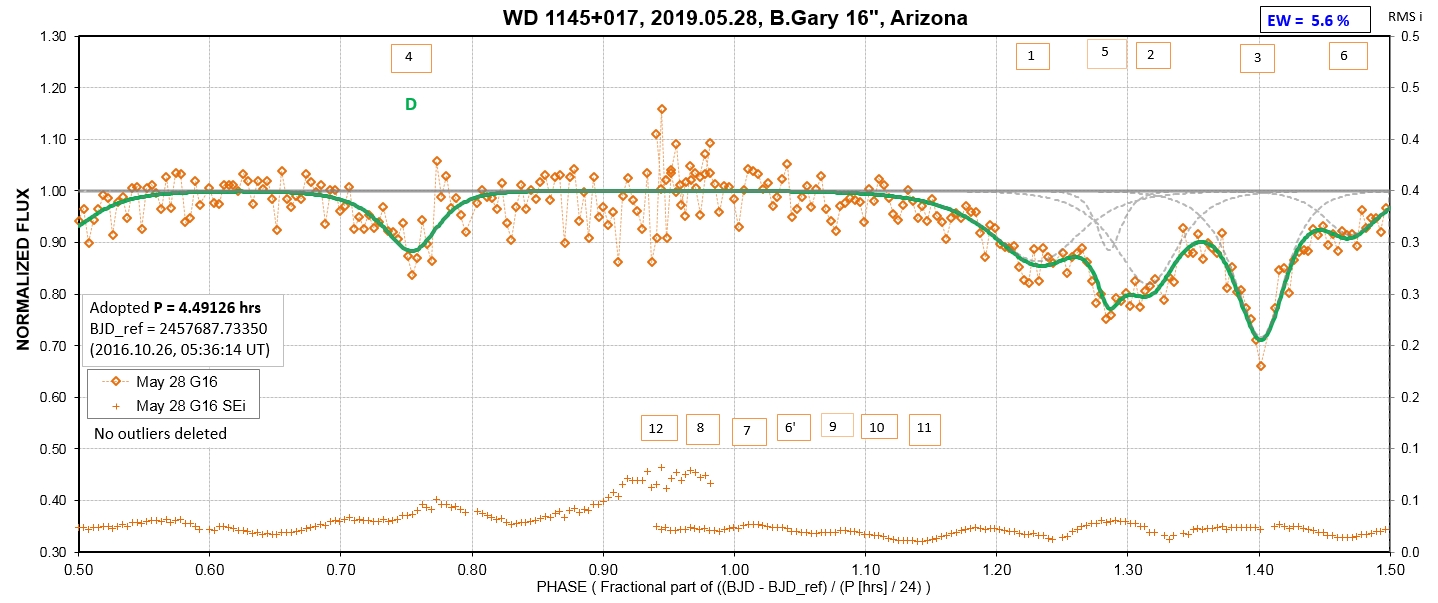
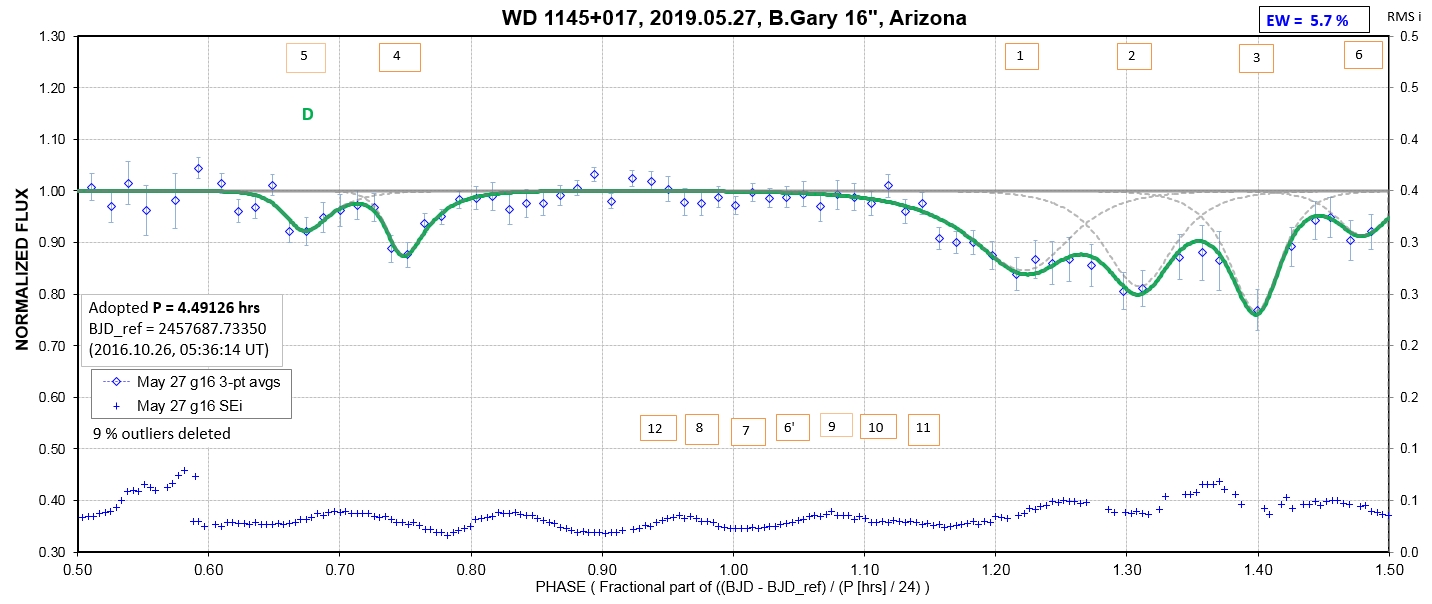
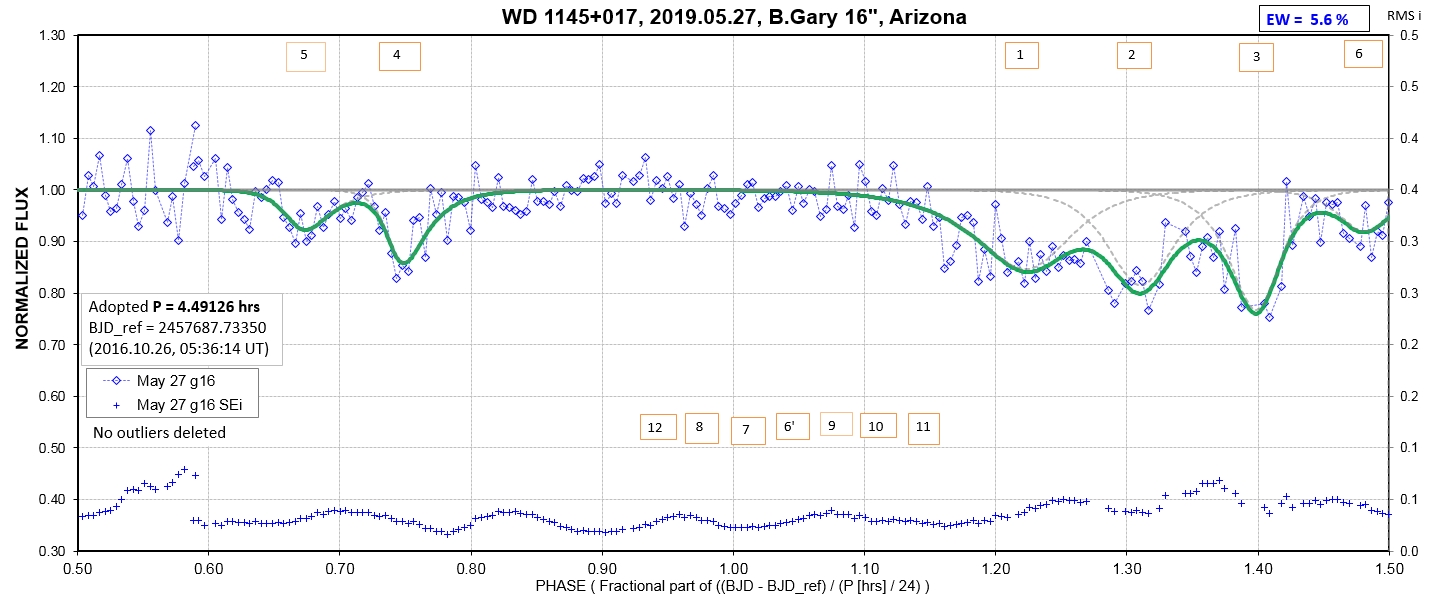
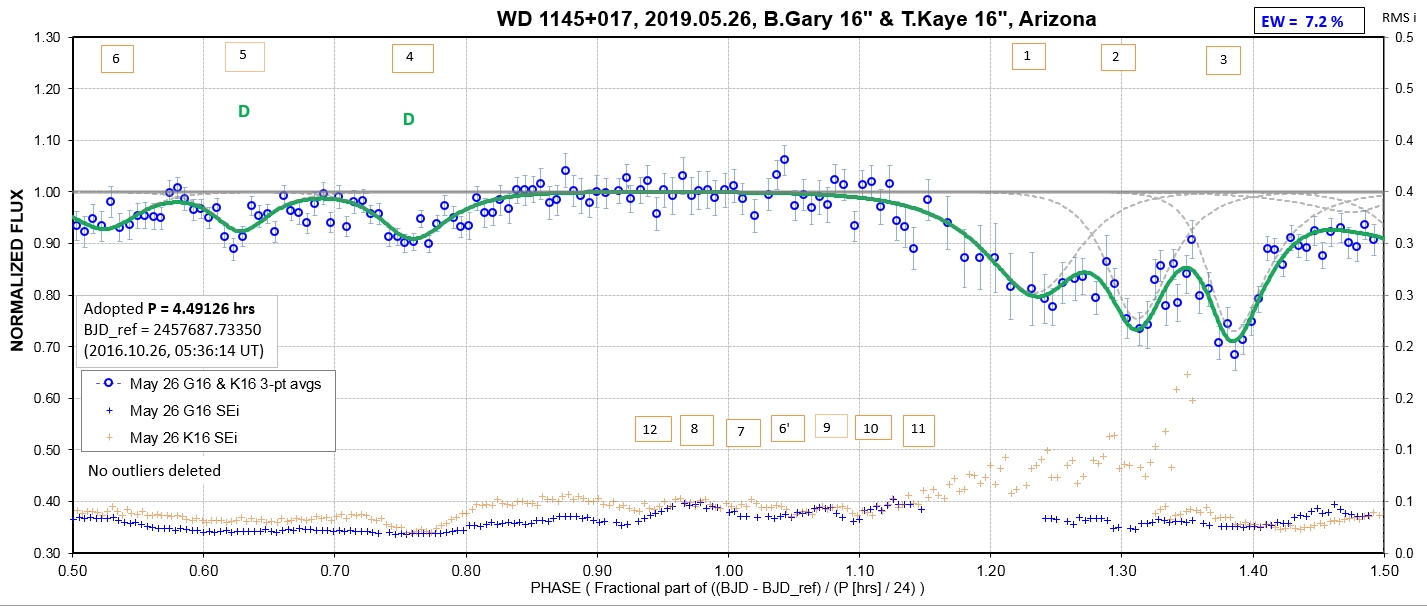
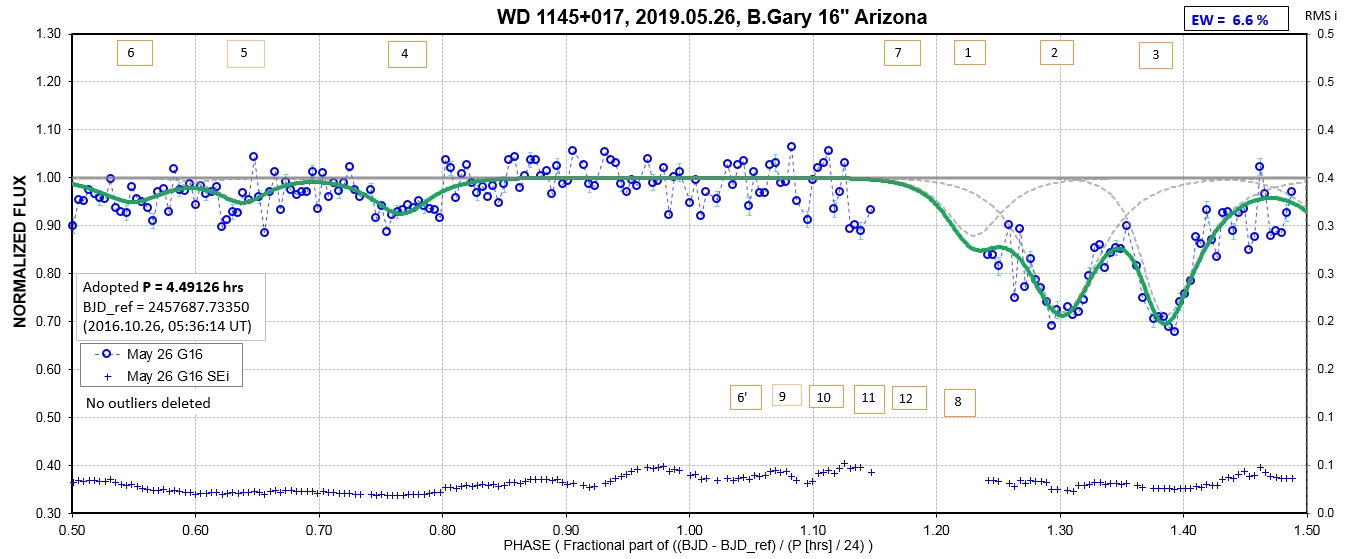
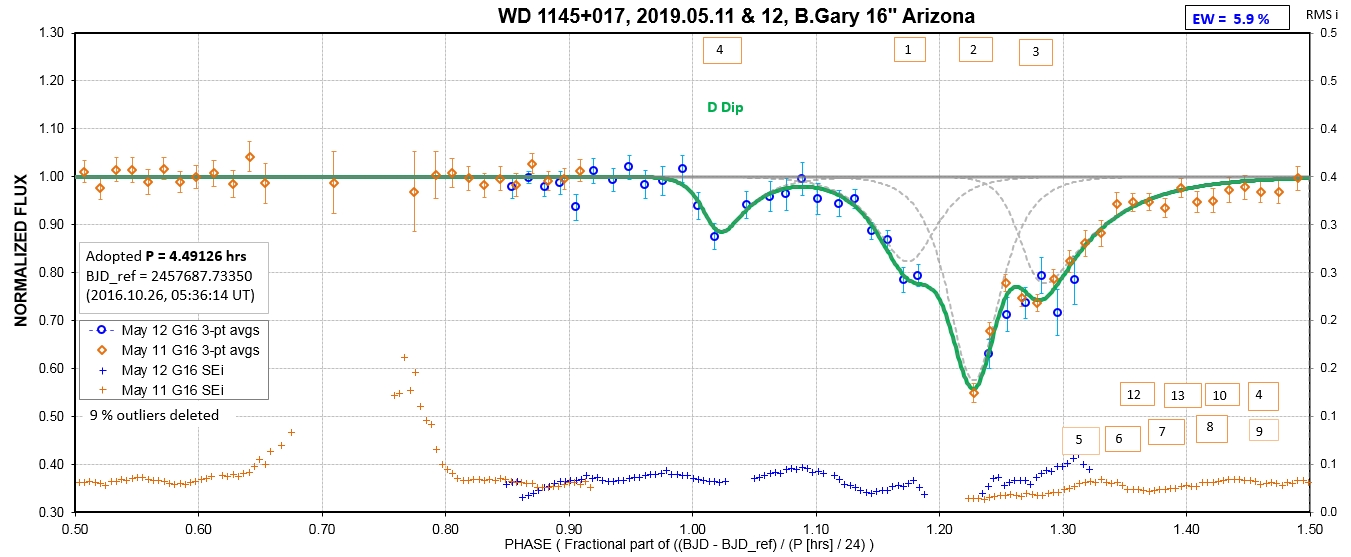
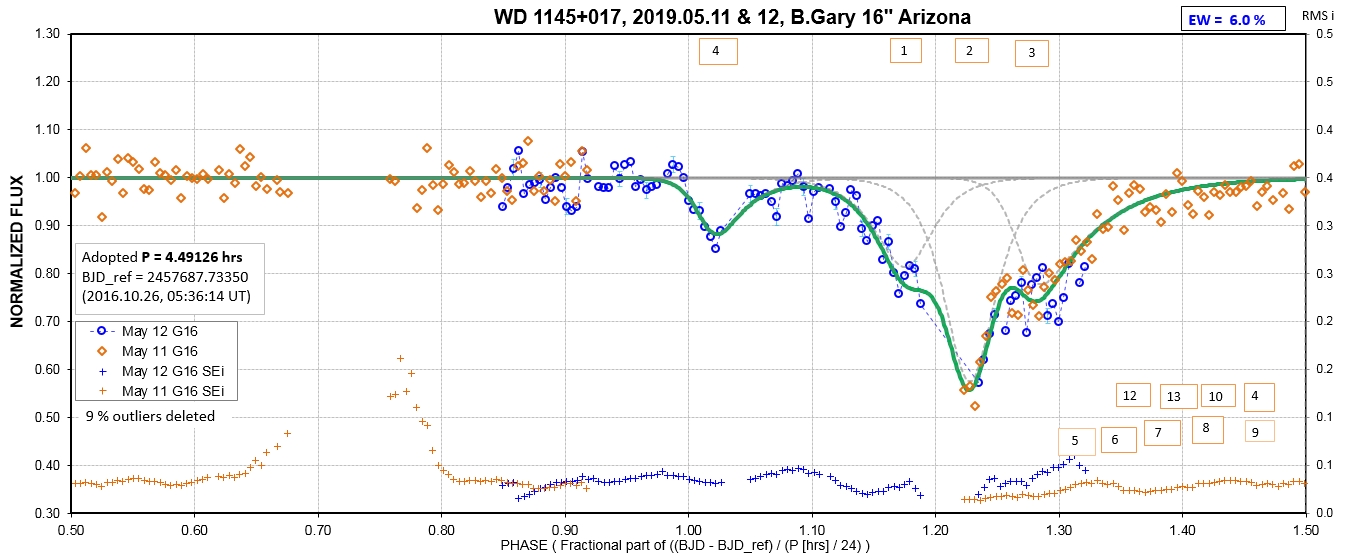
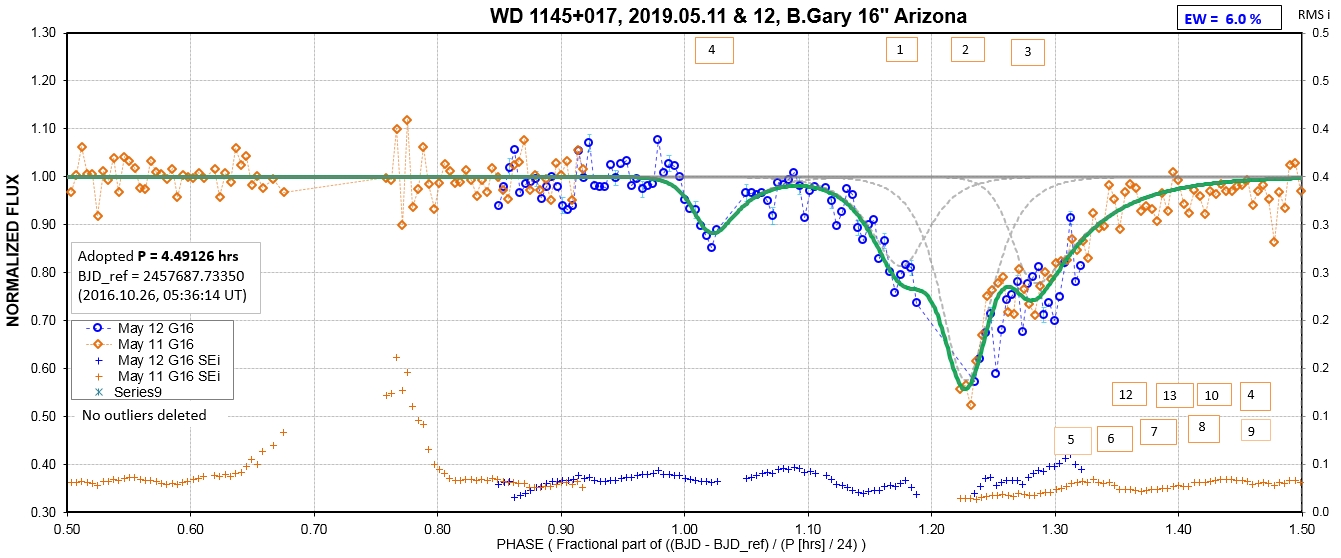
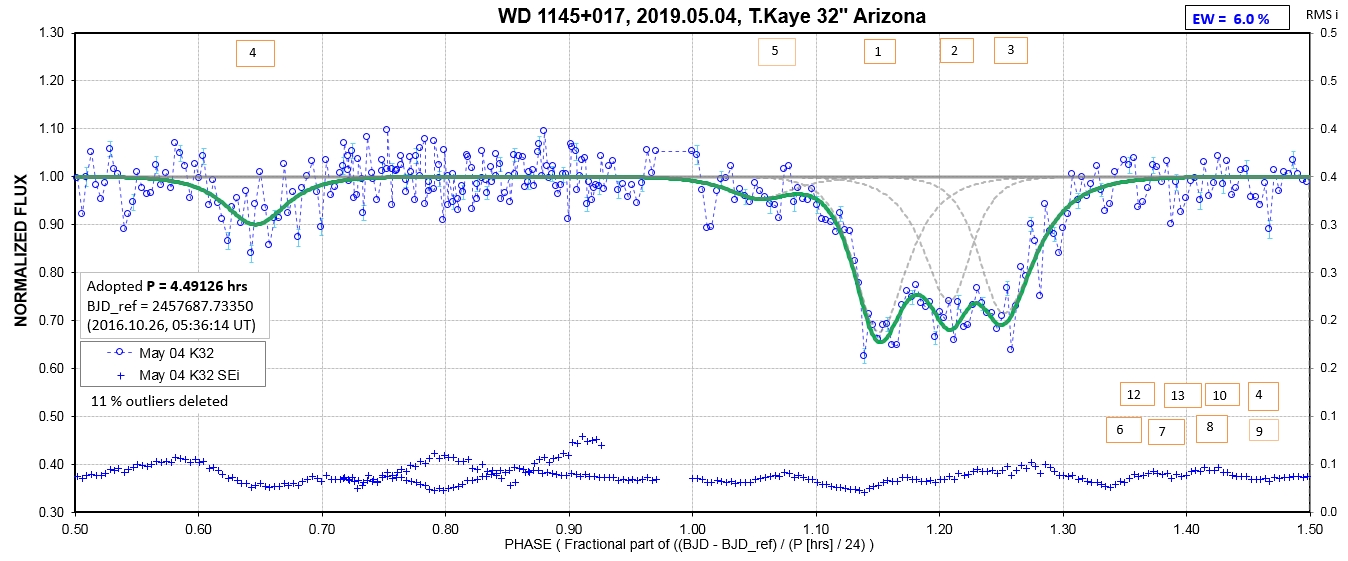
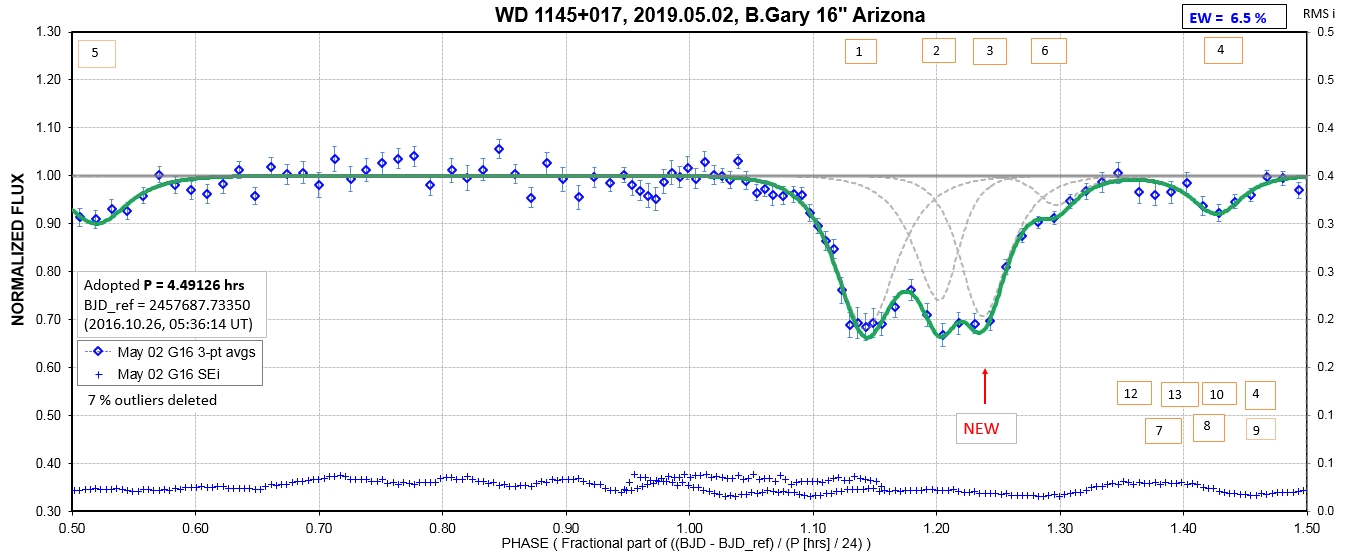
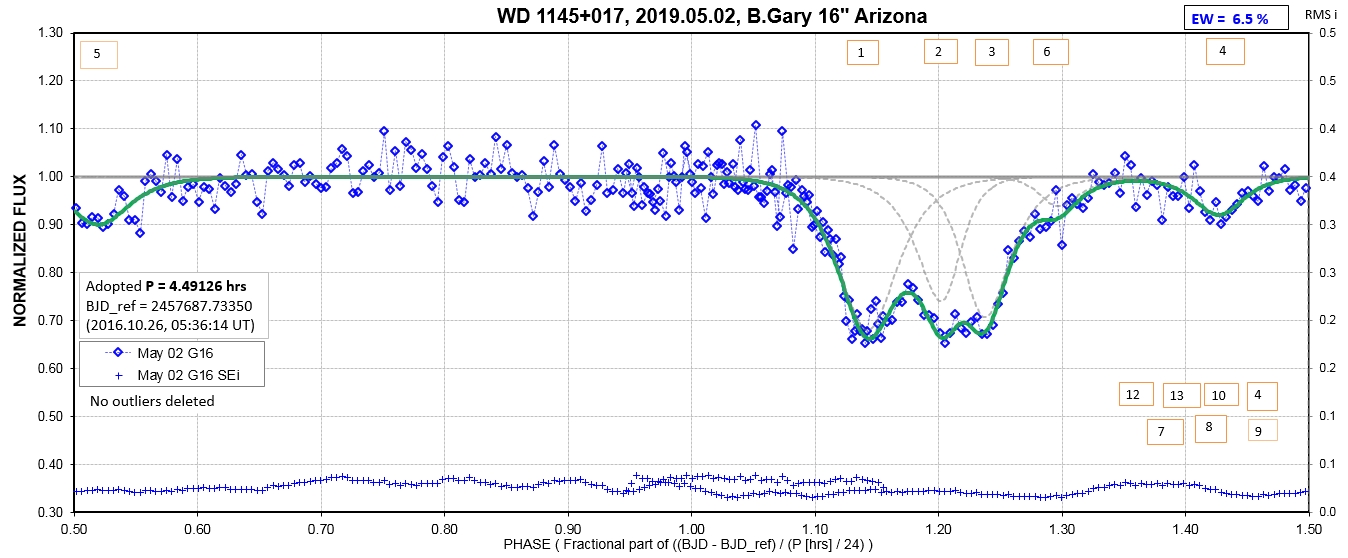
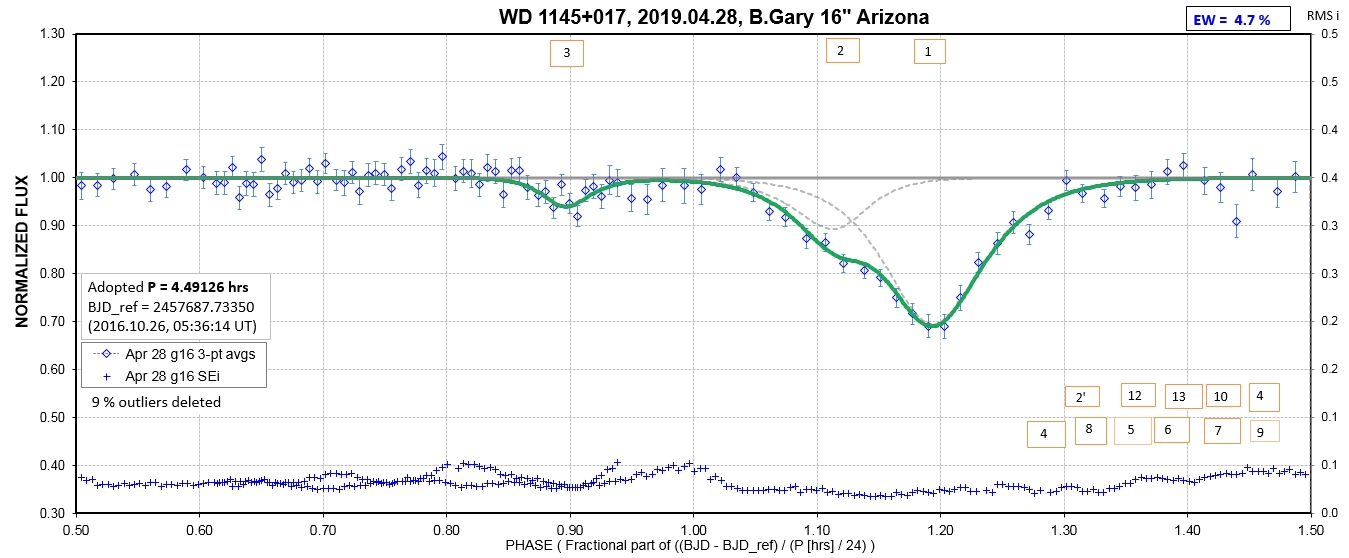
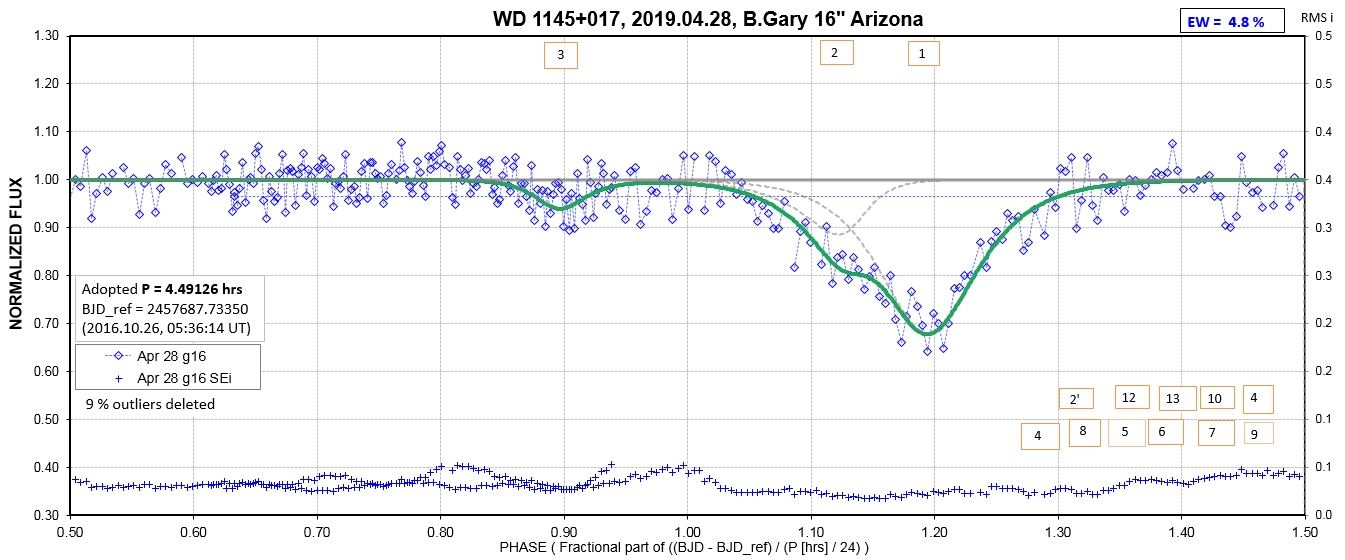
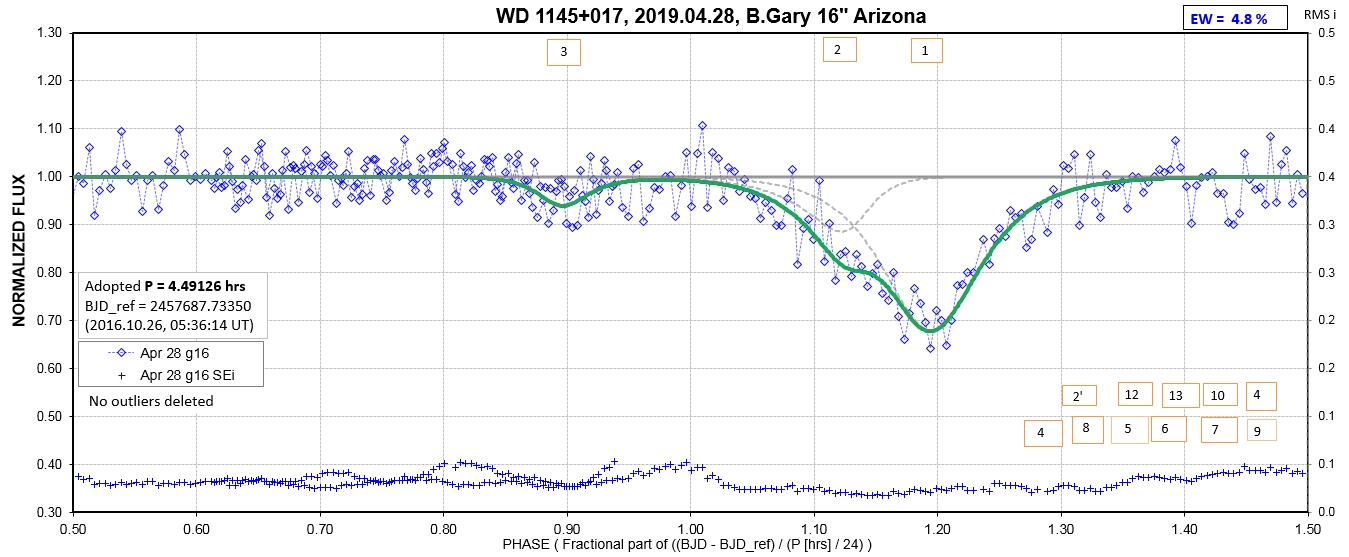
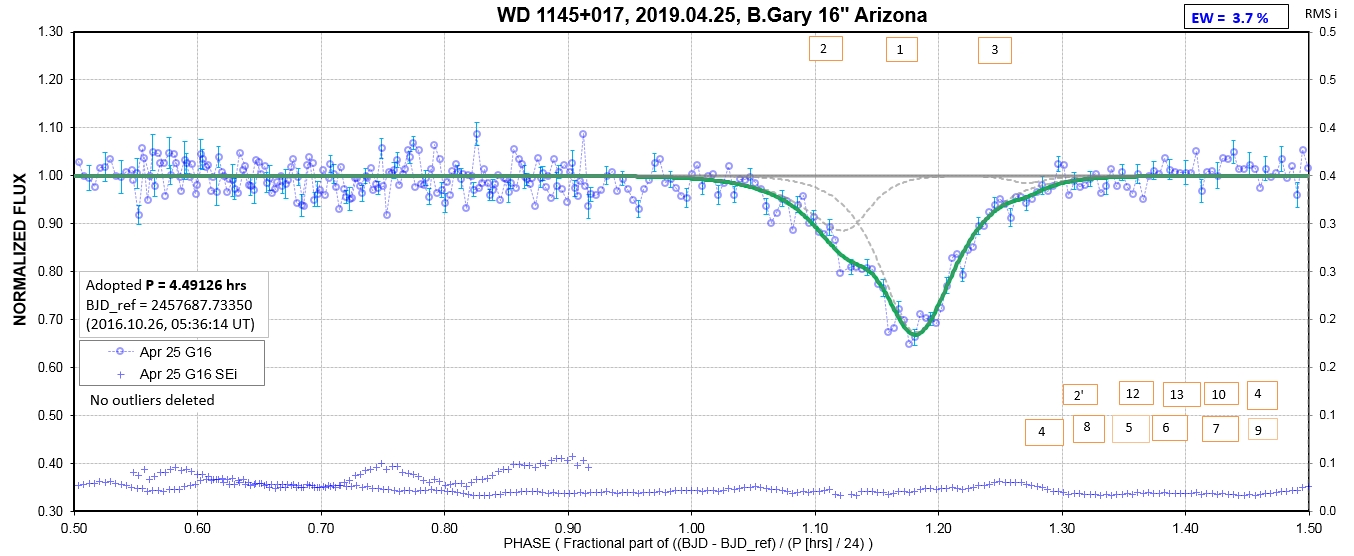
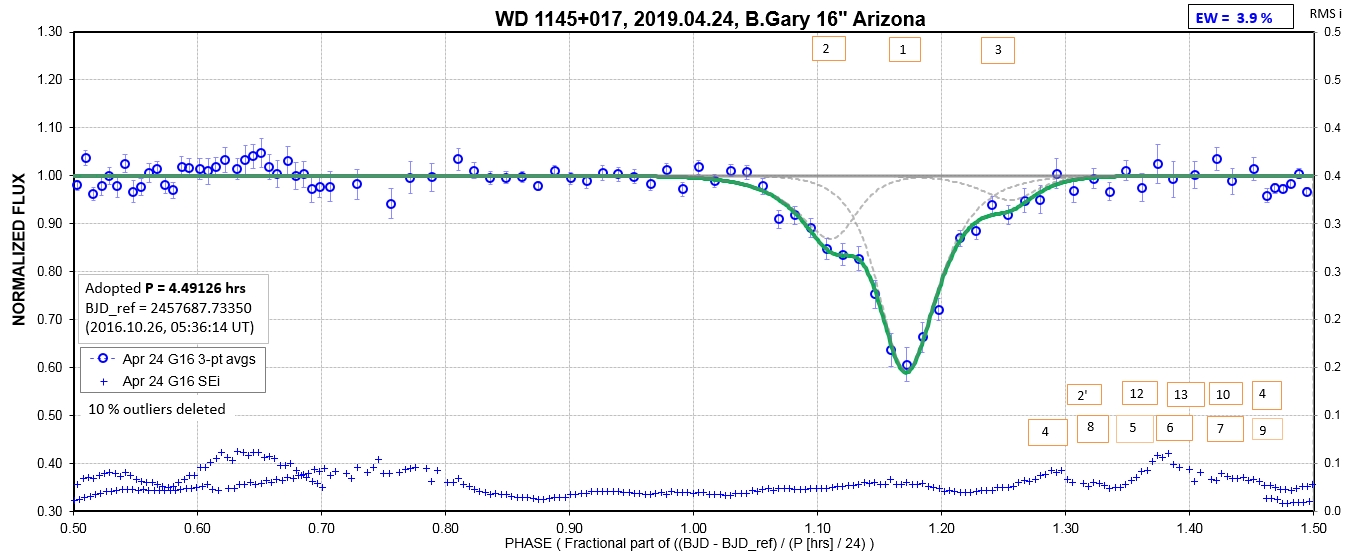
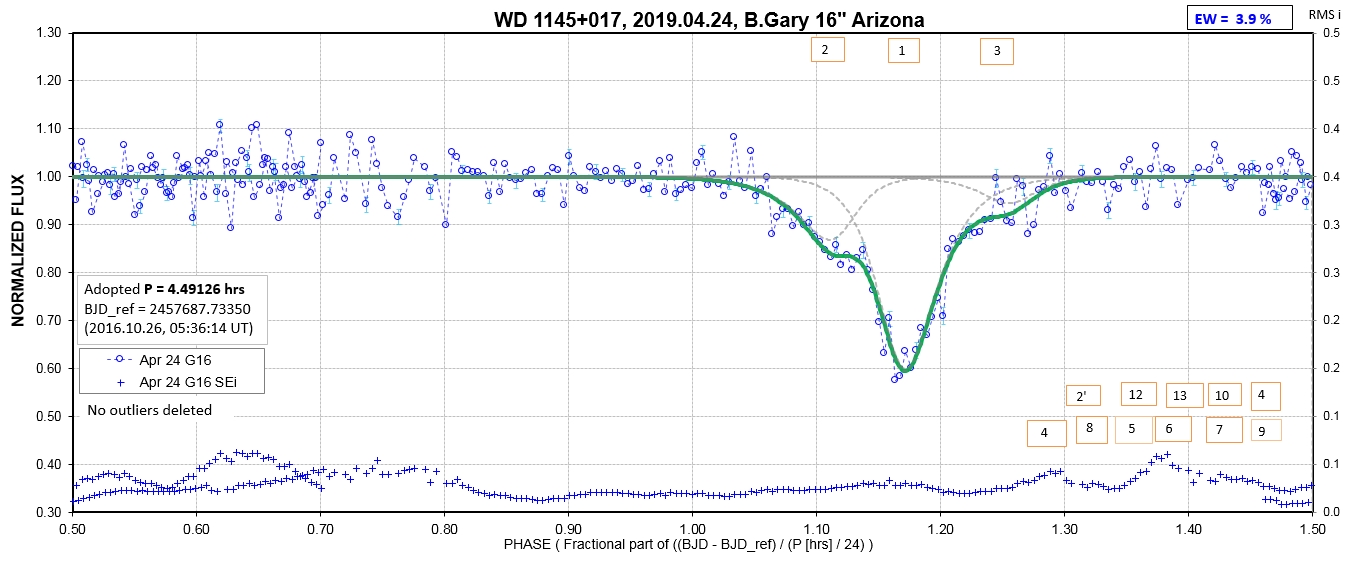
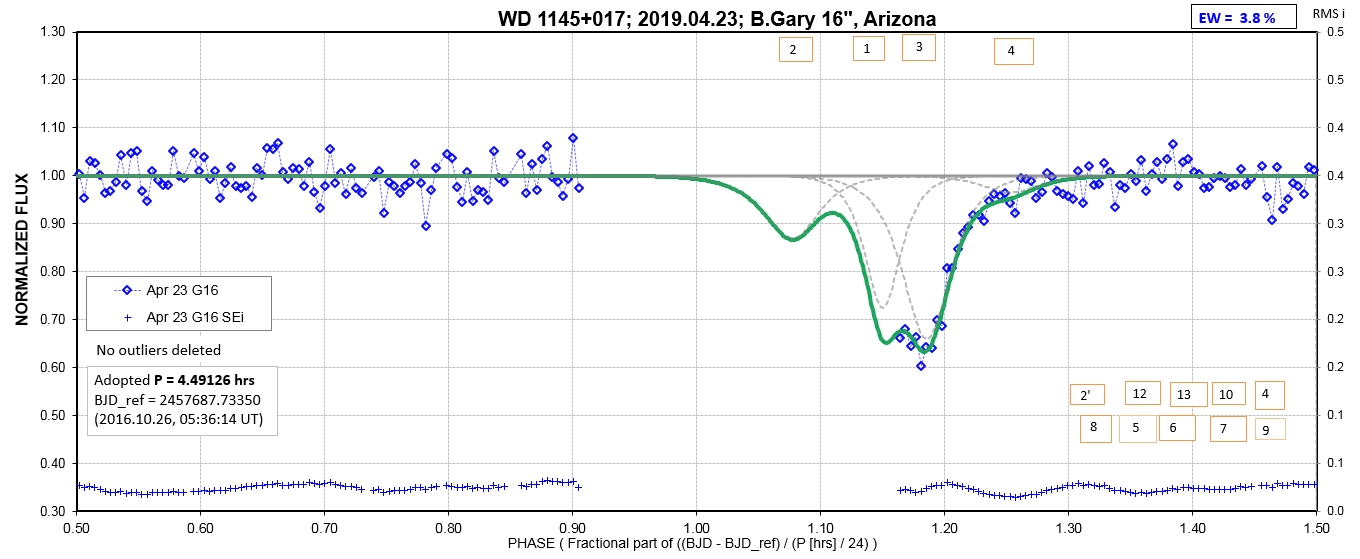
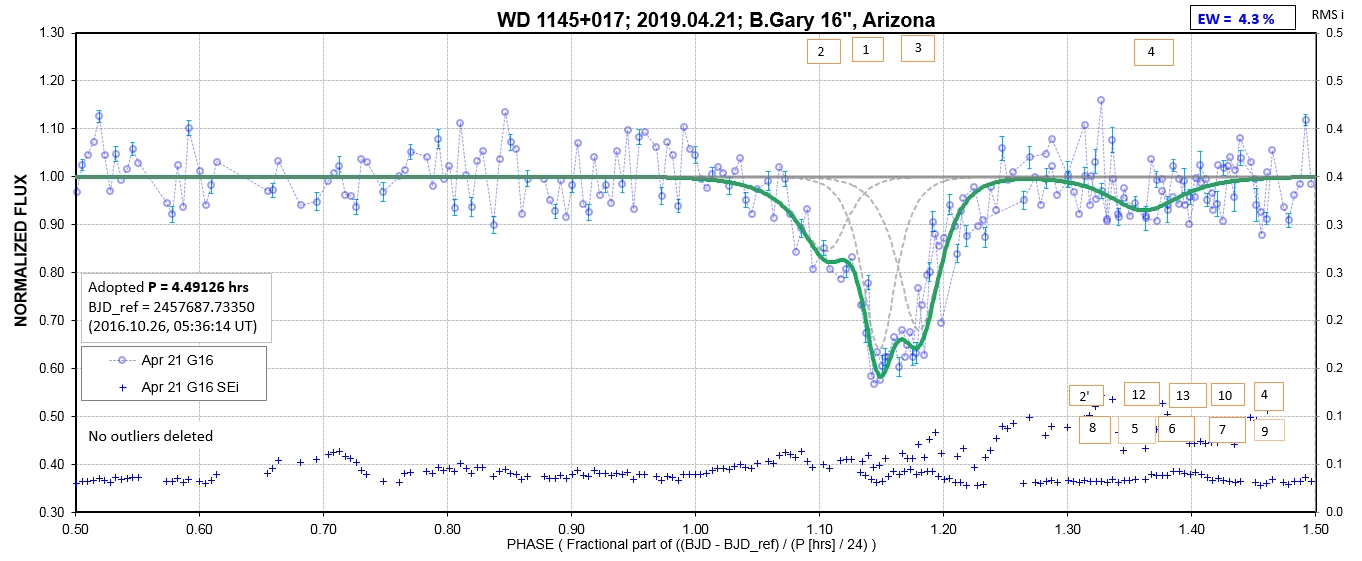
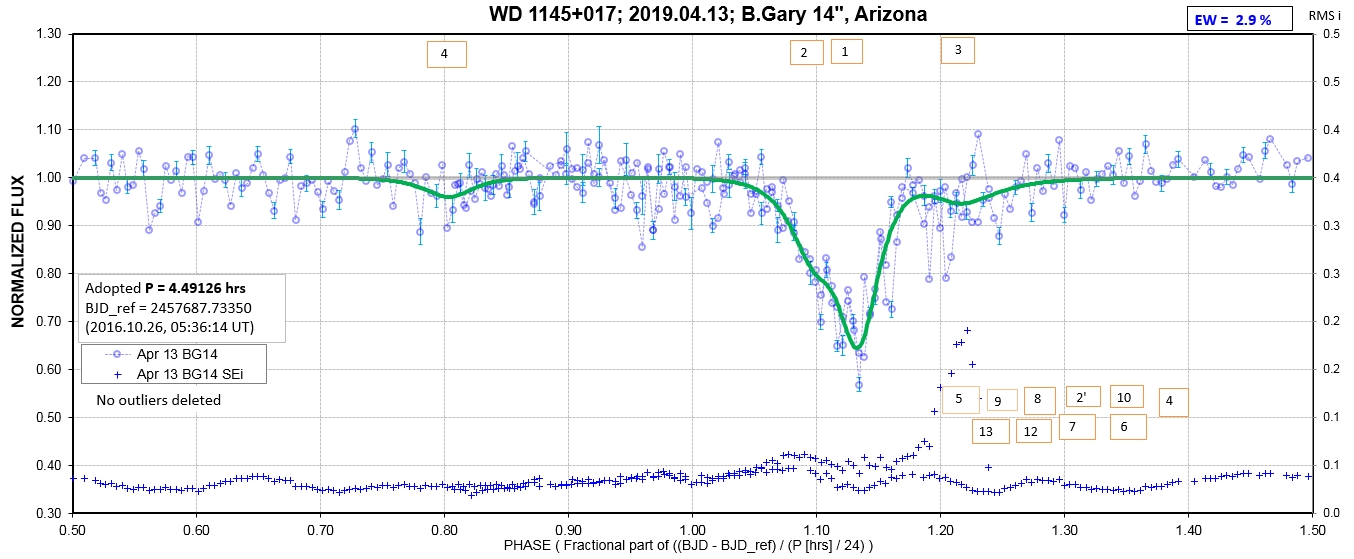
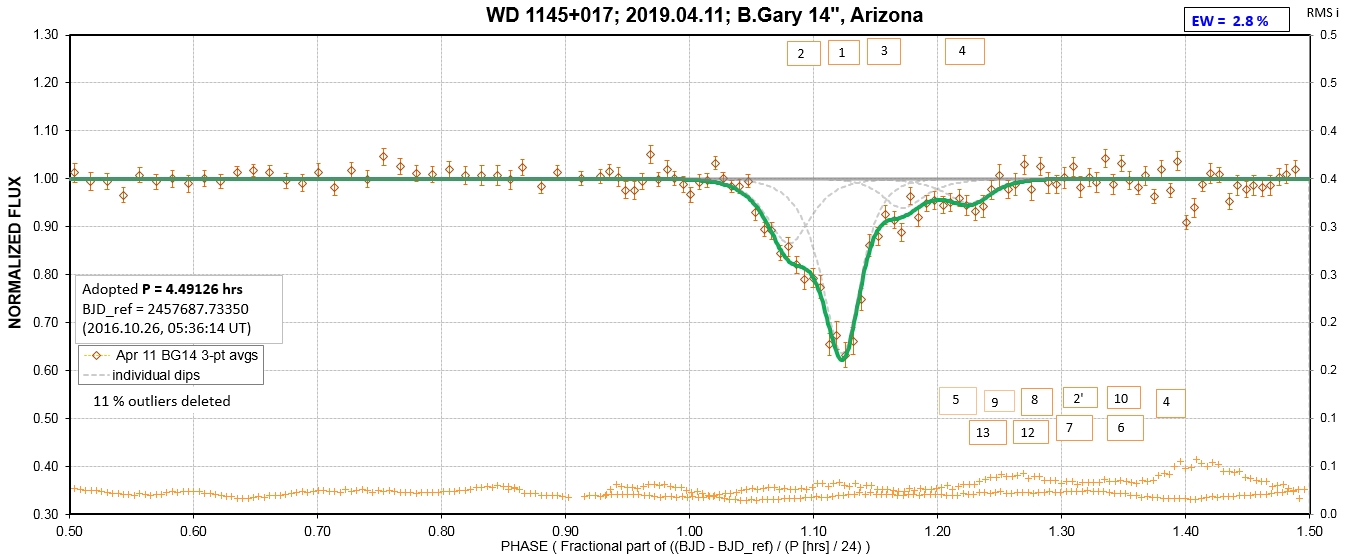
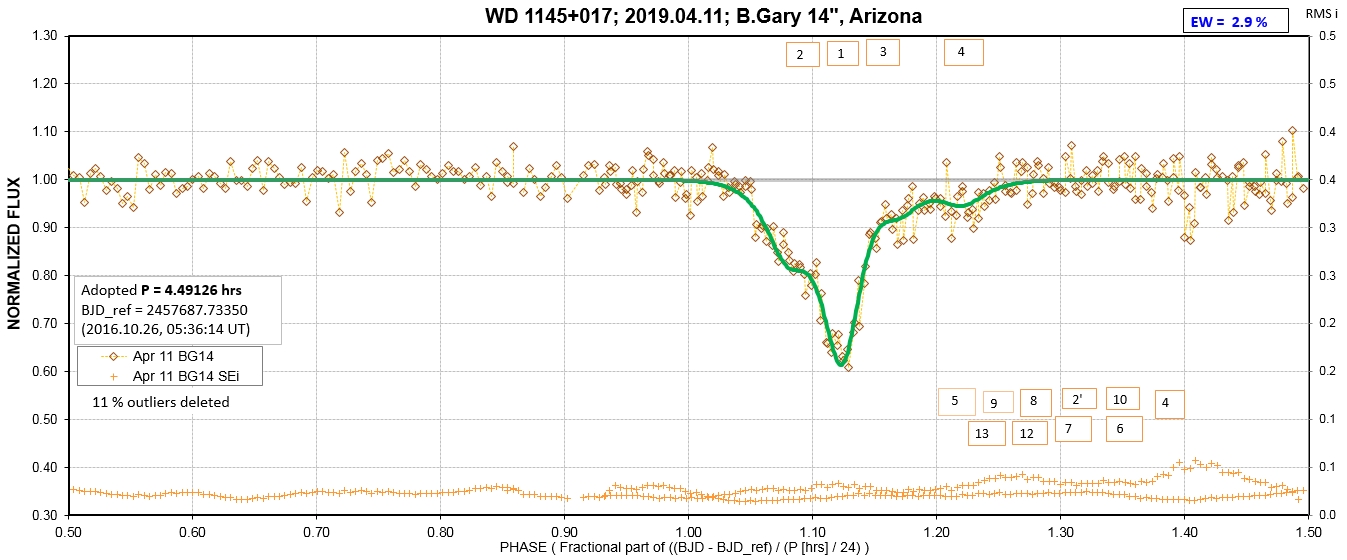
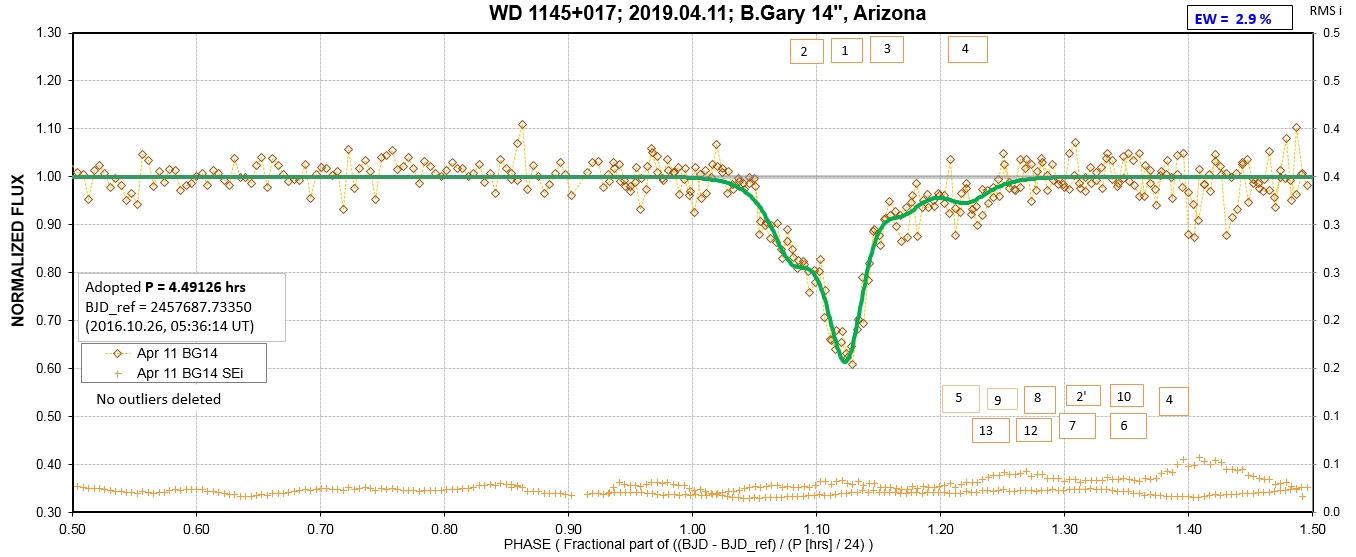
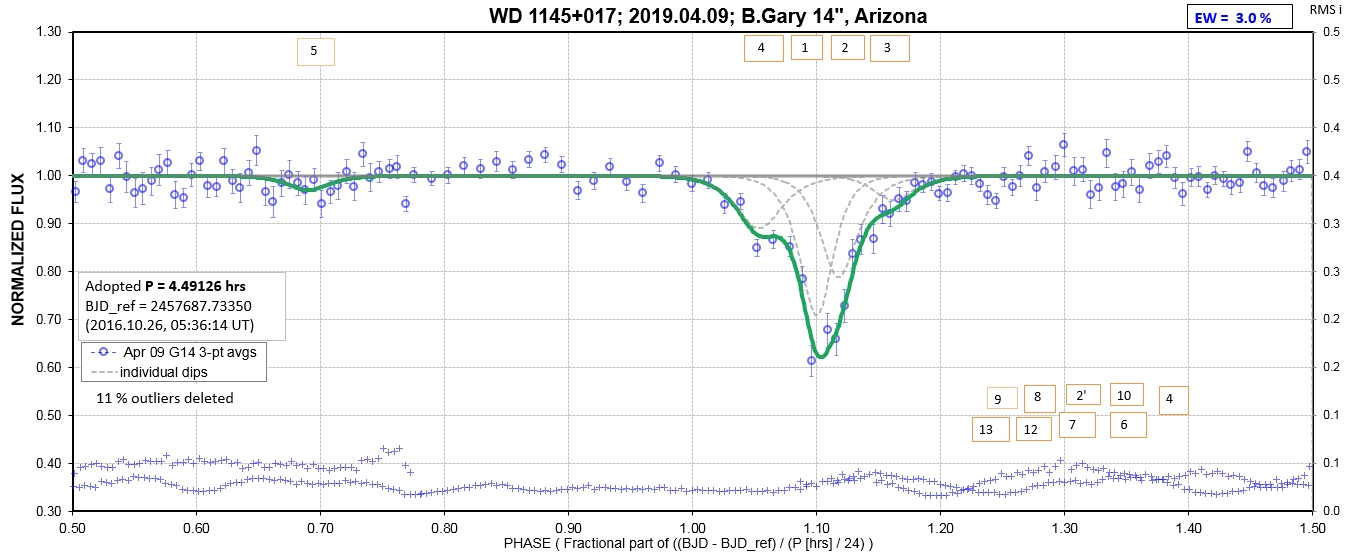
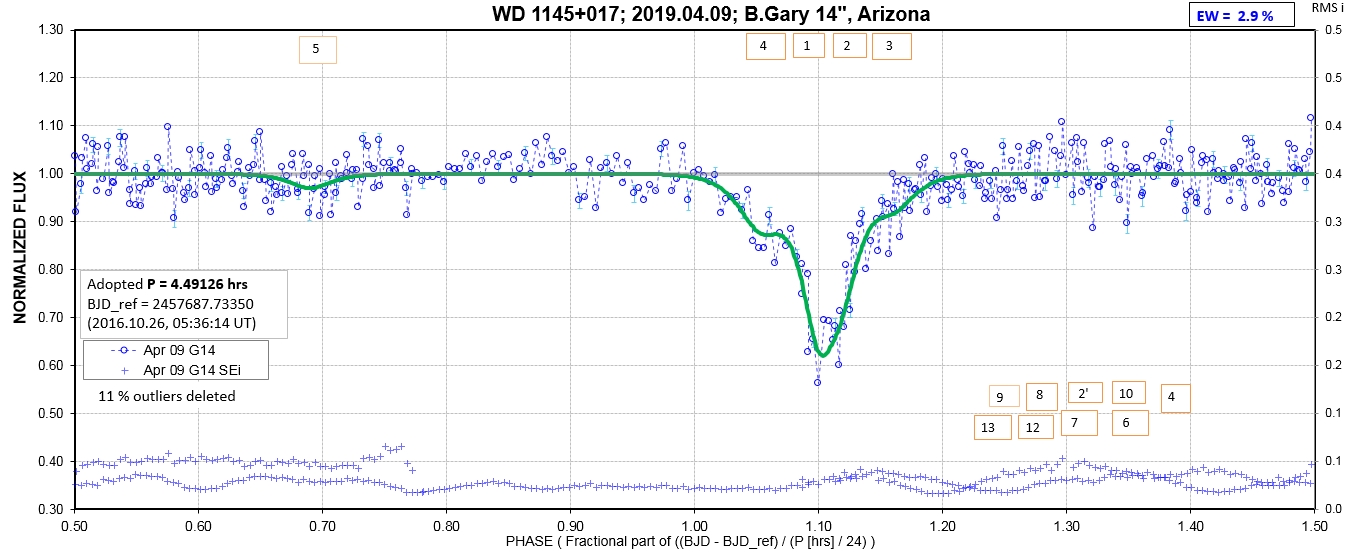
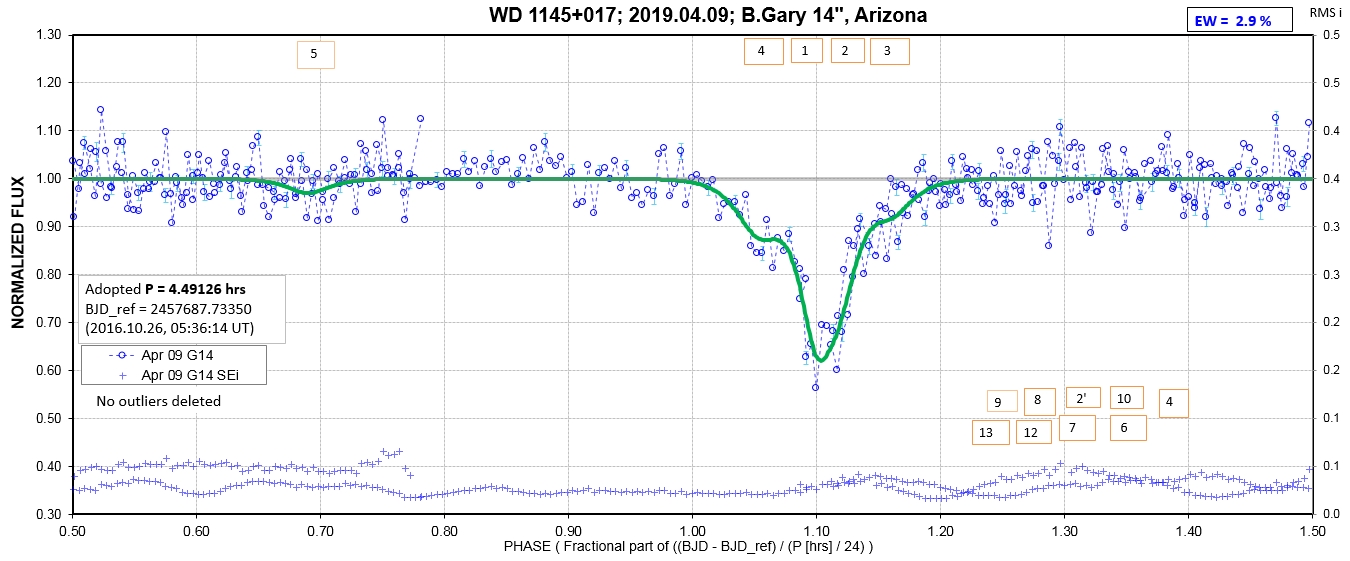
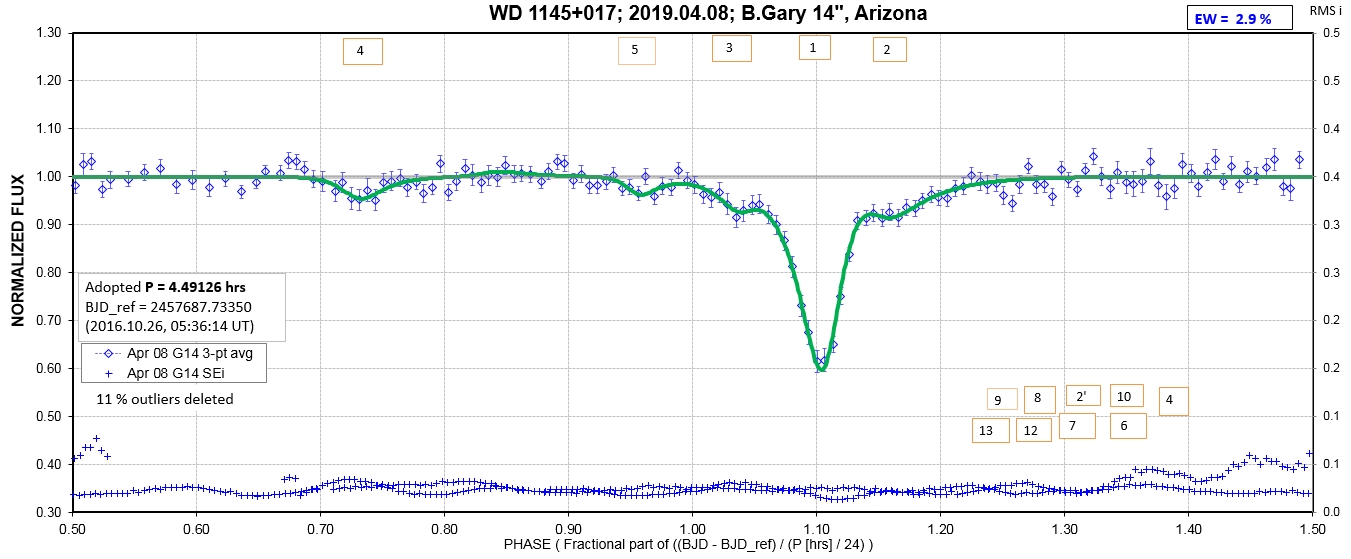
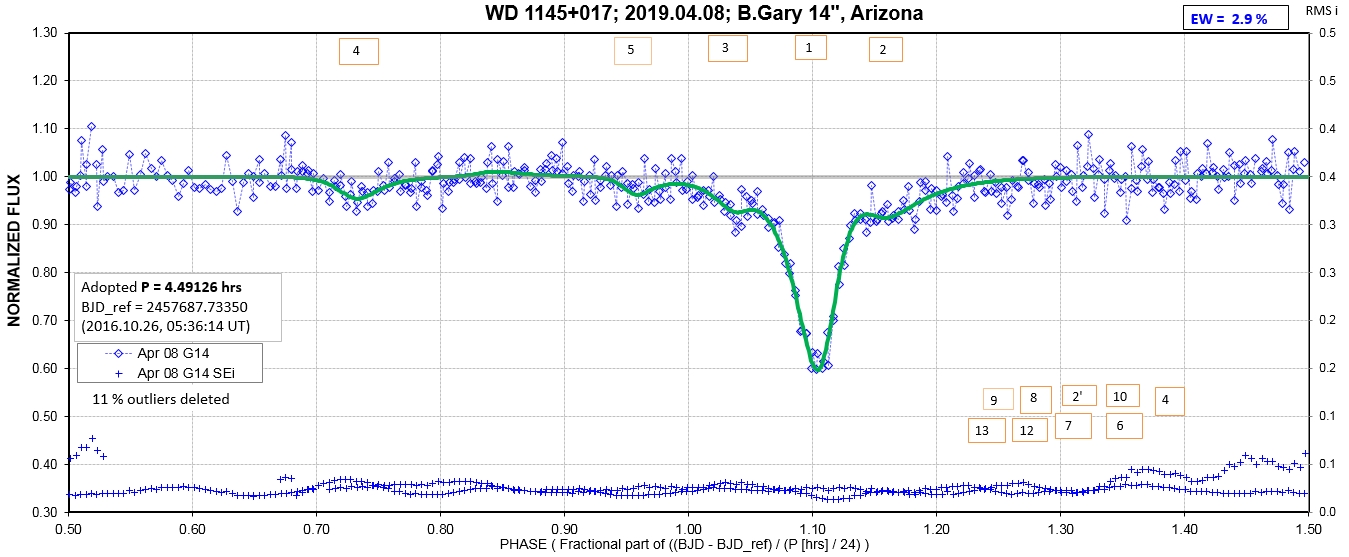
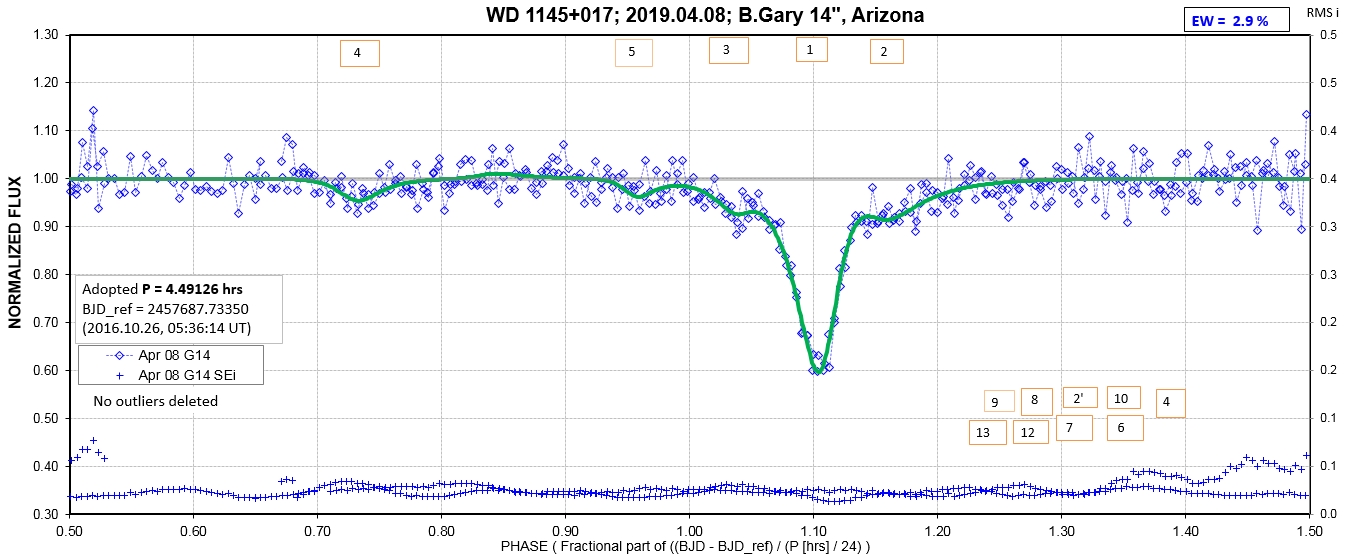
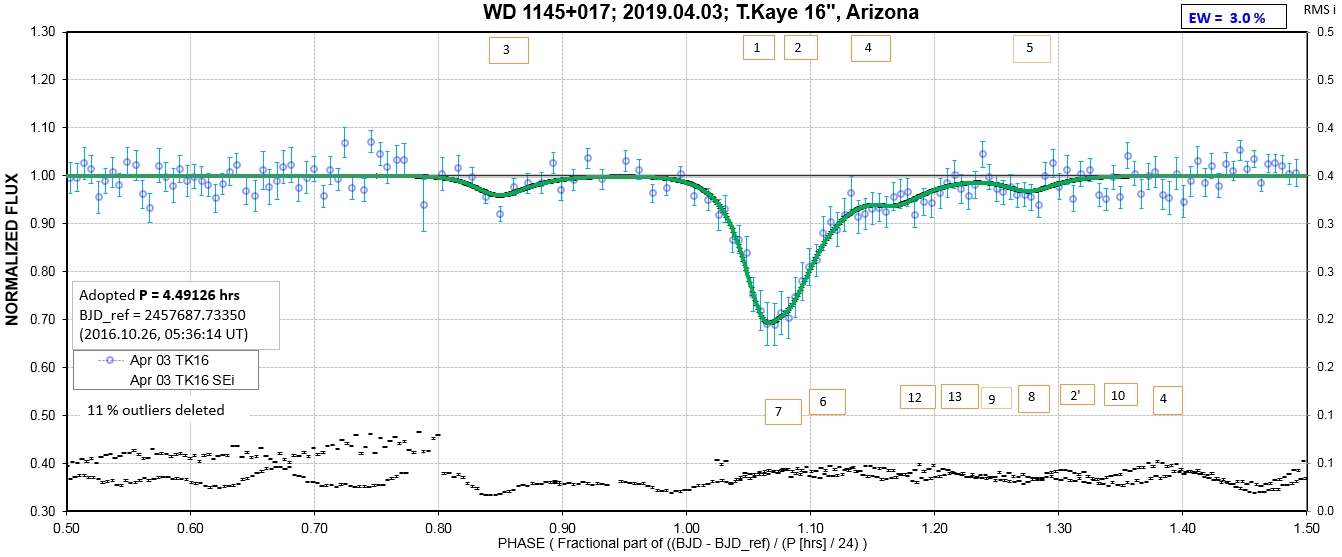
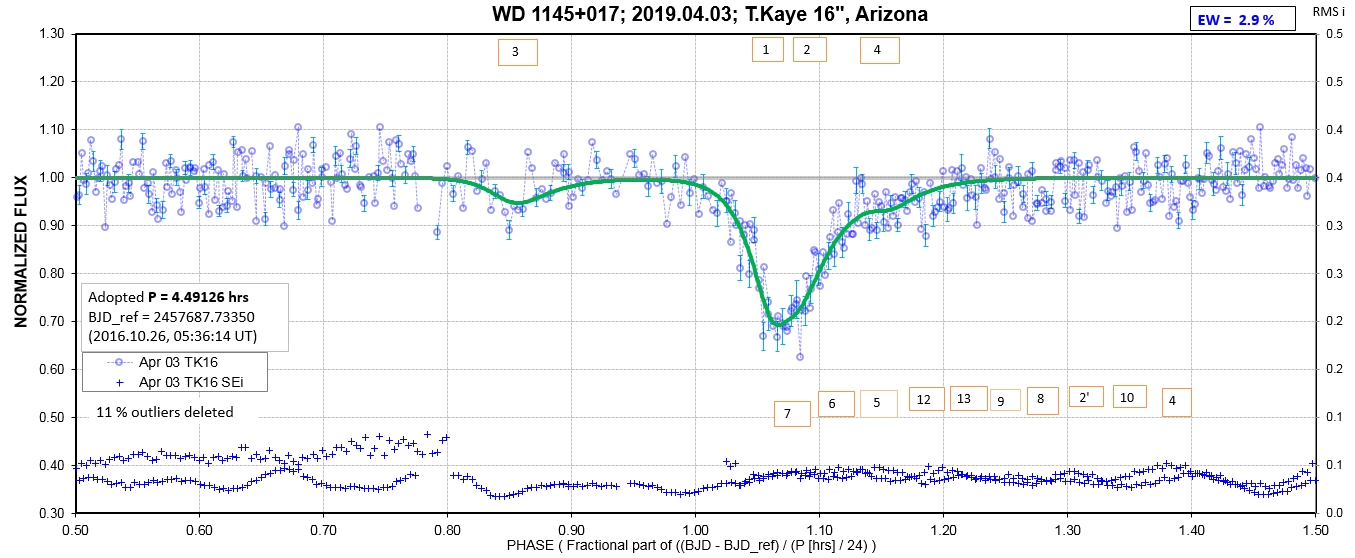
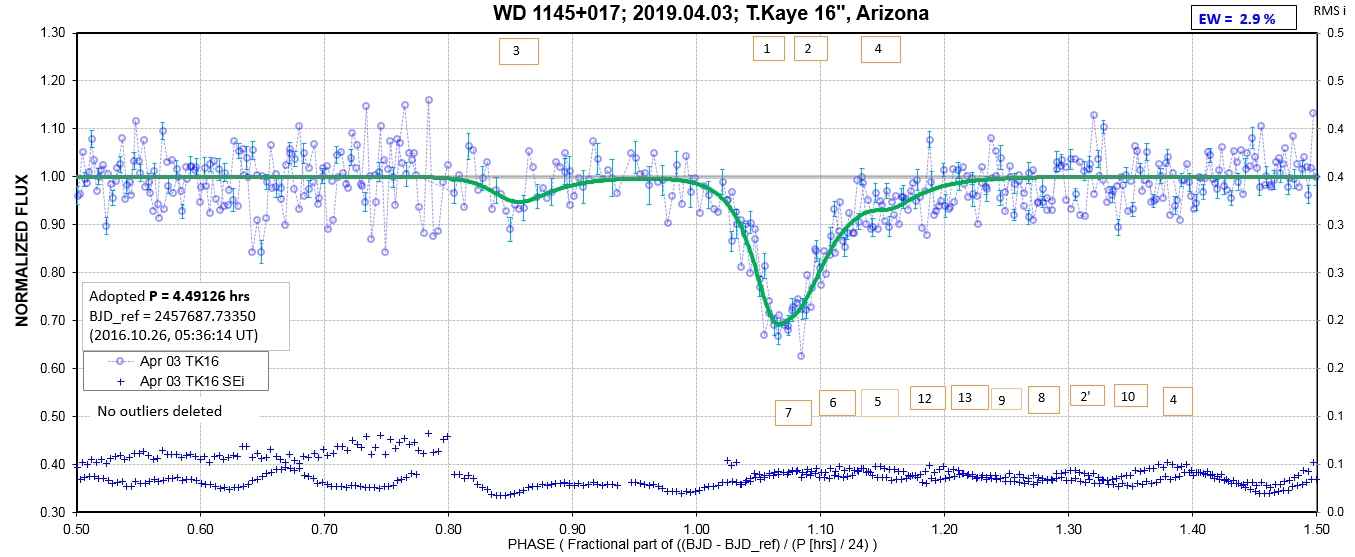
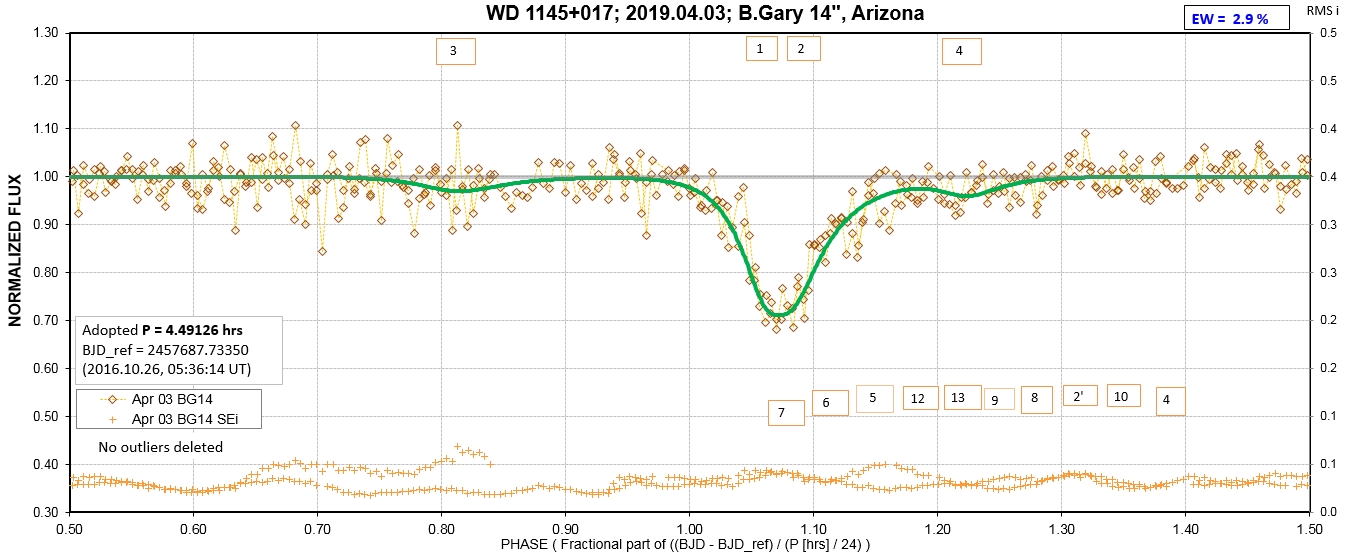
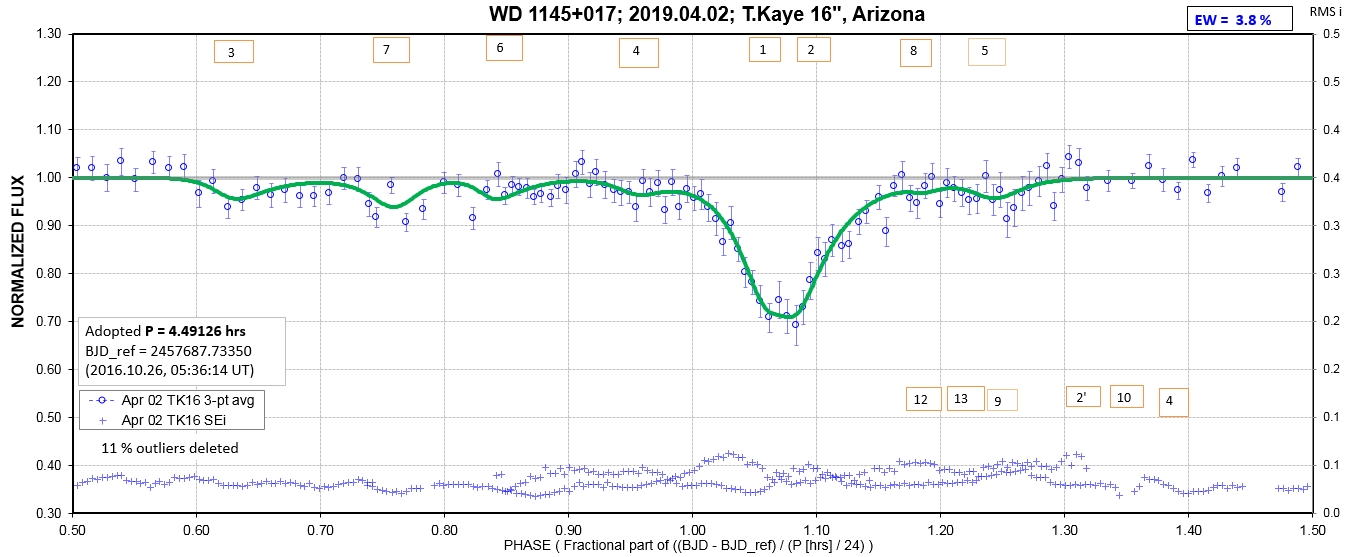
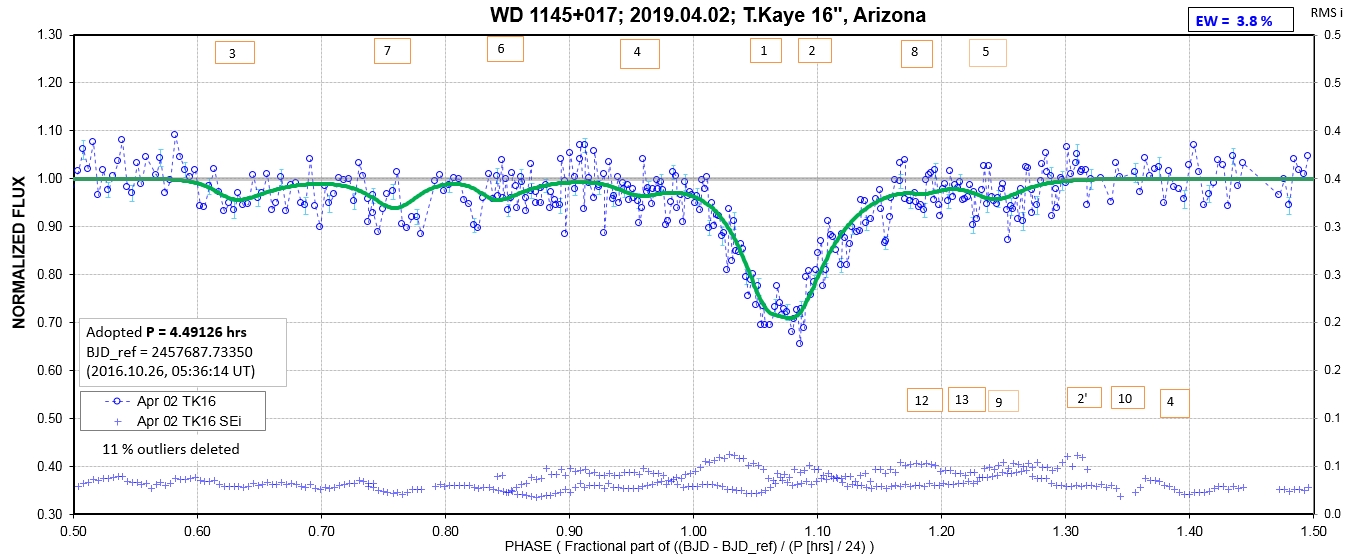
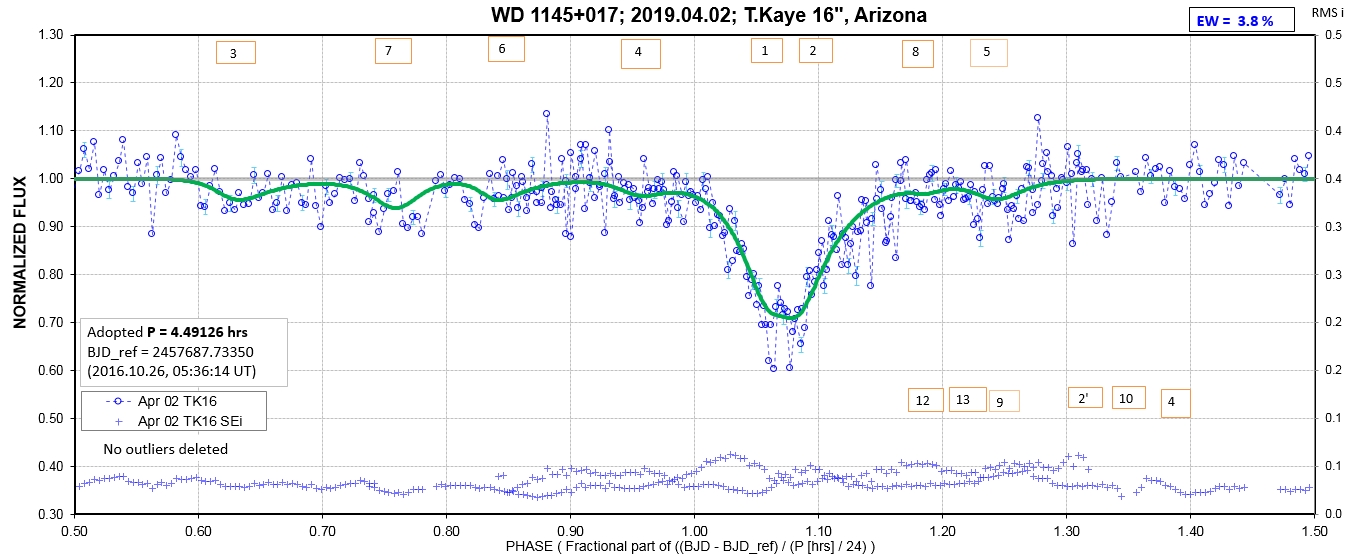
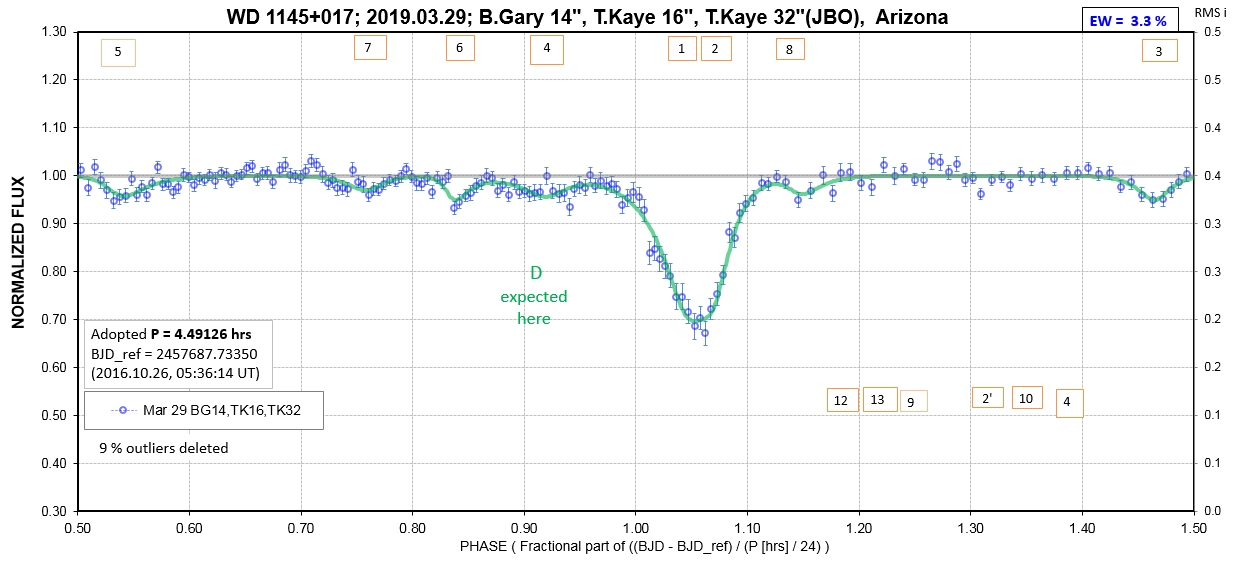
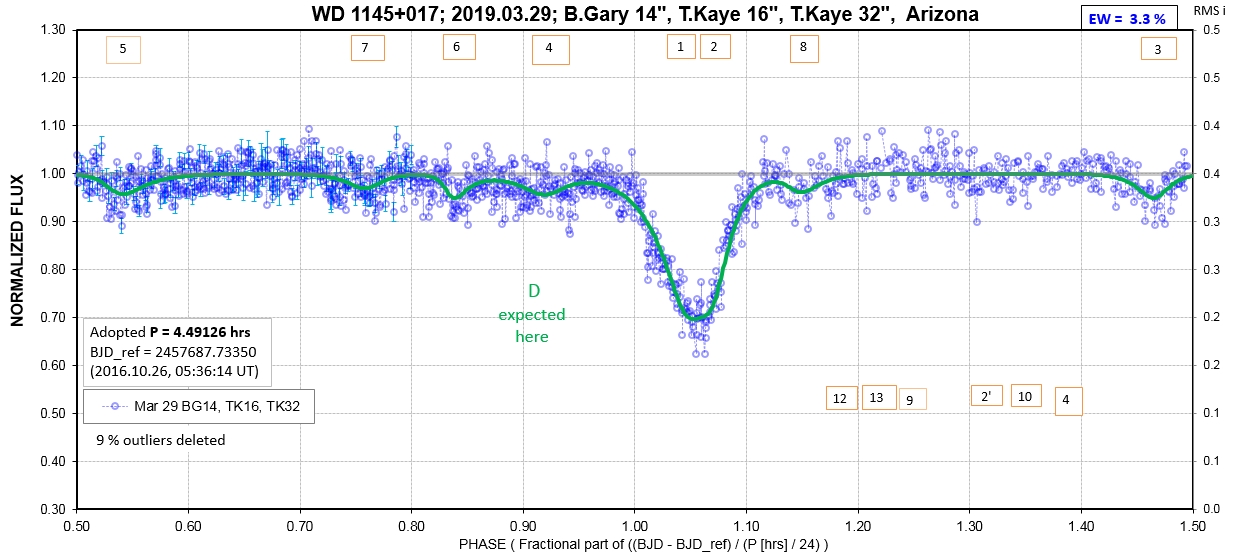
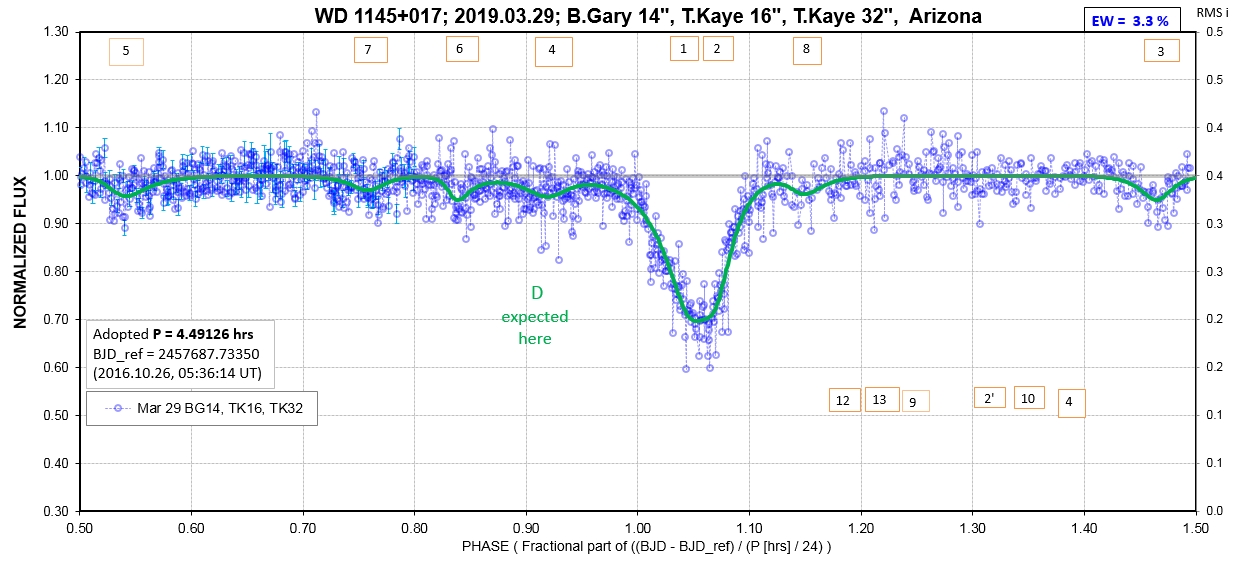
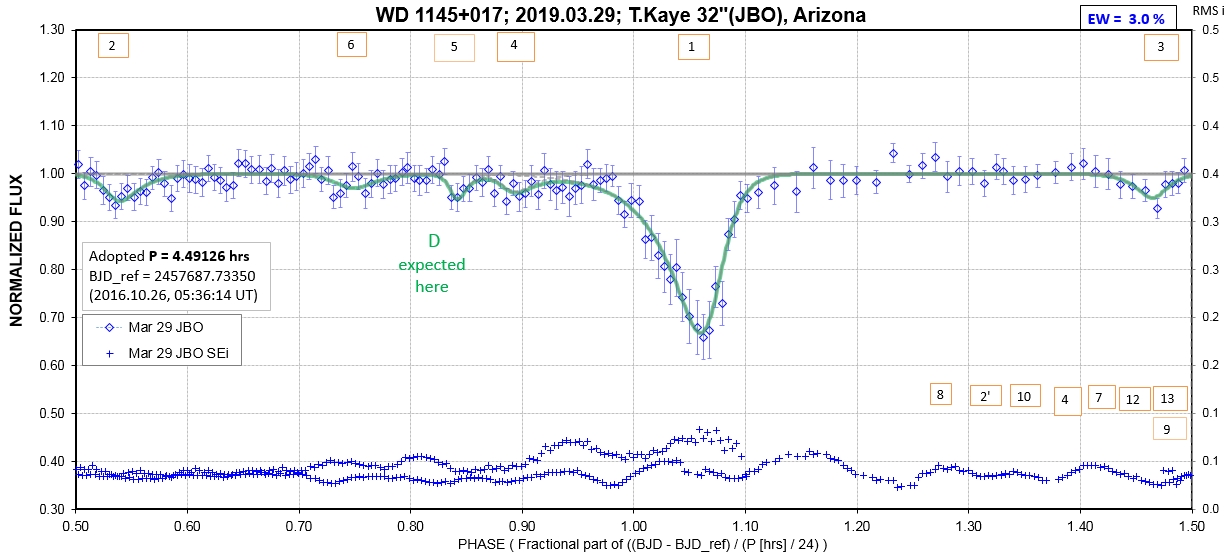
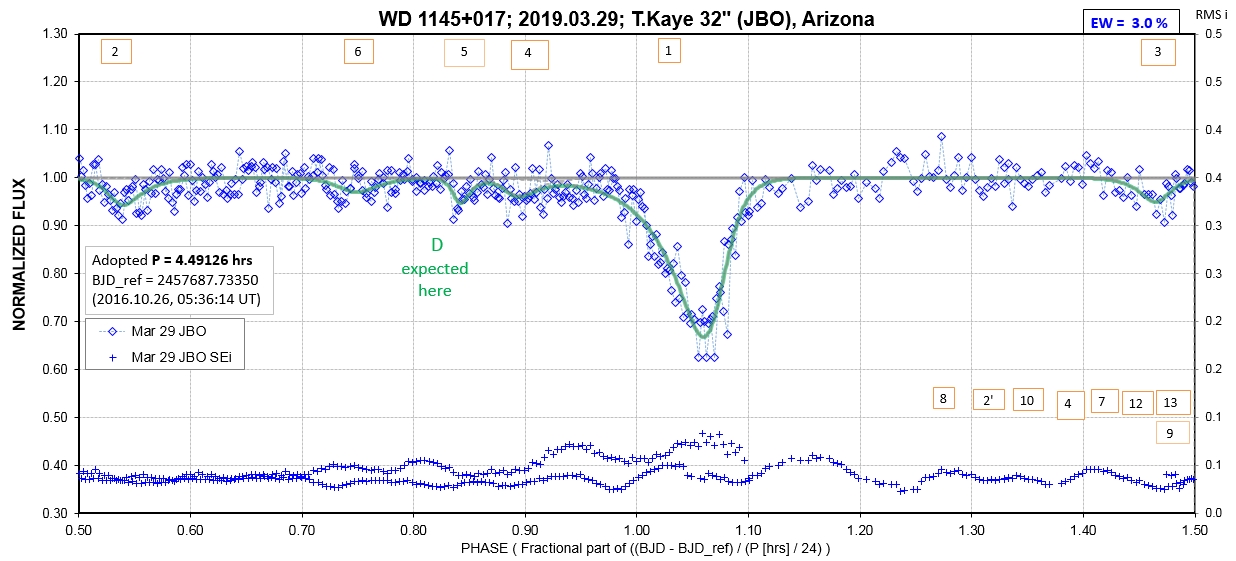
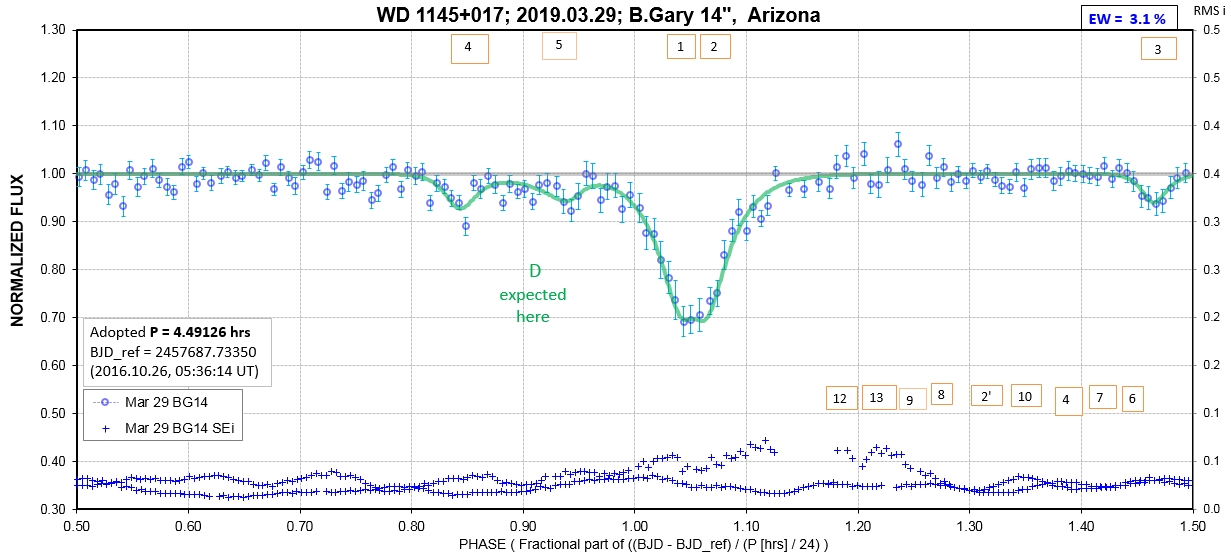
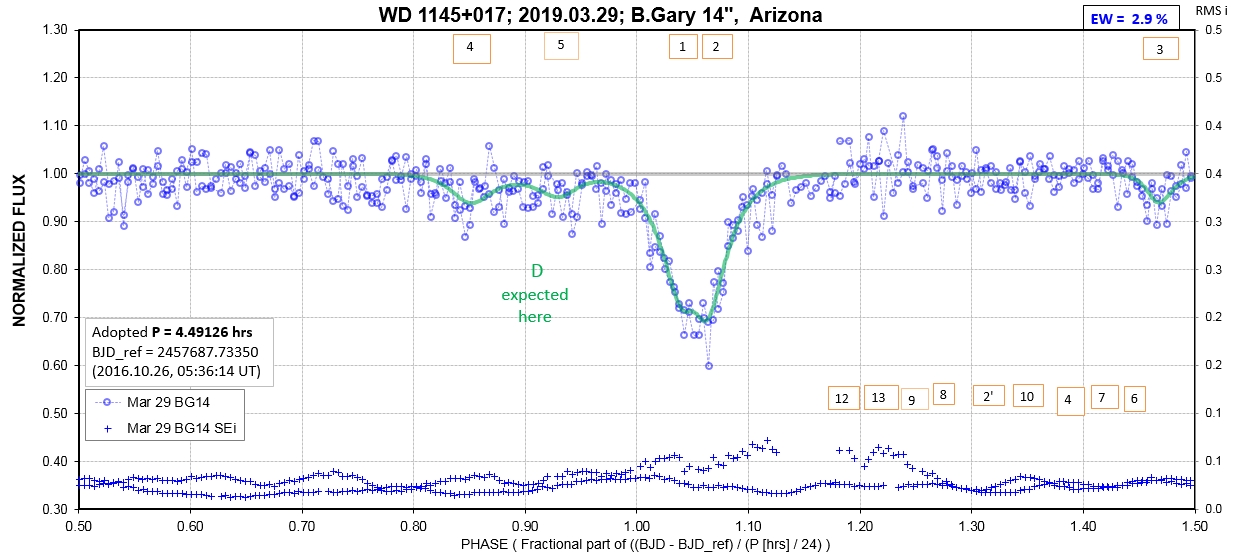
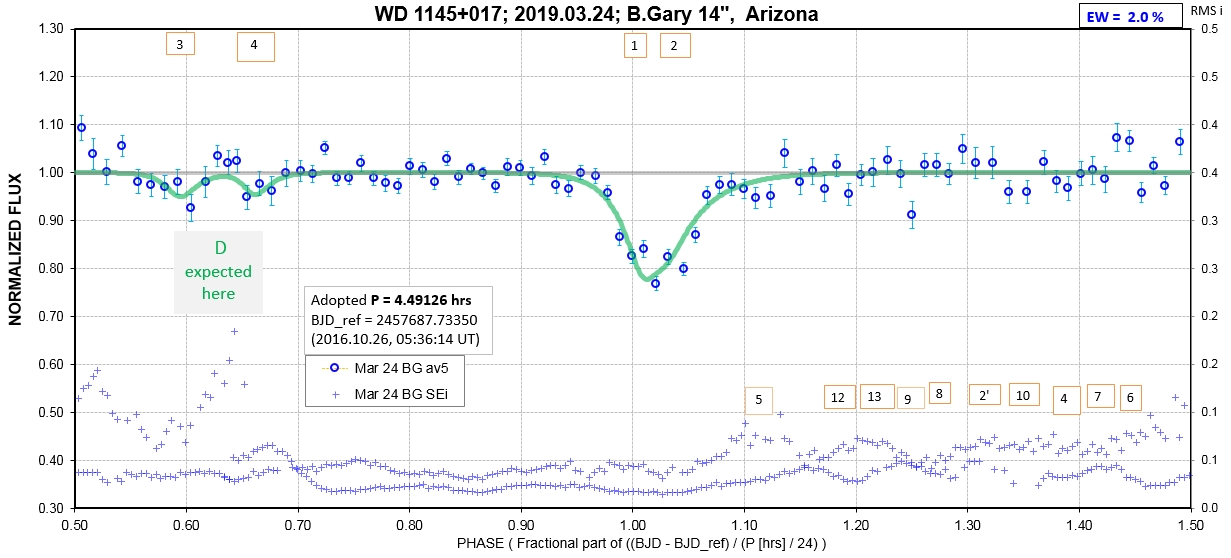
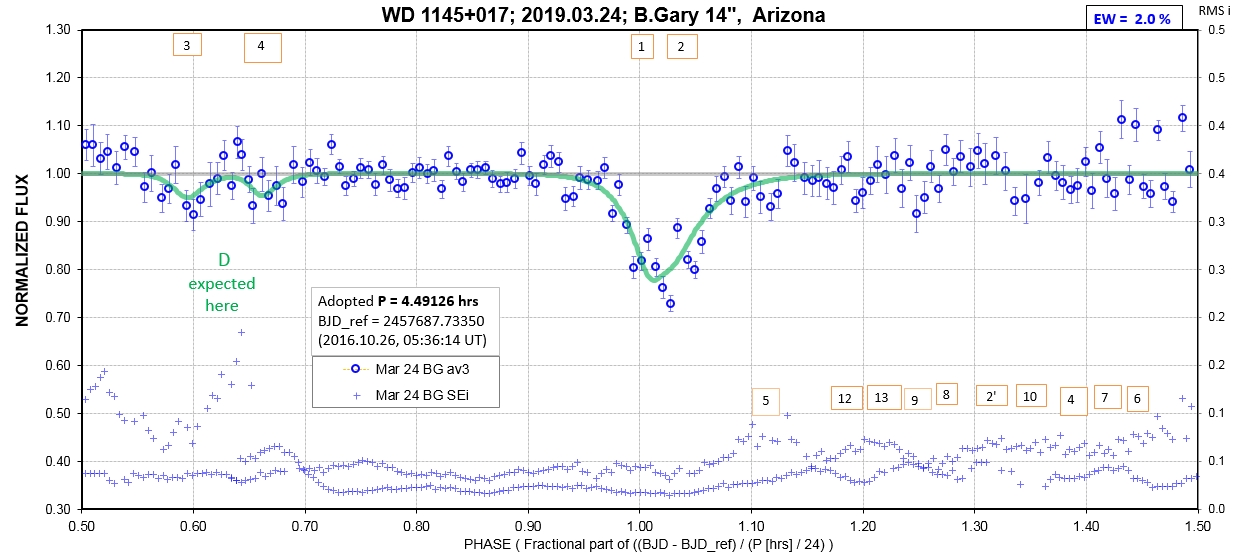
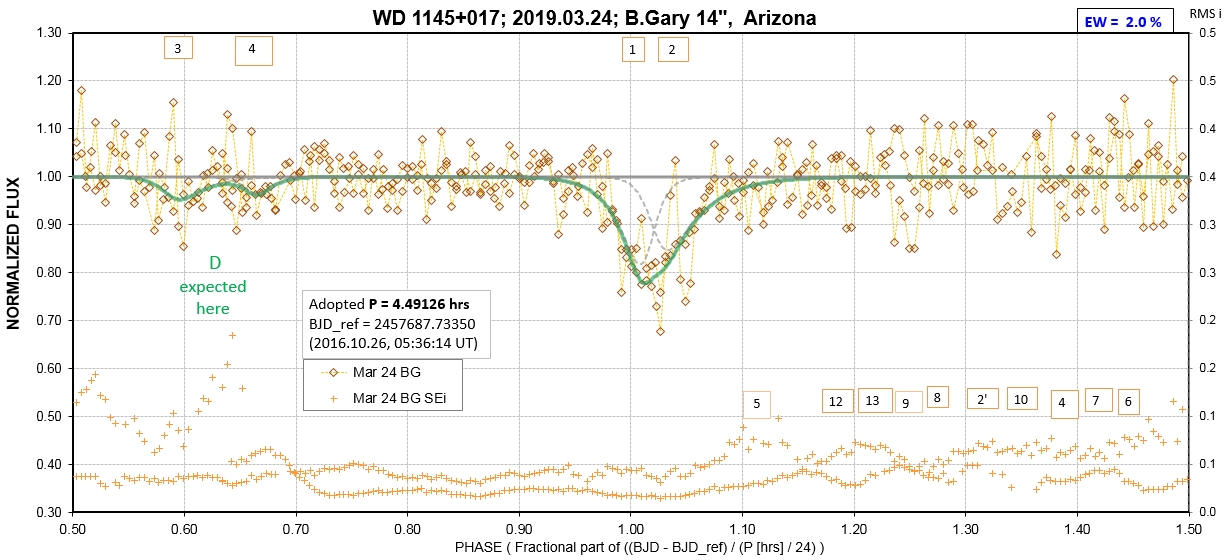
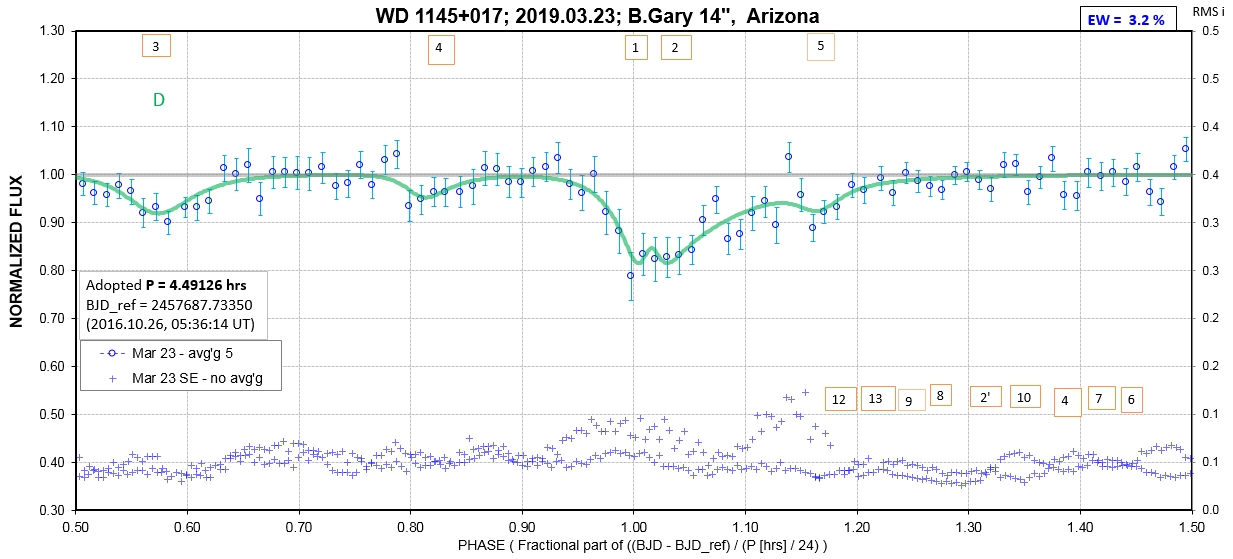
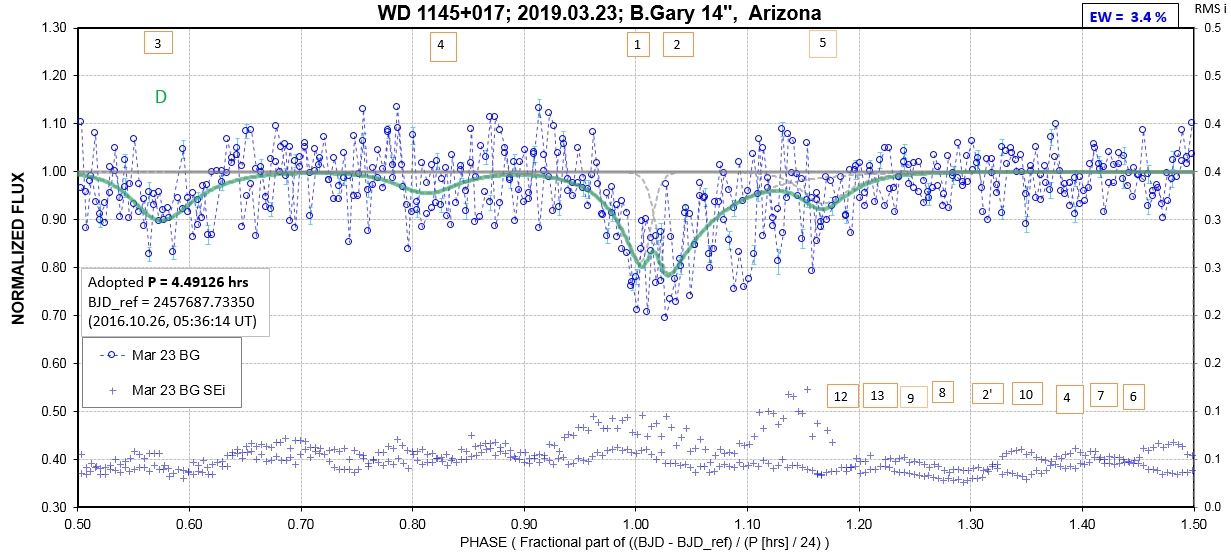
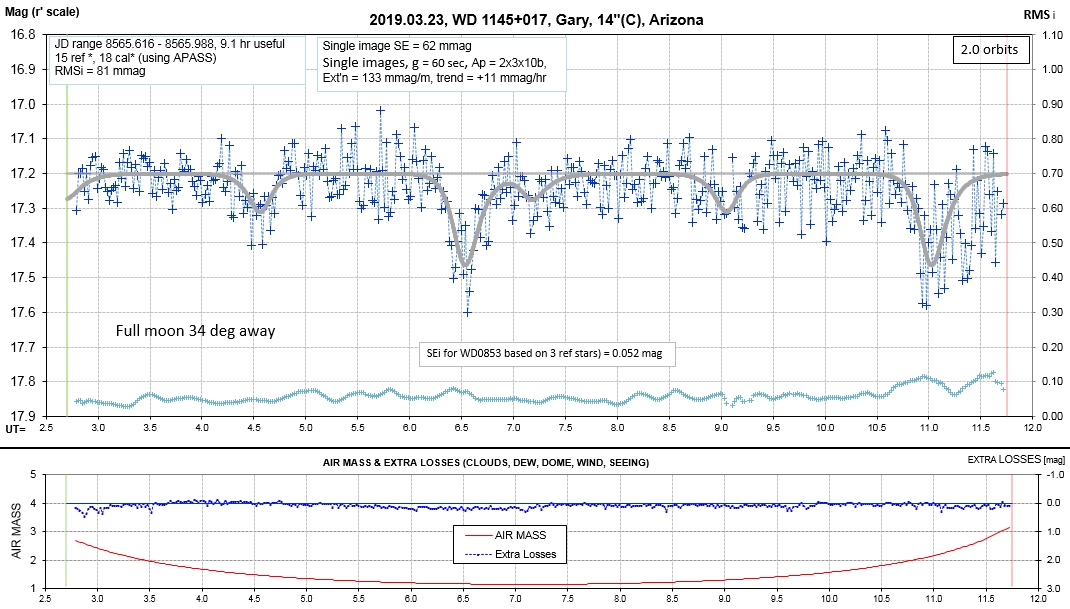
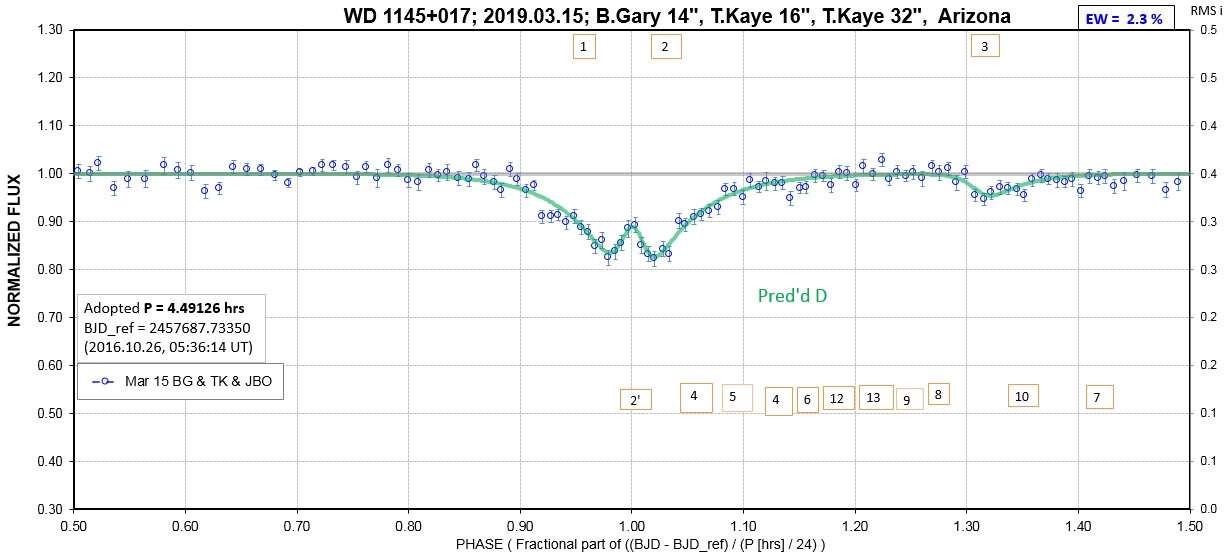
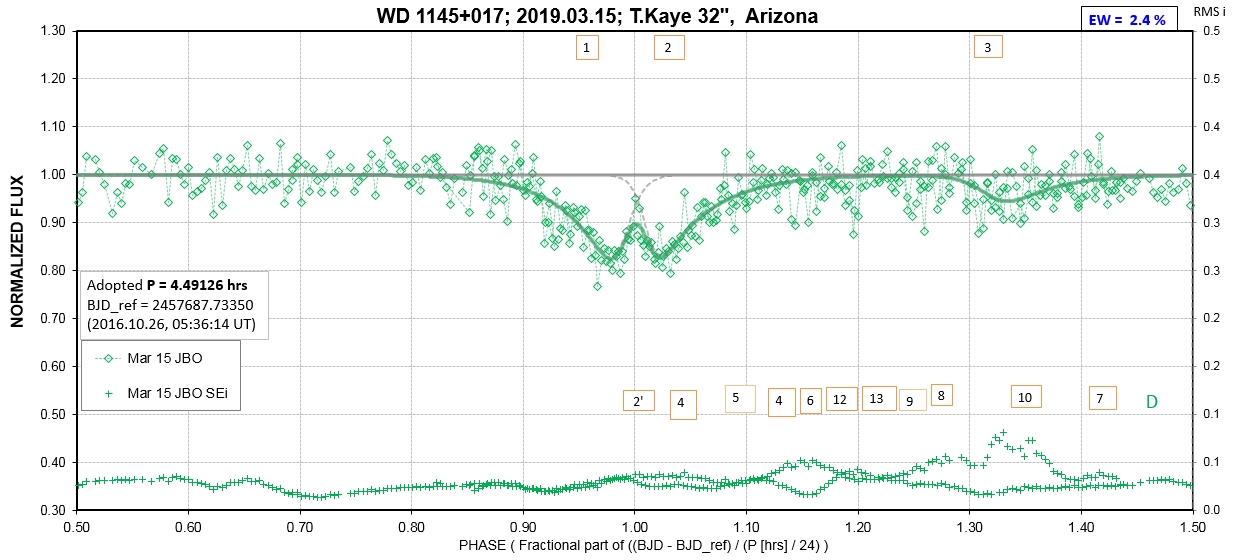
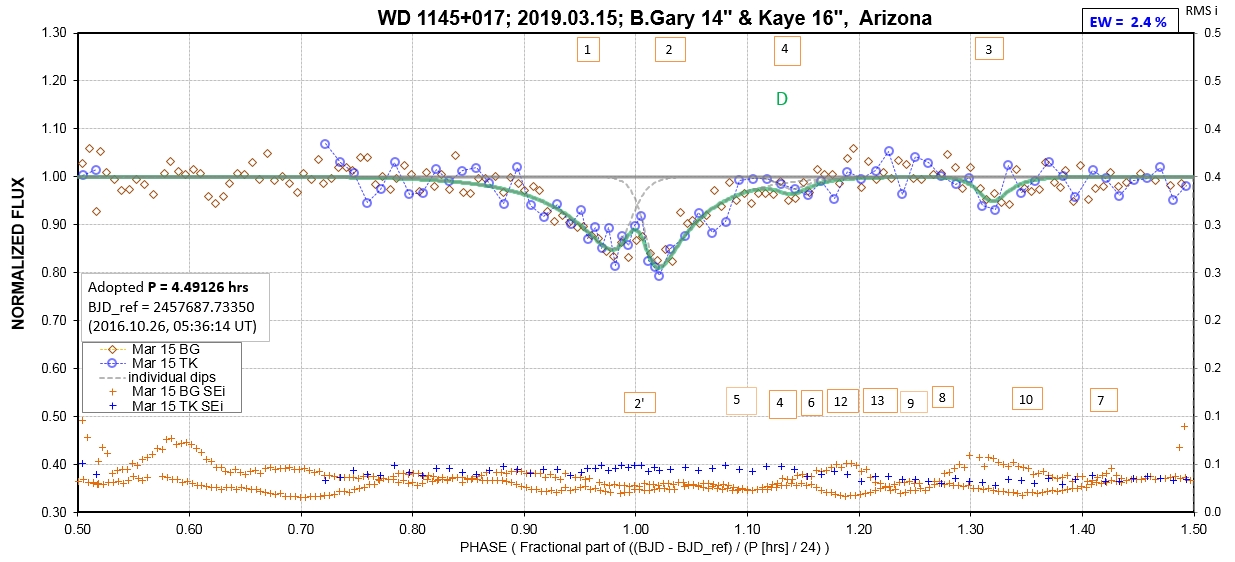
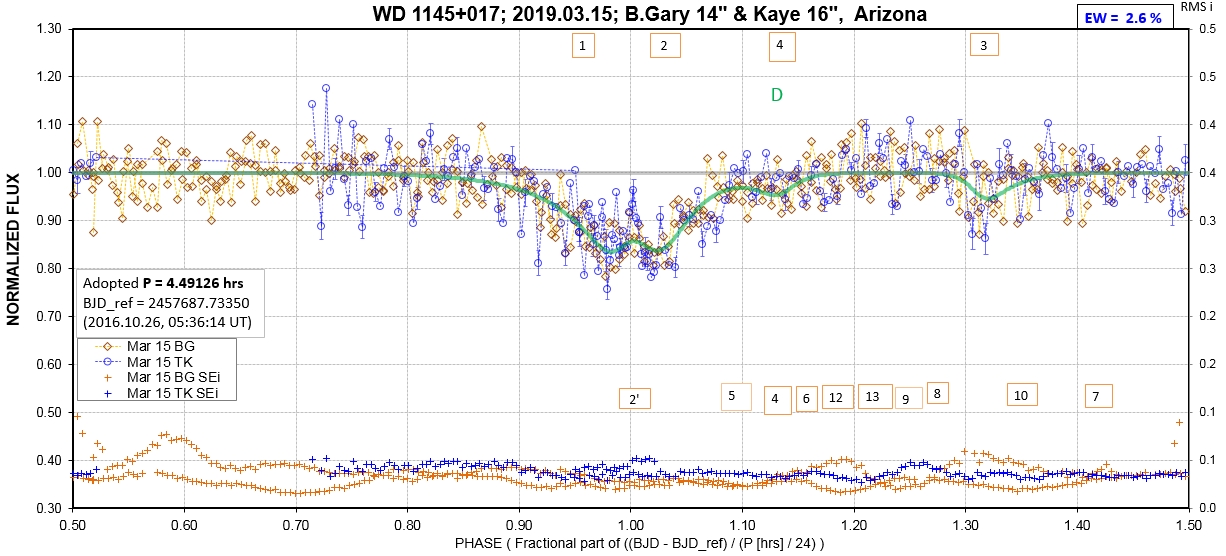
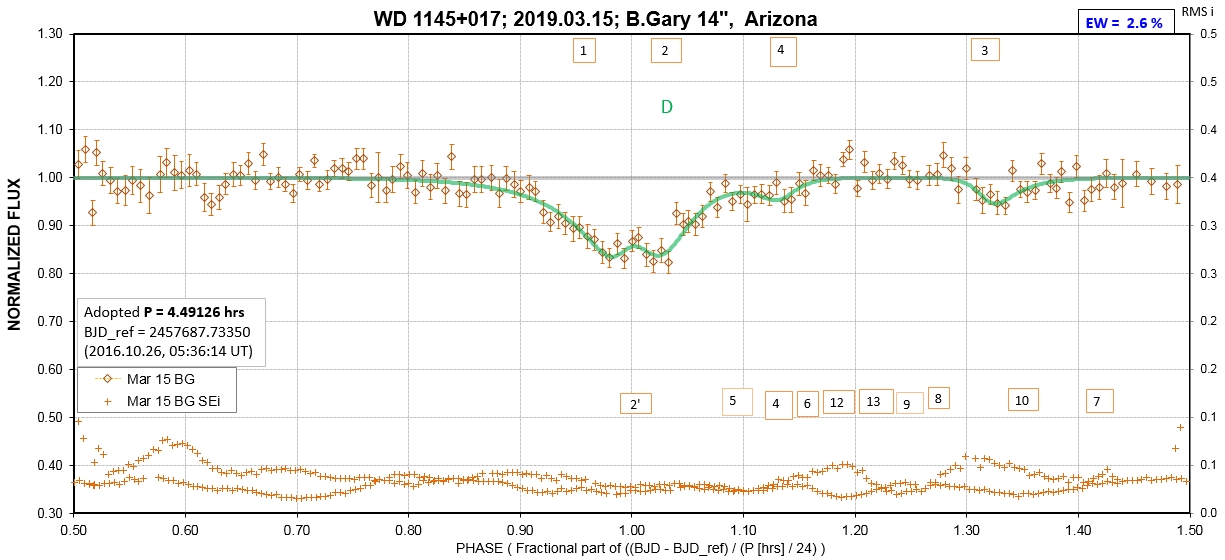
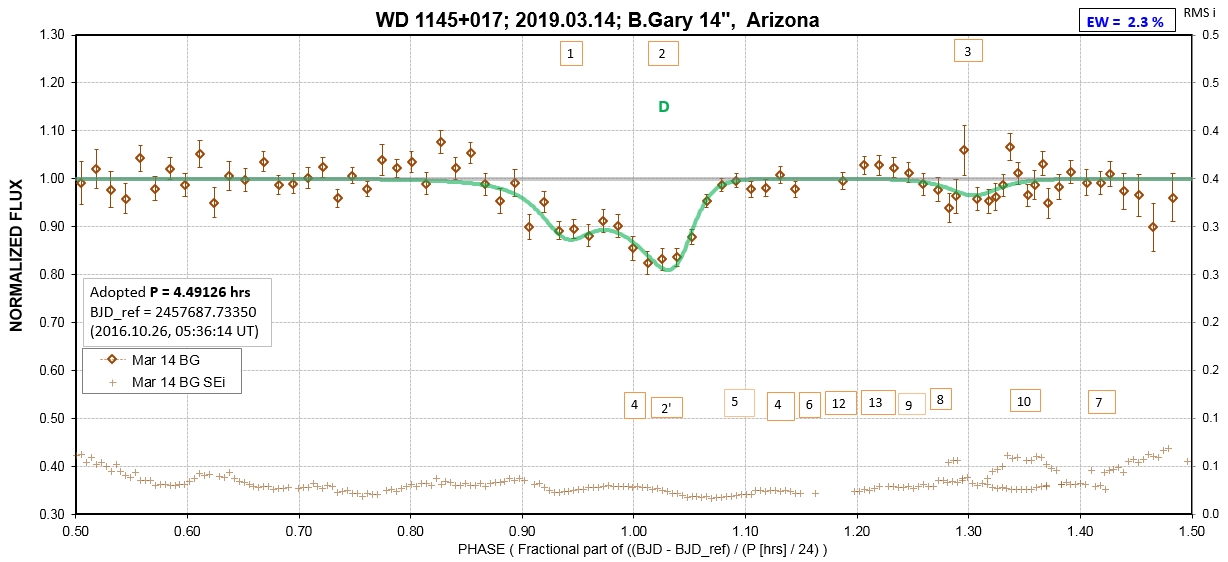
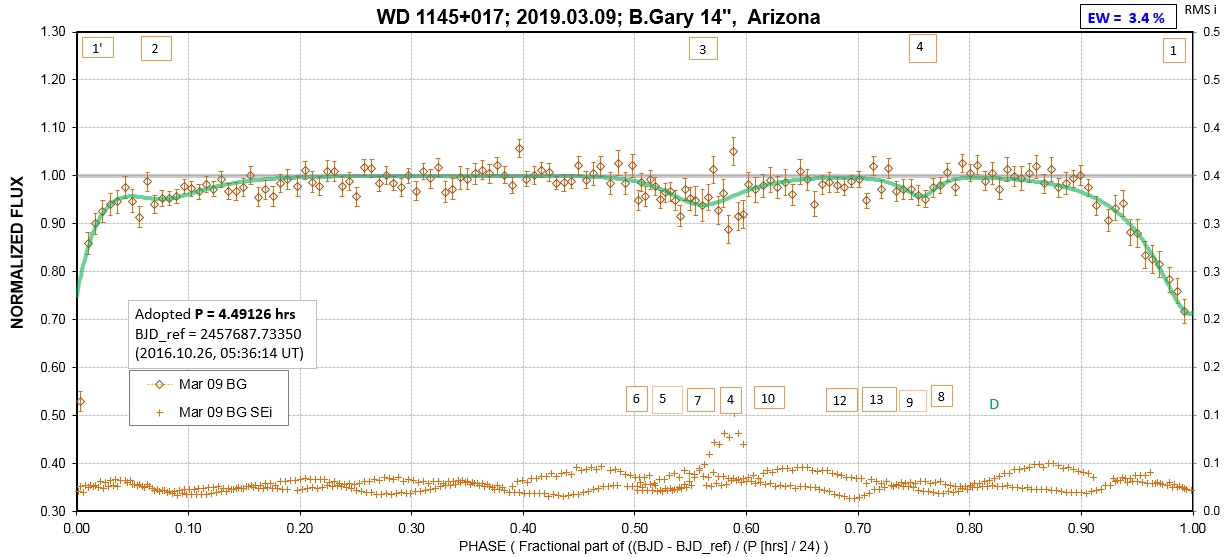
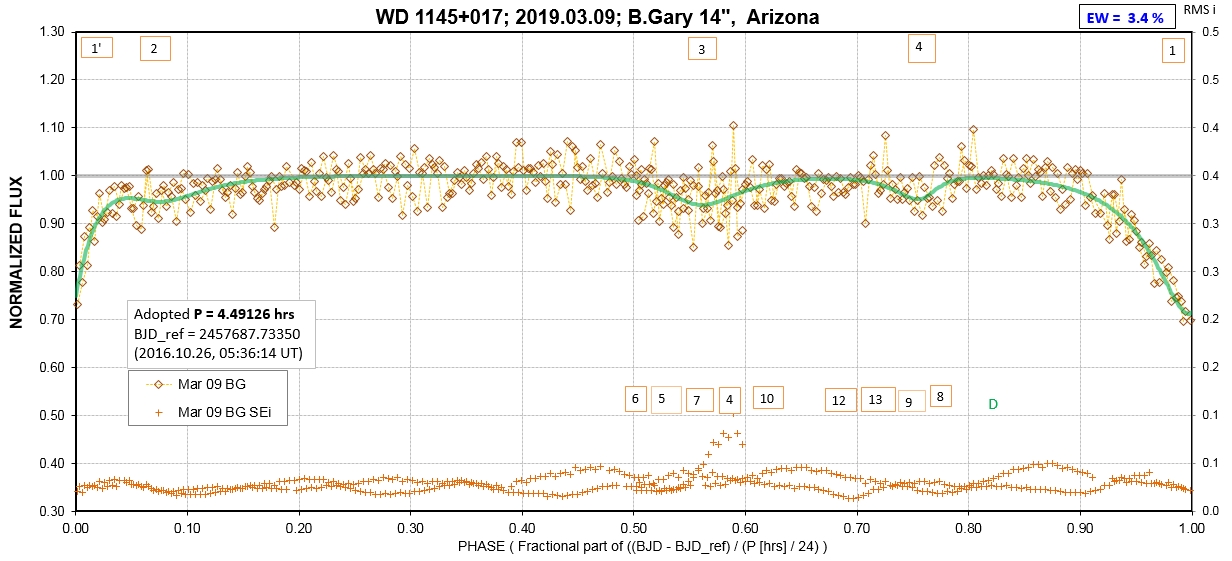
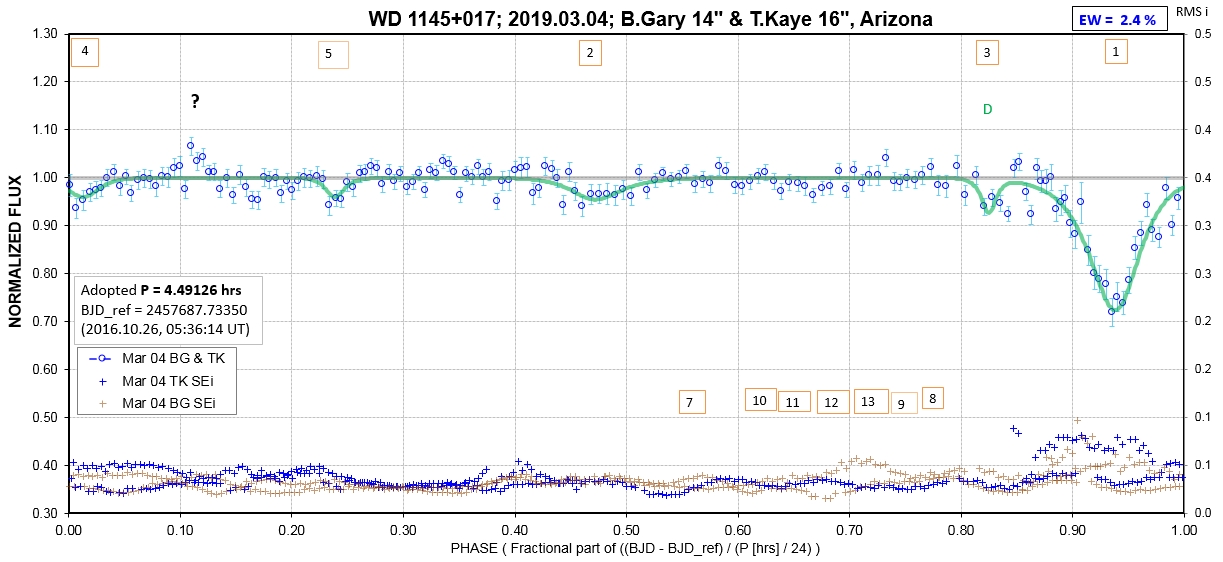
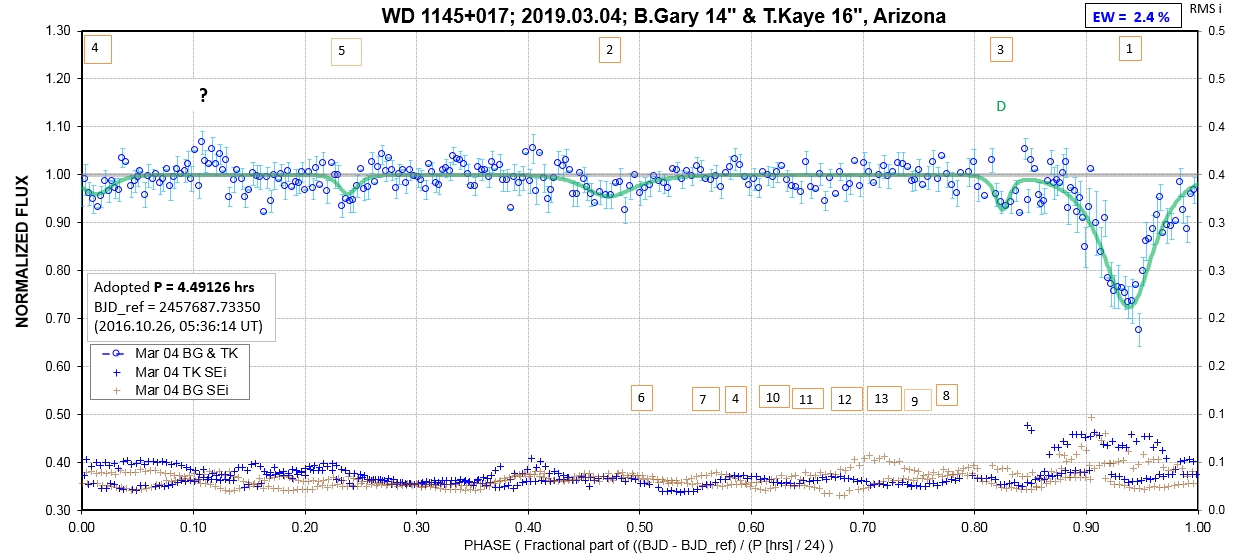
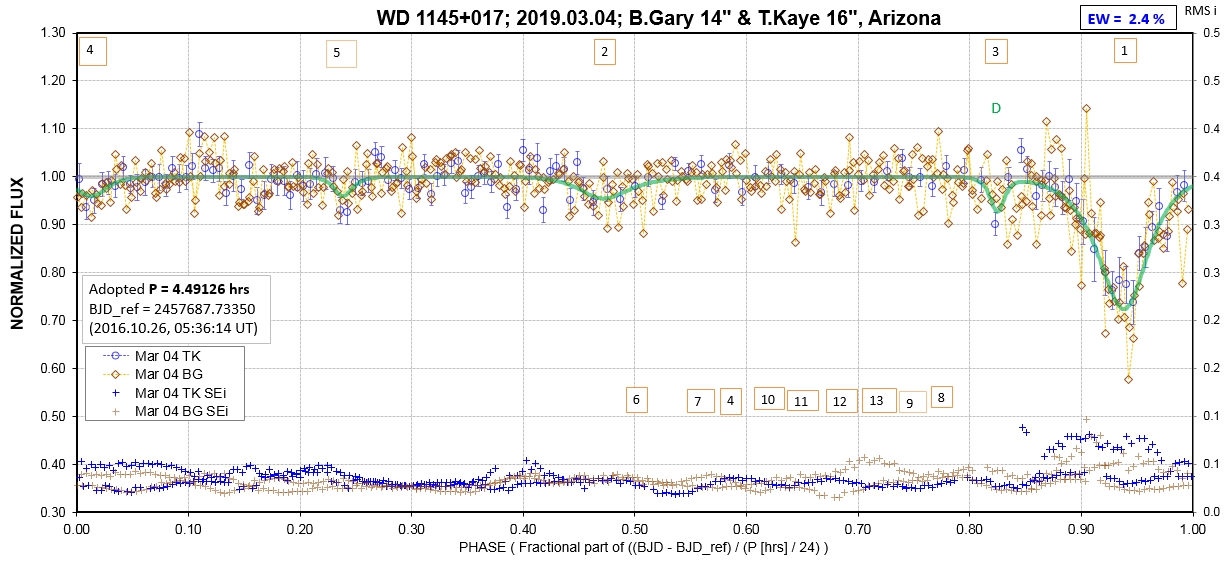
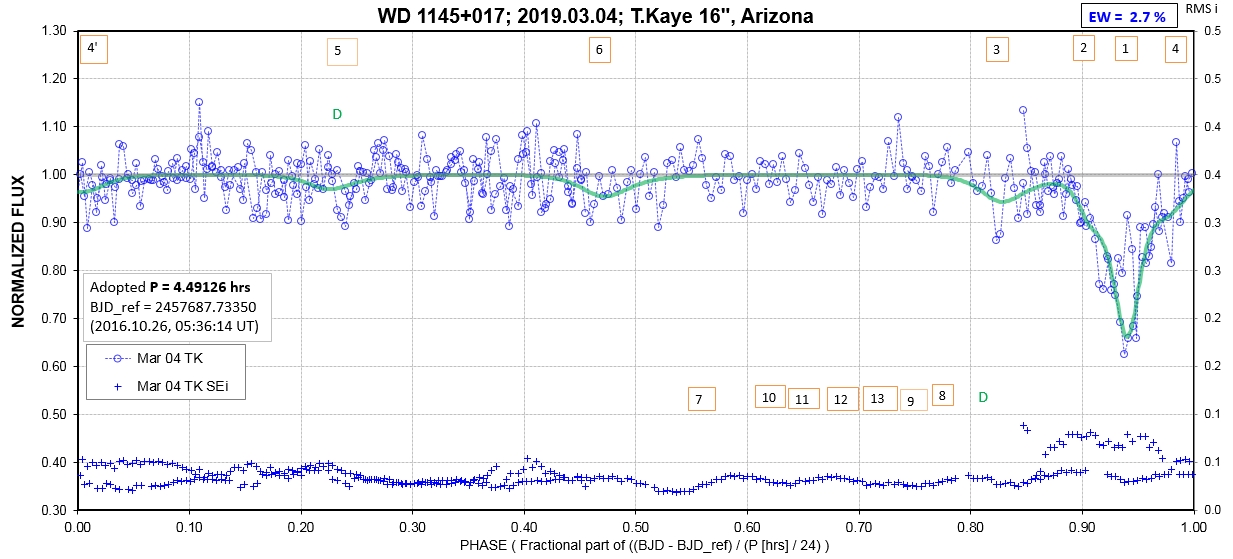
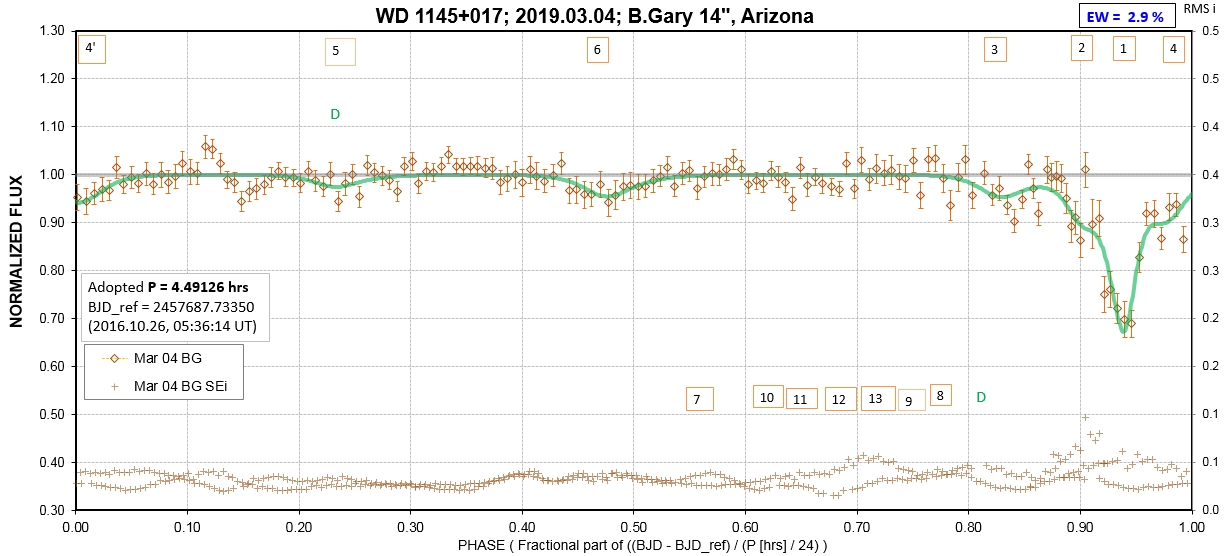
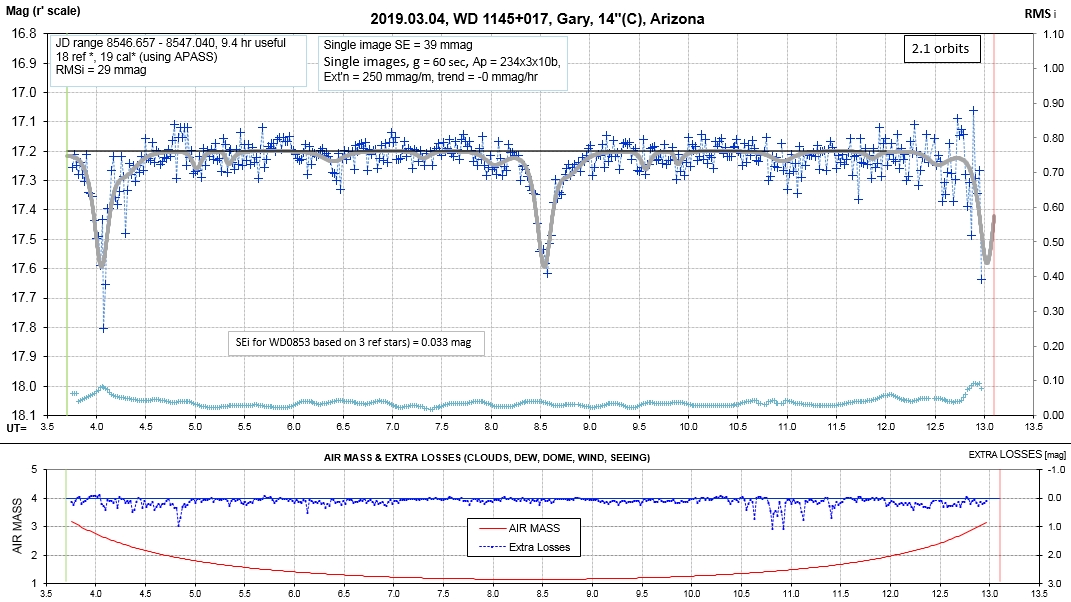
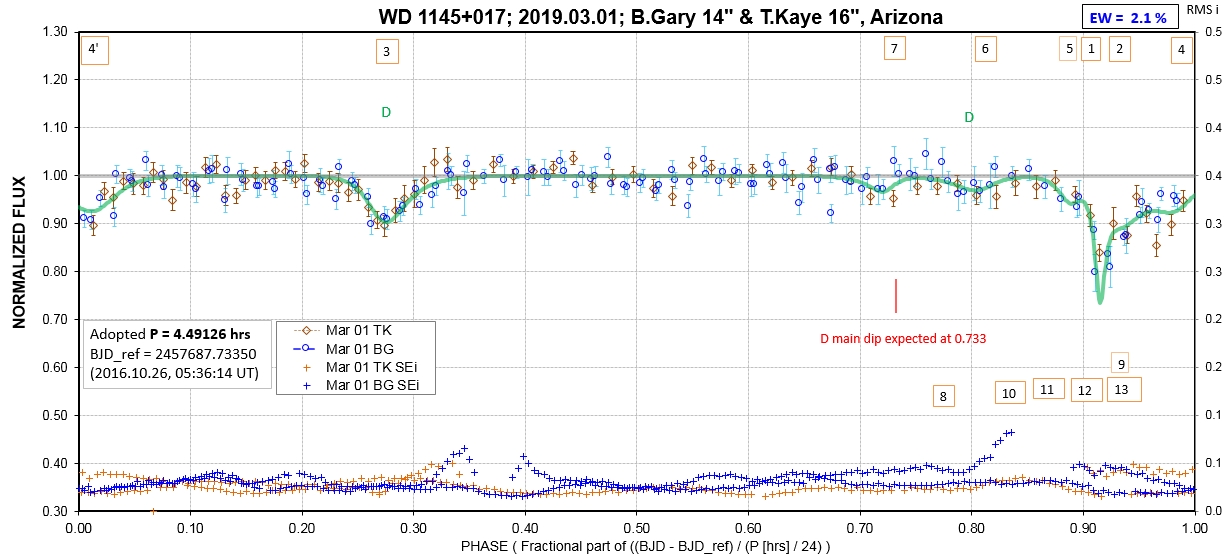
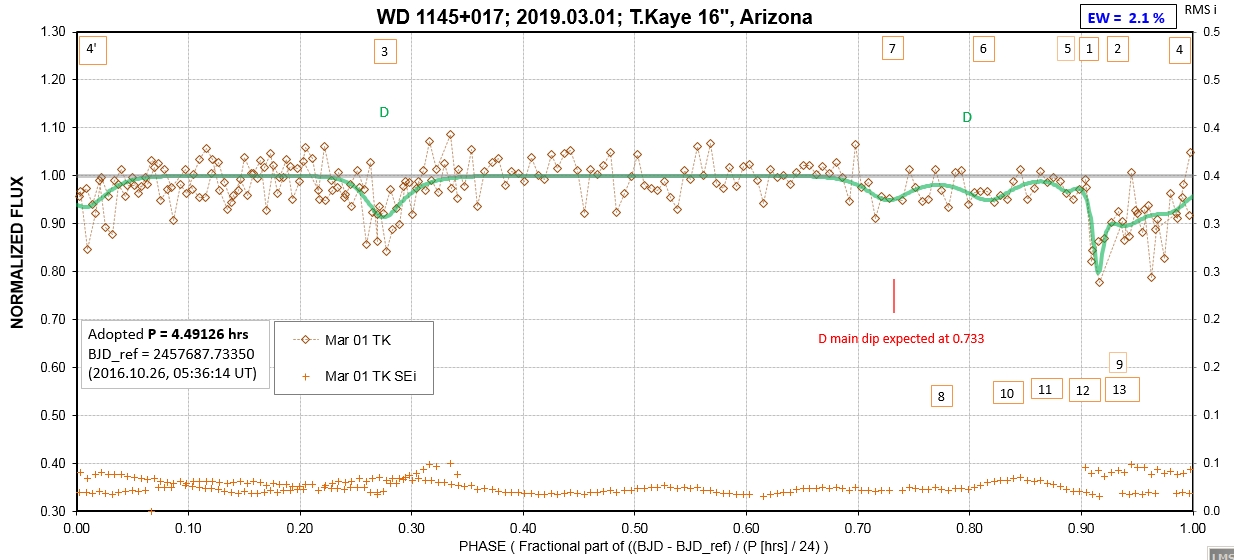
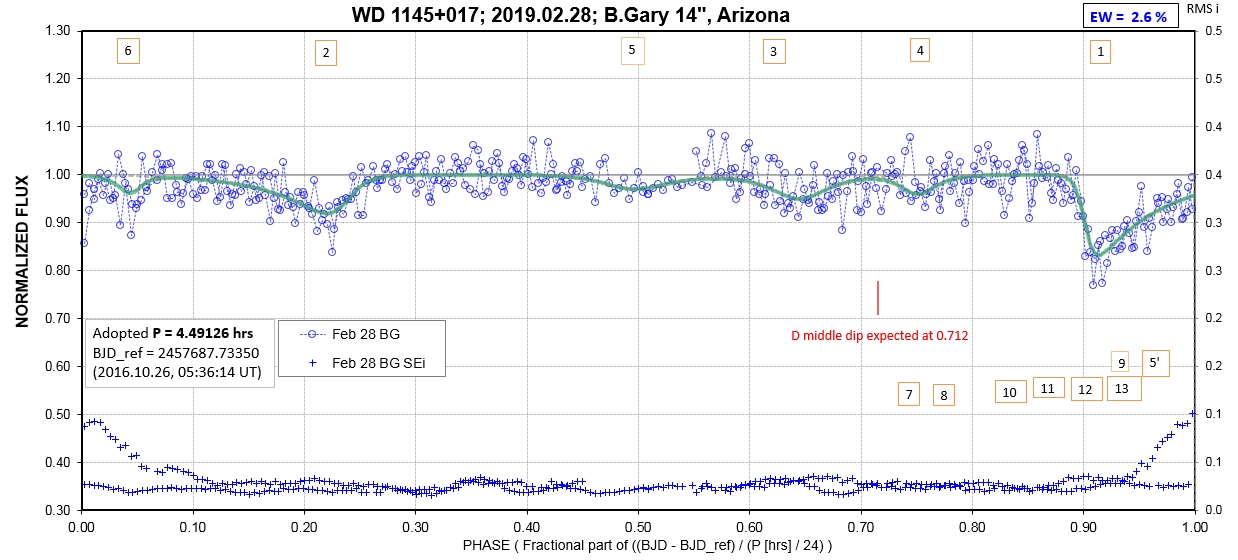
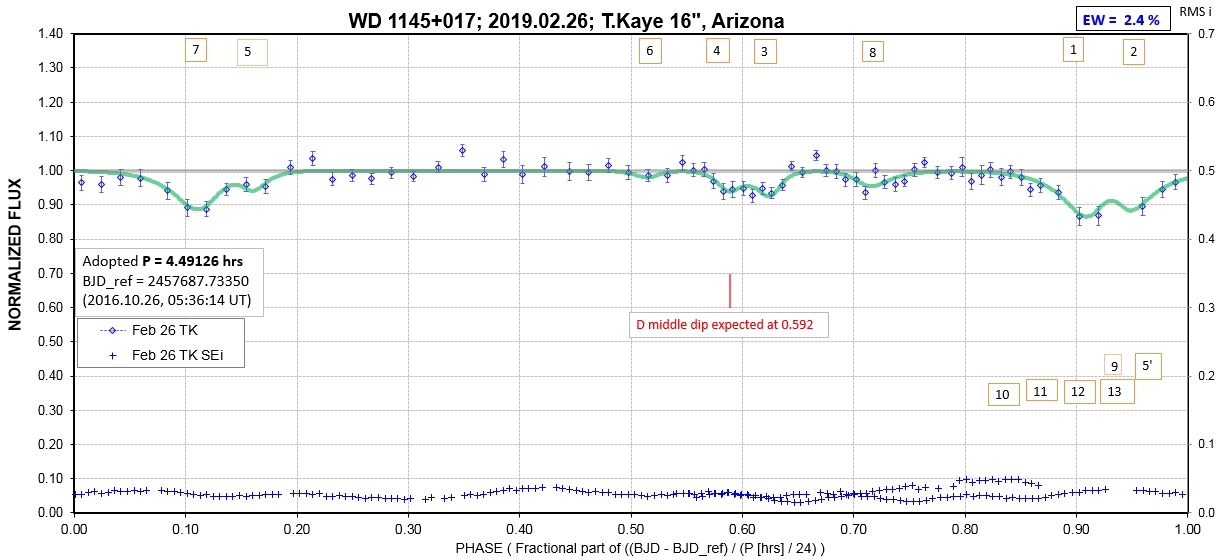
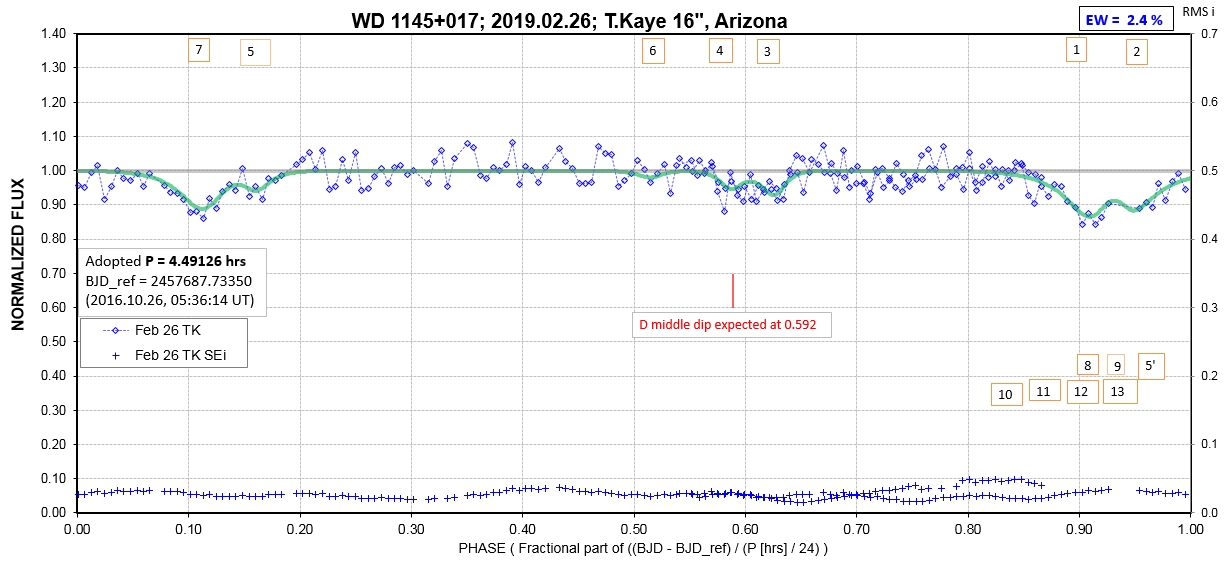
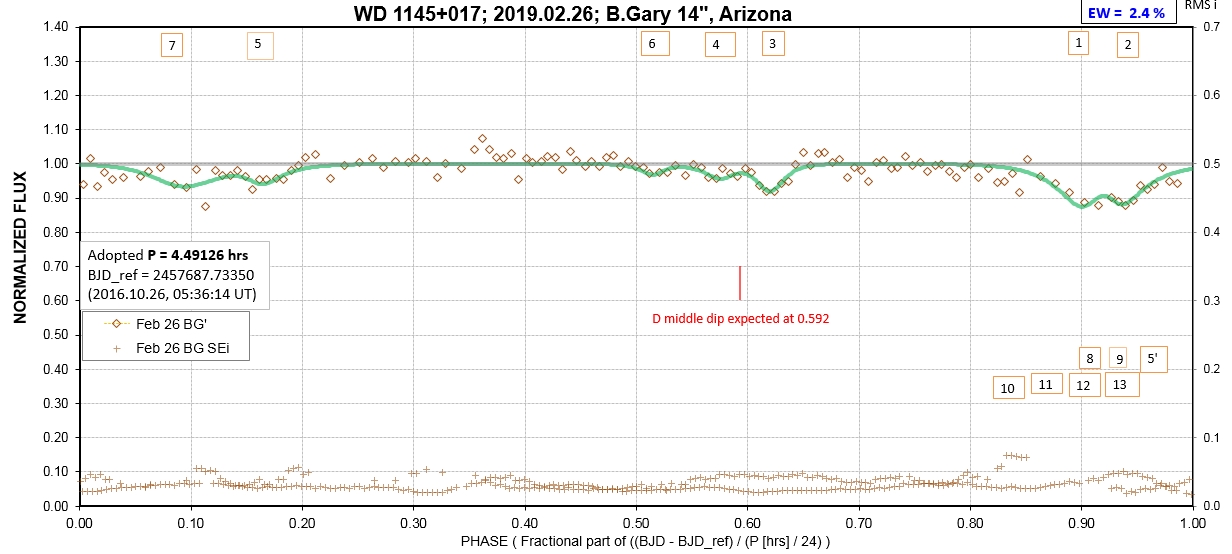
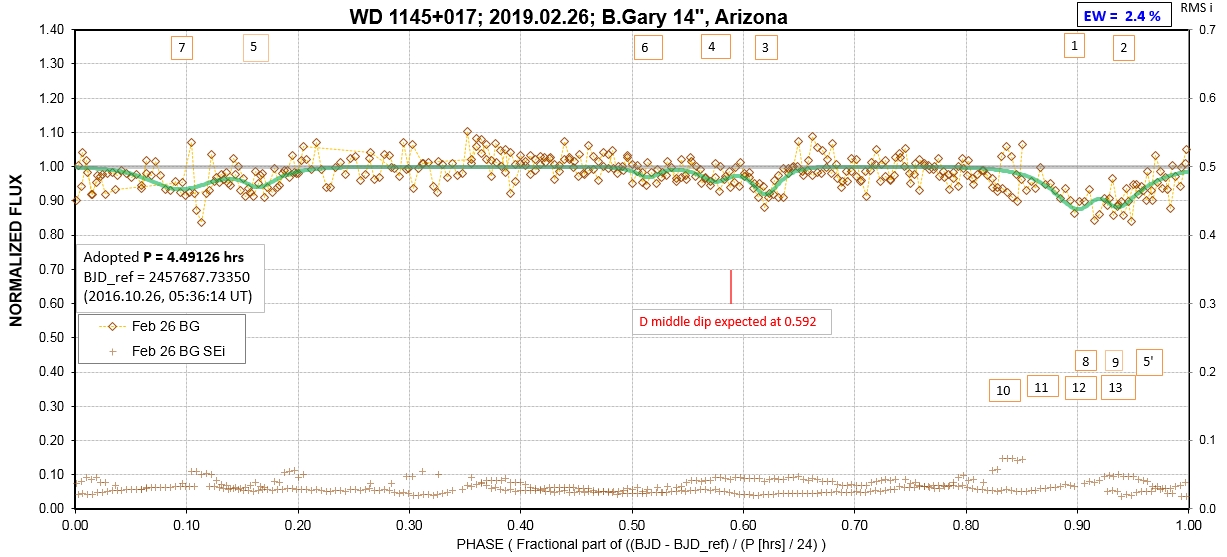
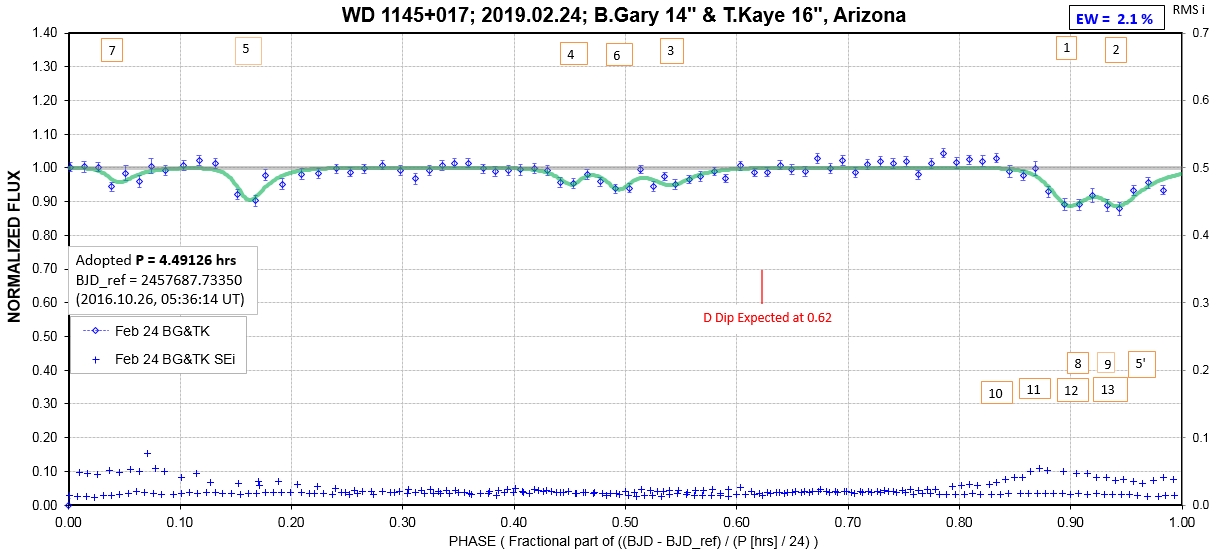
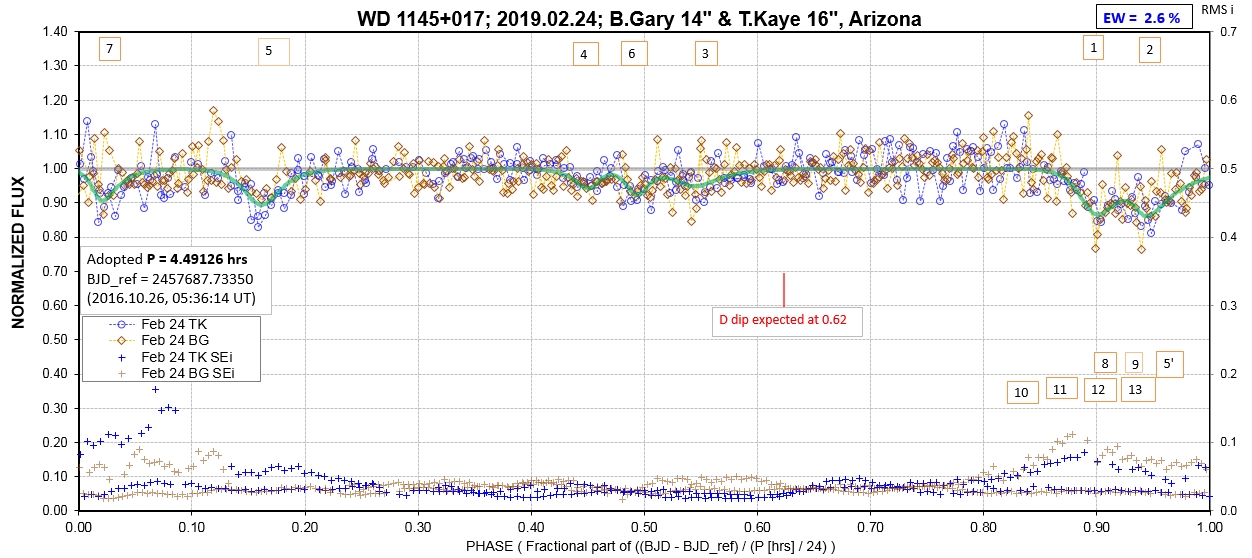
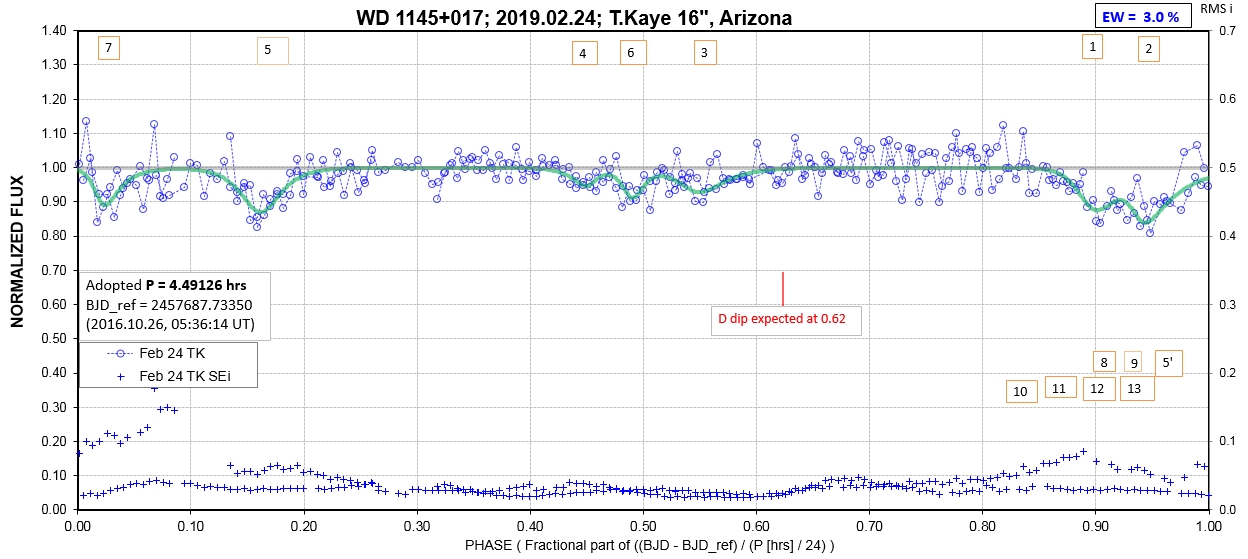
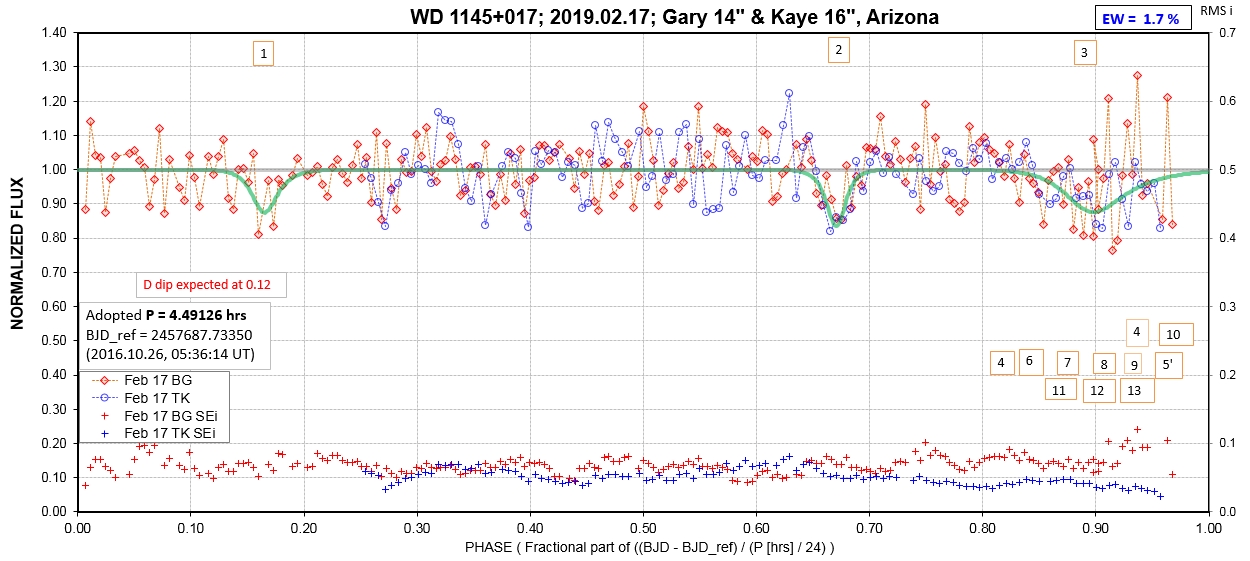
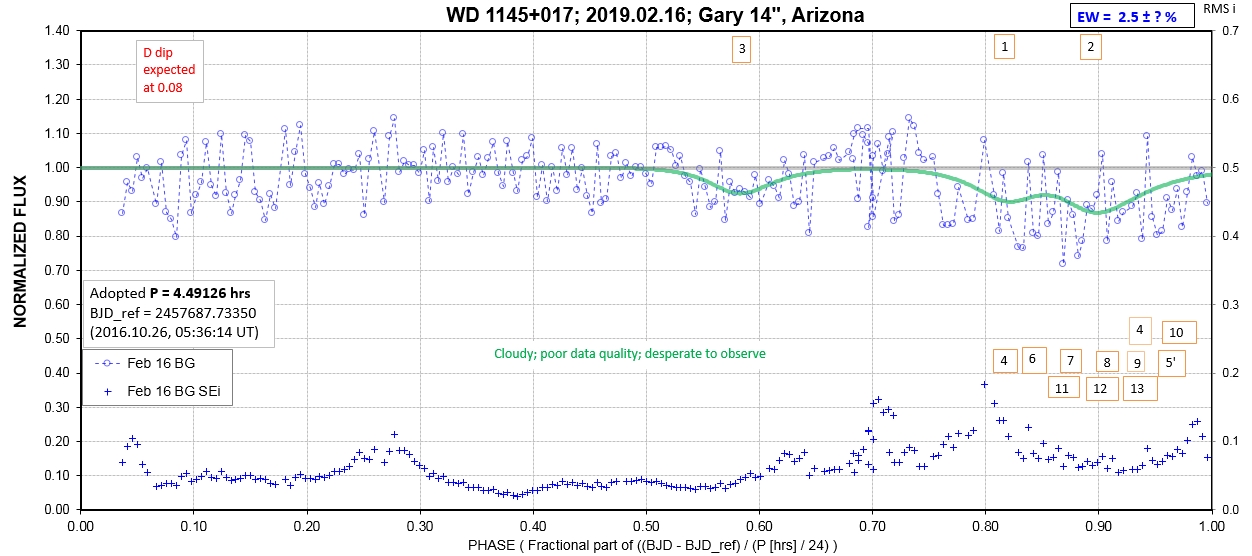
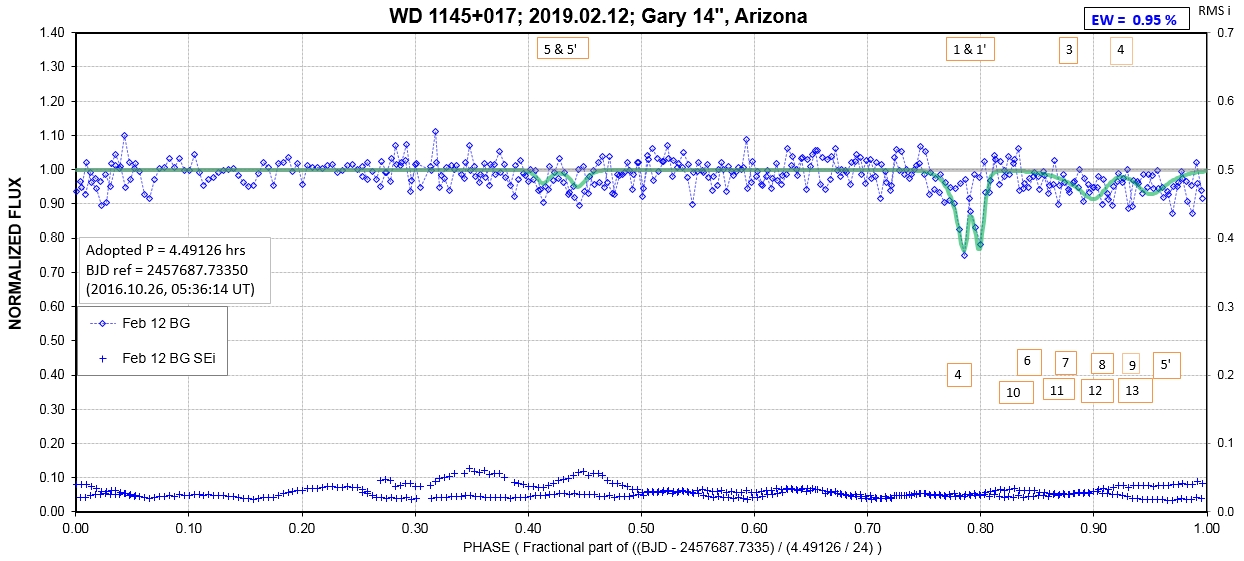
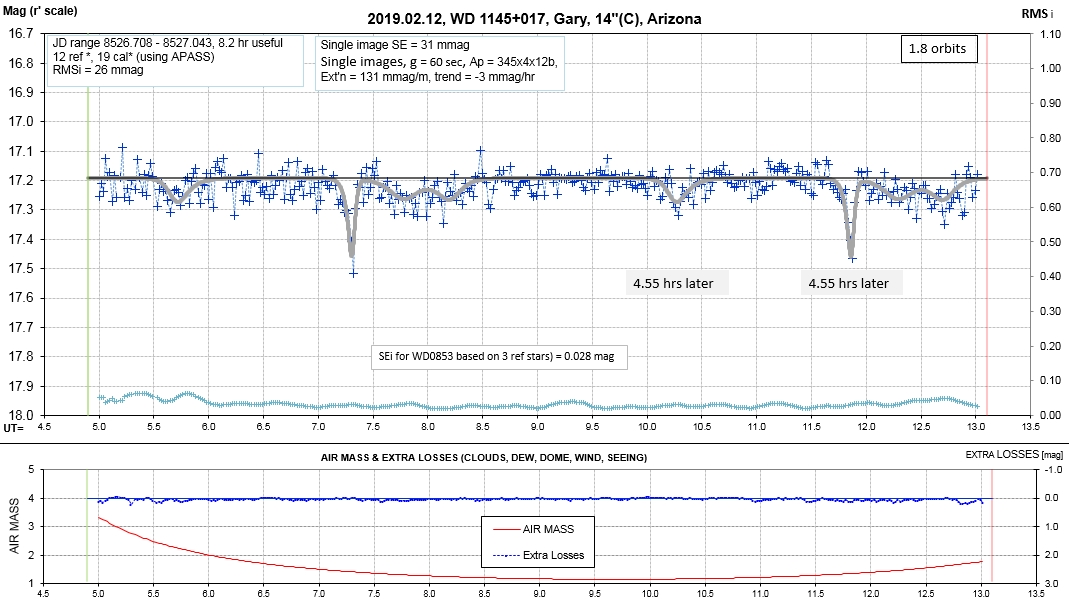
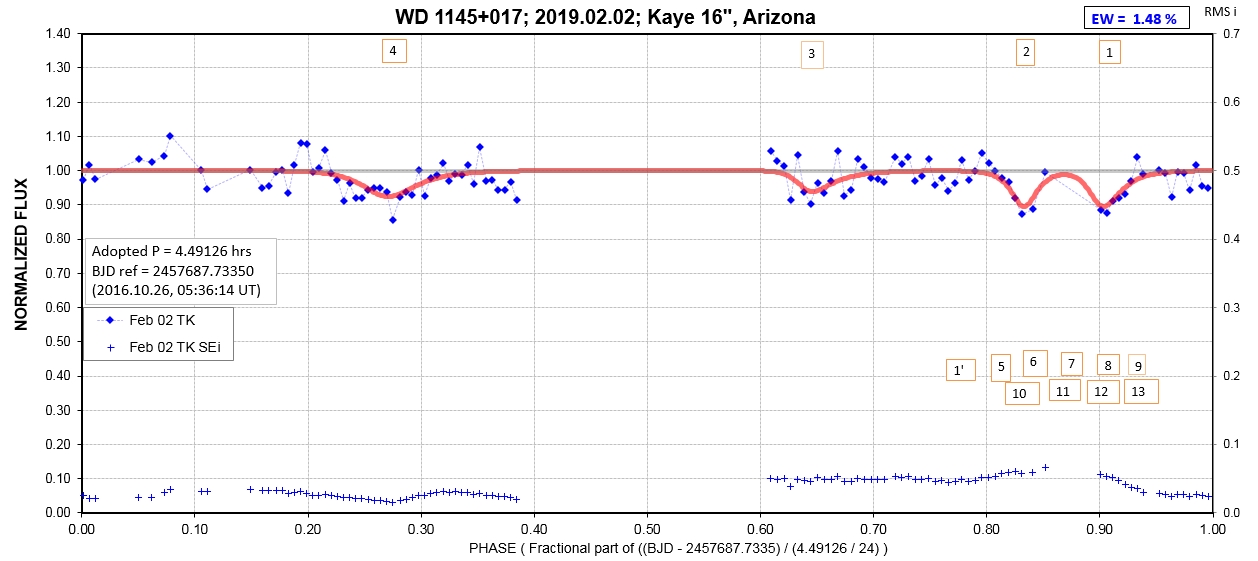
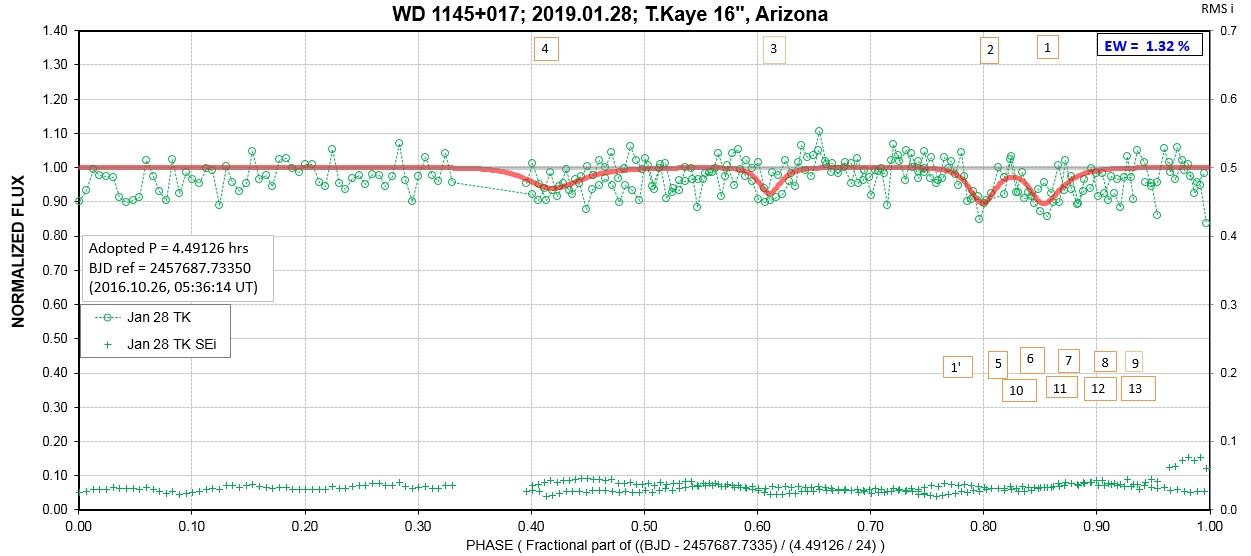
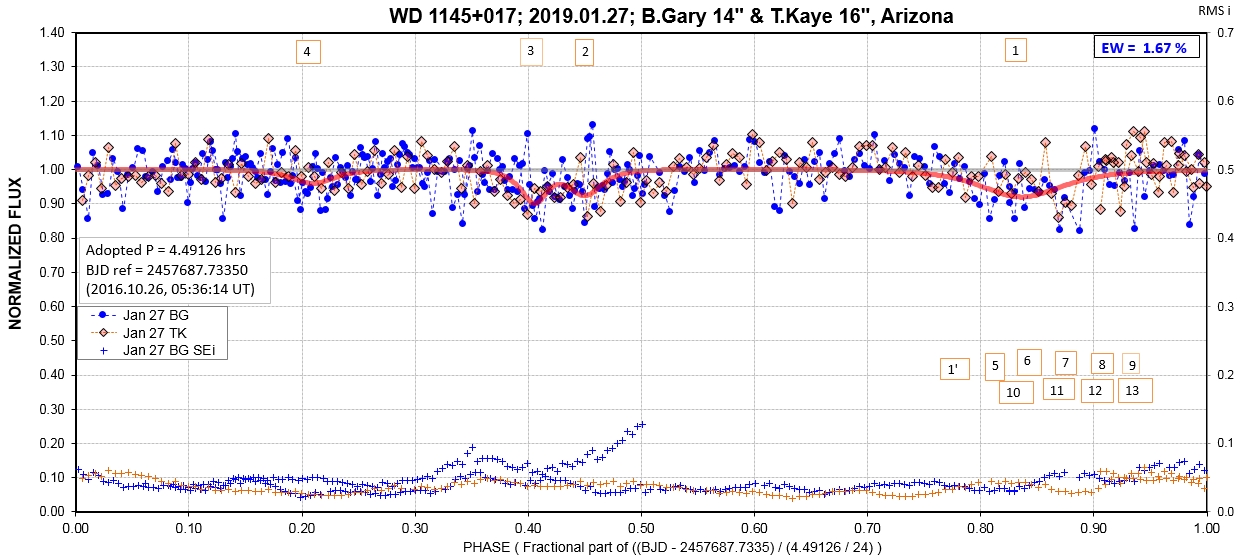
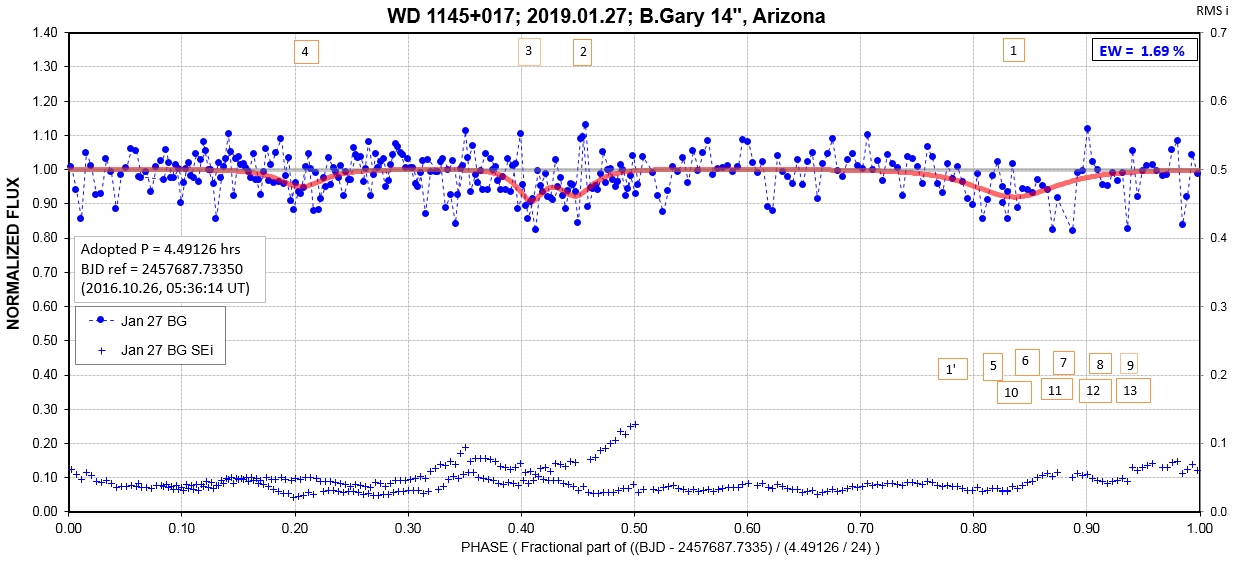
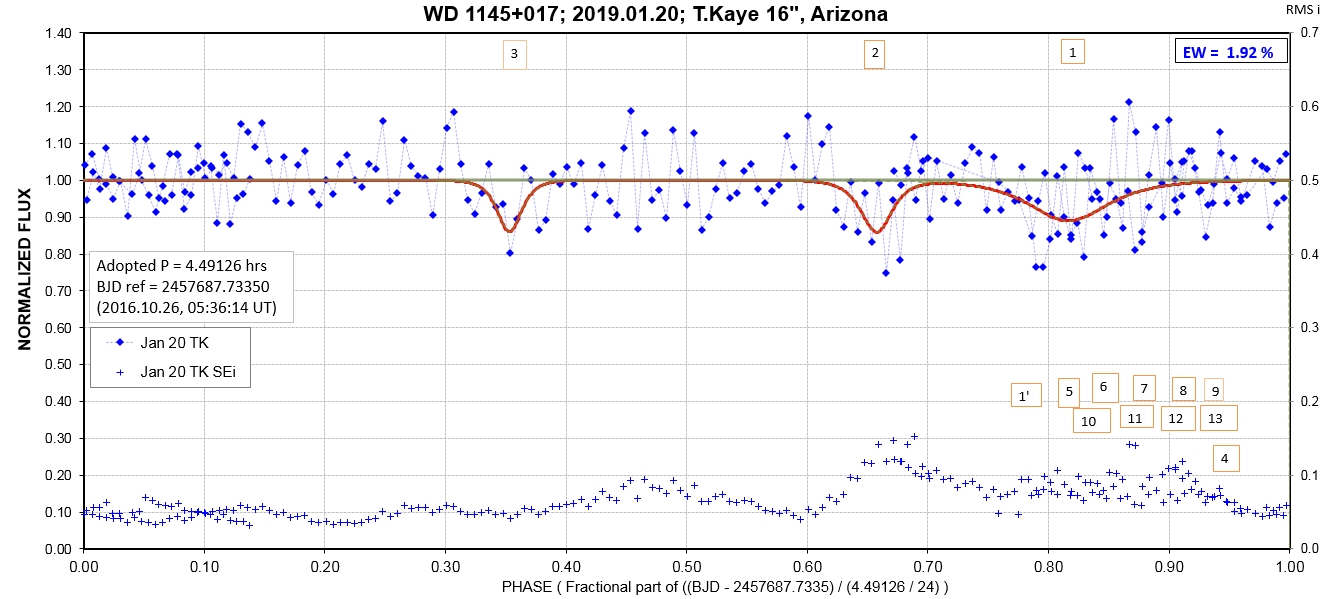
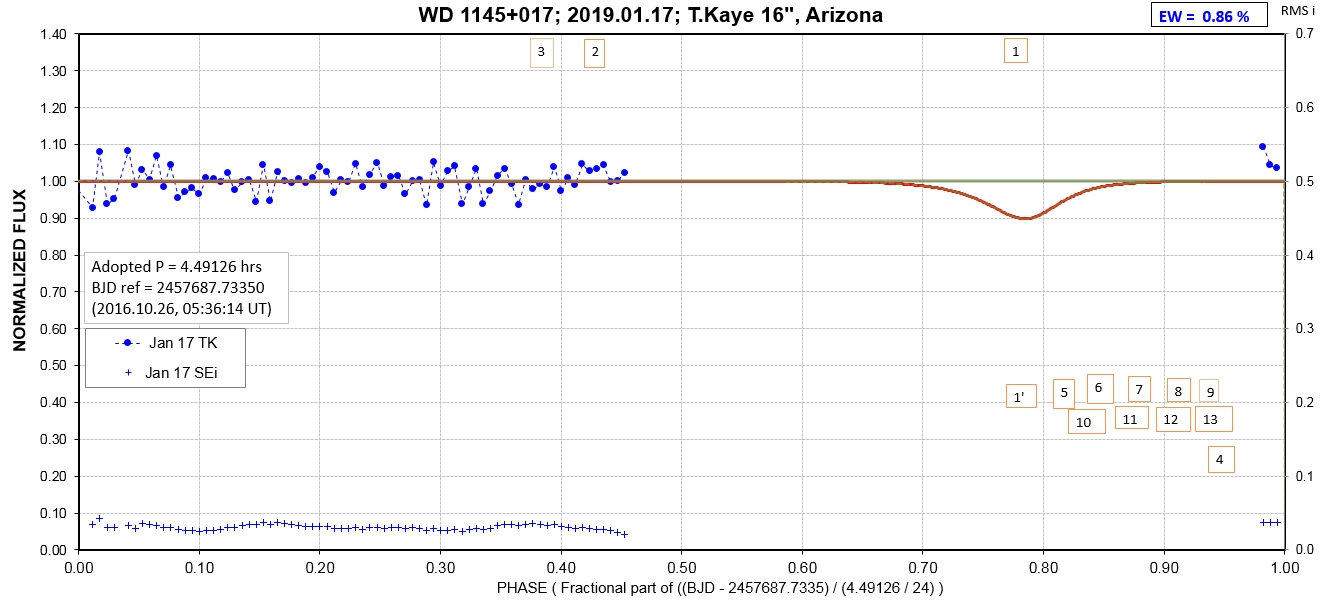
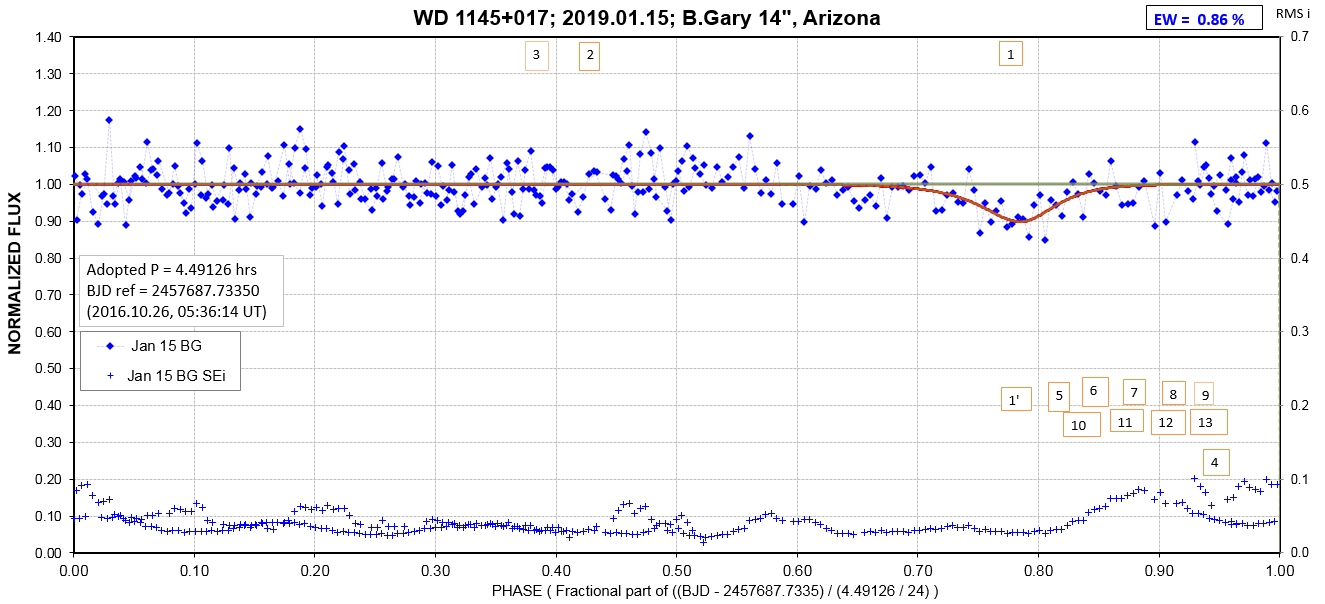
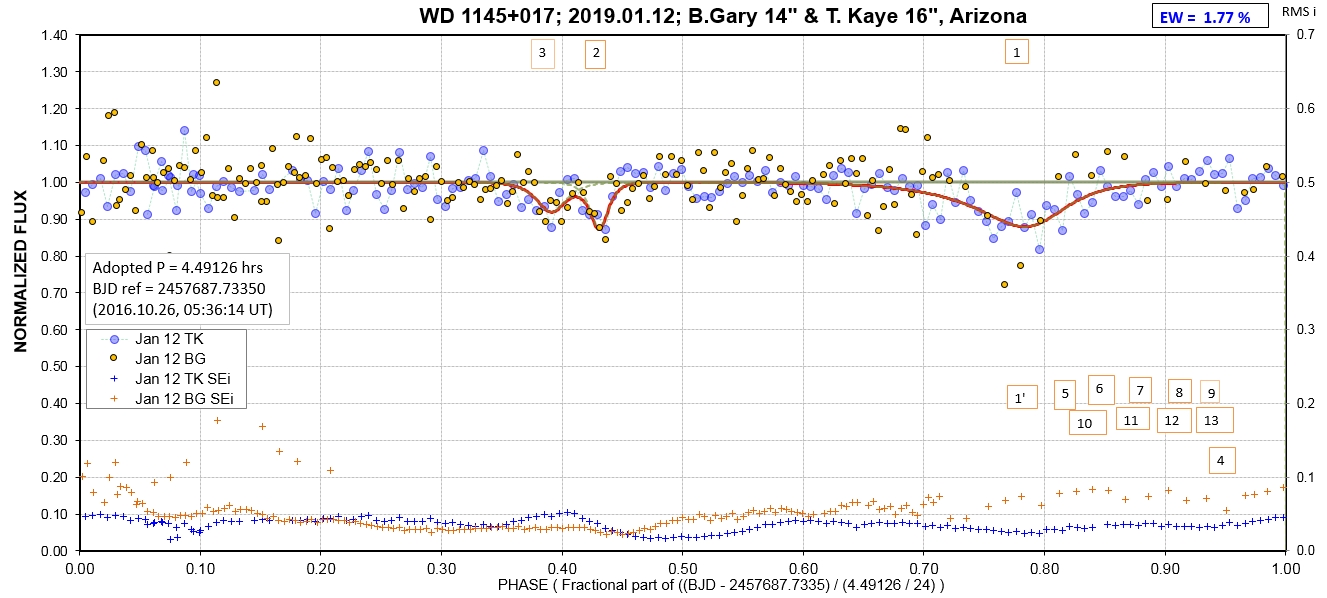
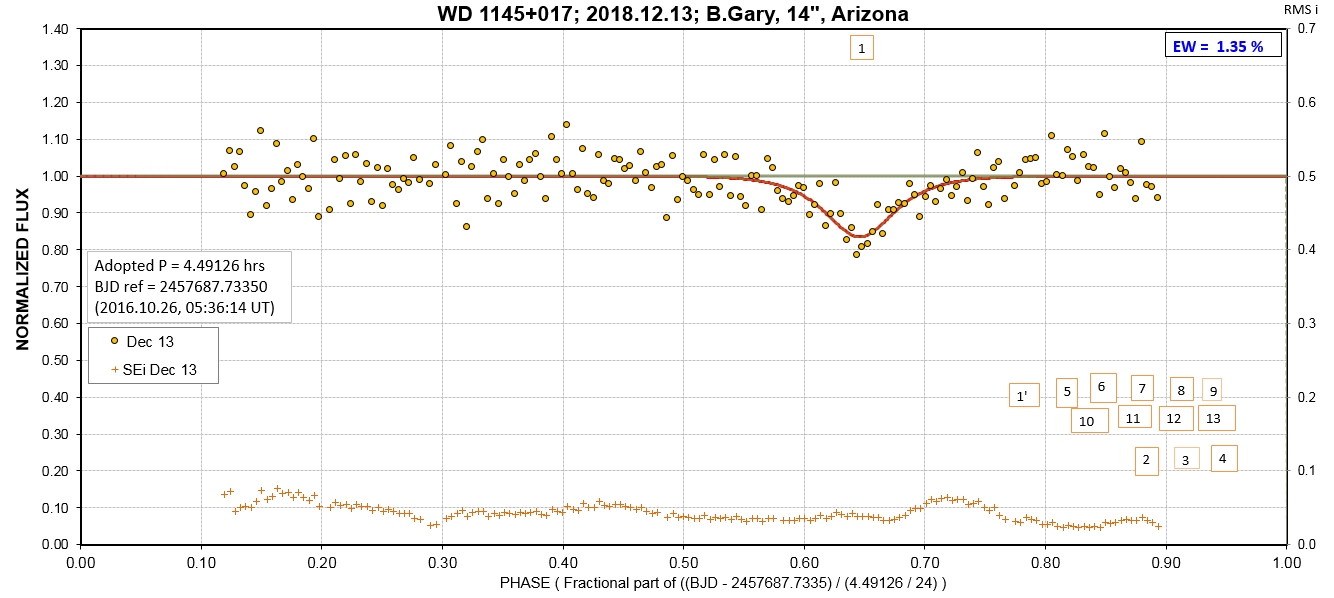
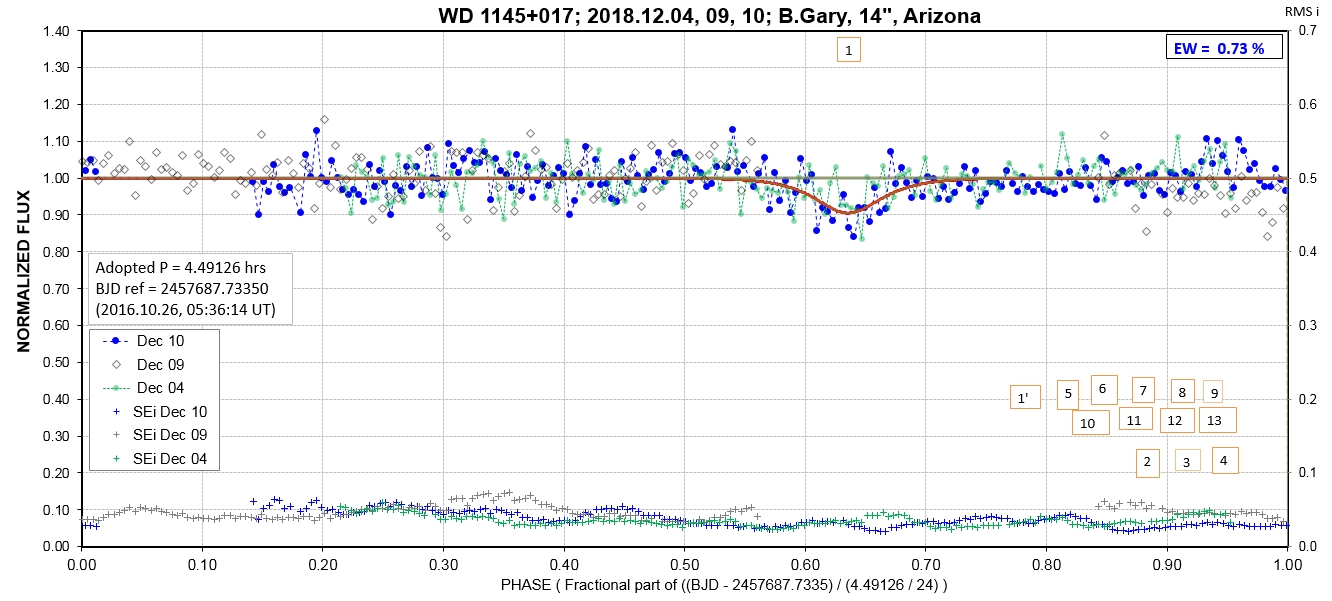
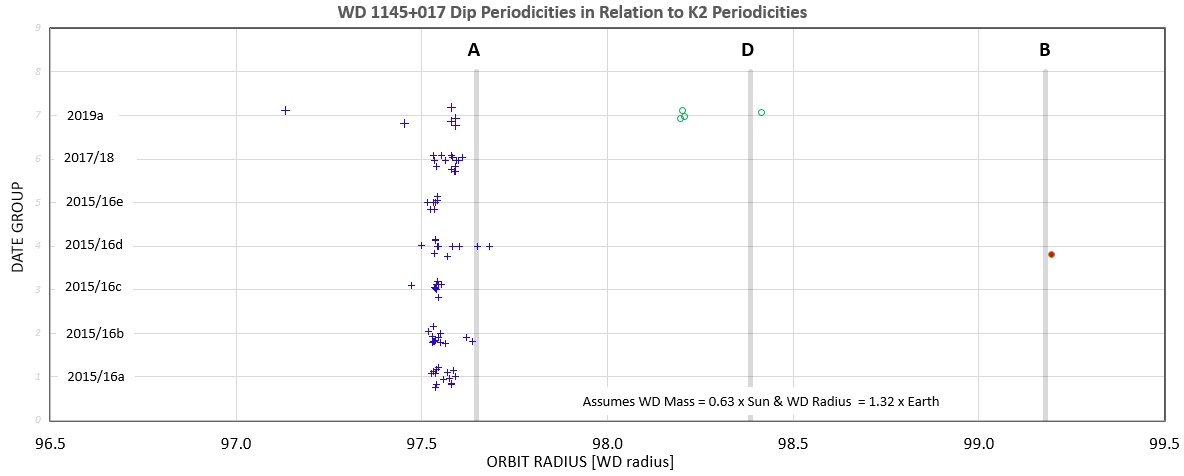
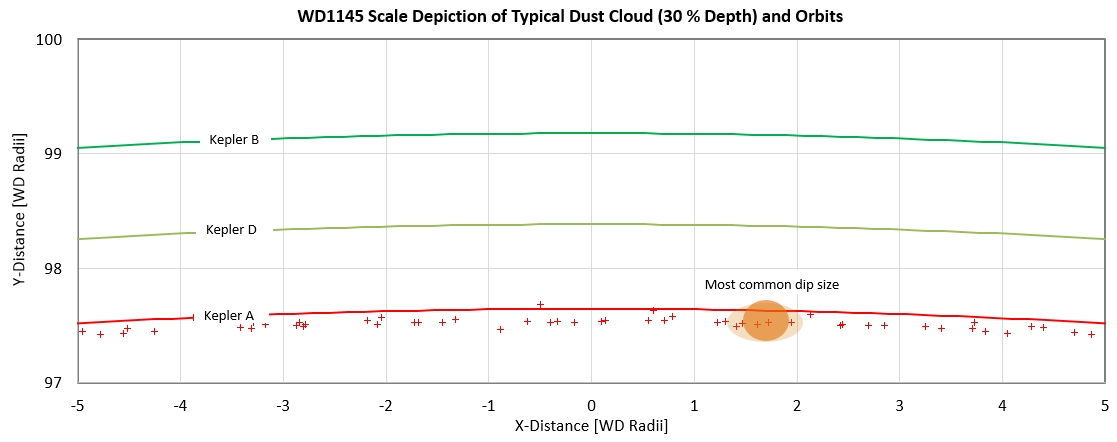
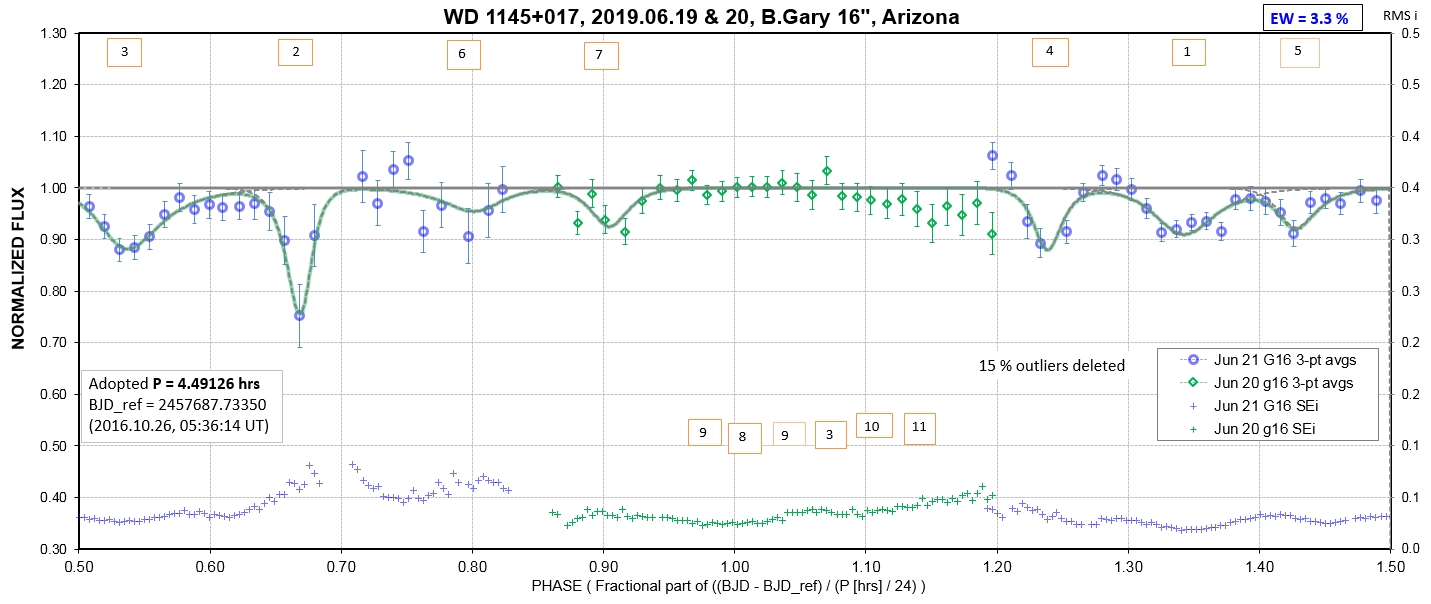
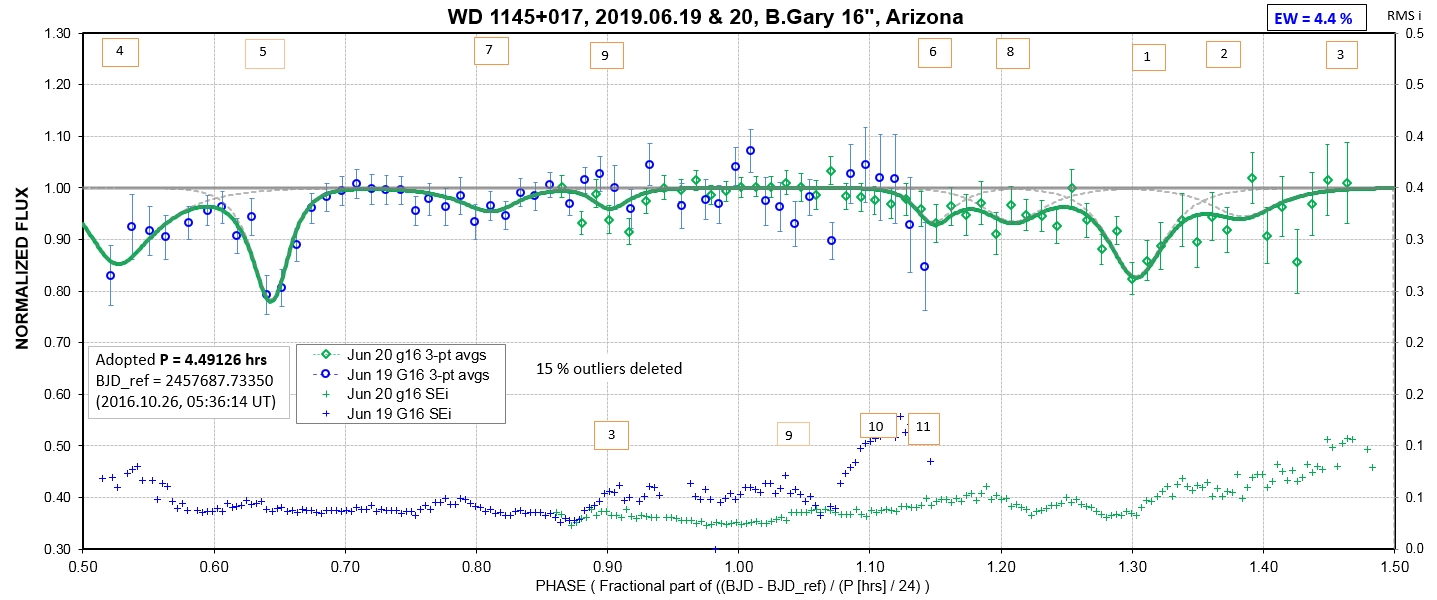
The following sequence of phase-folded light curves can be used to study the recent evolution of all dip activity.
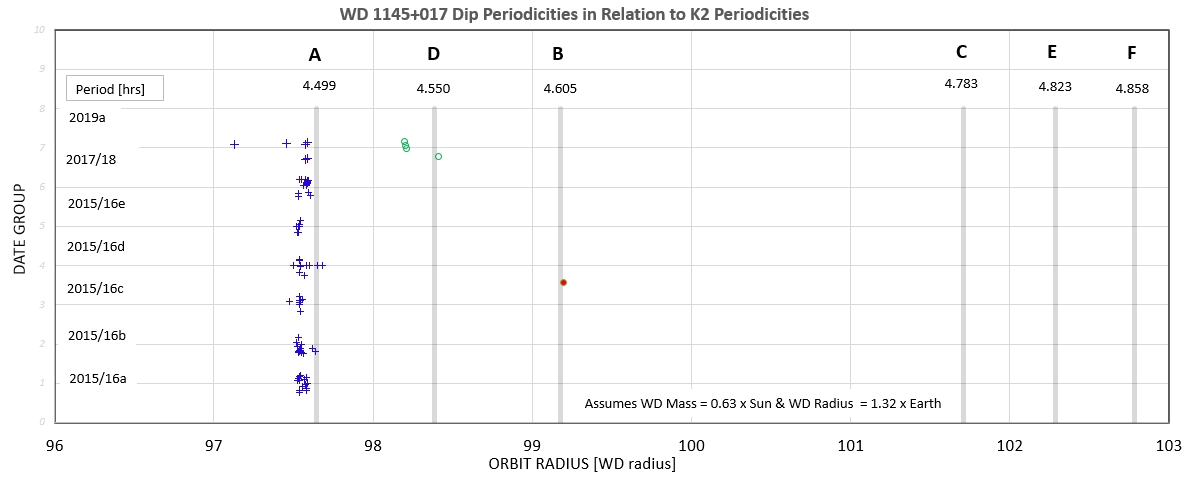
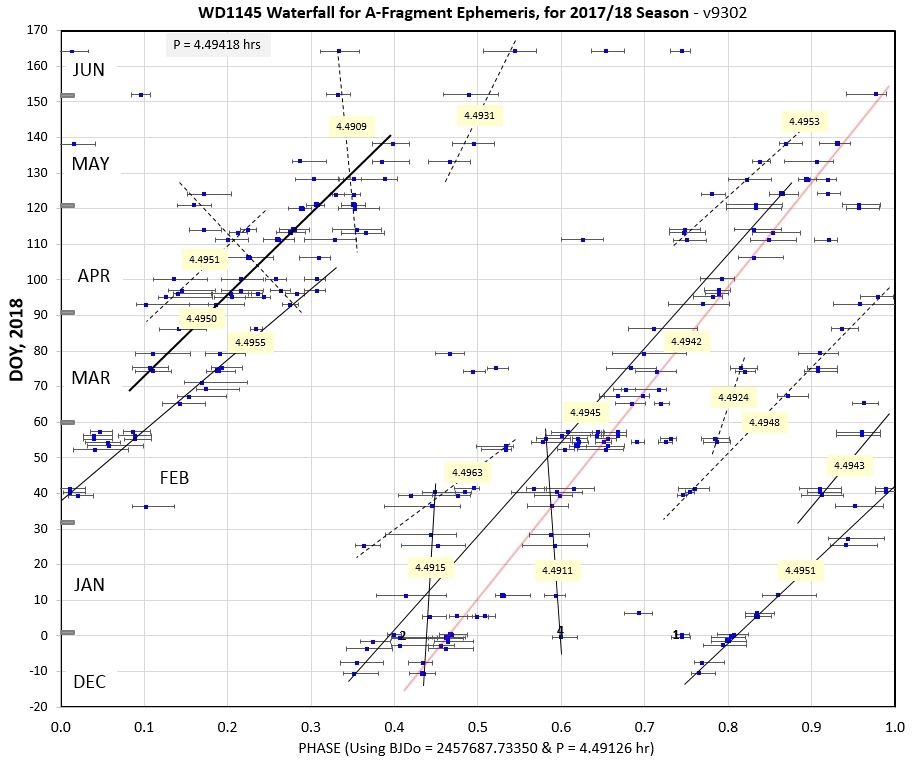
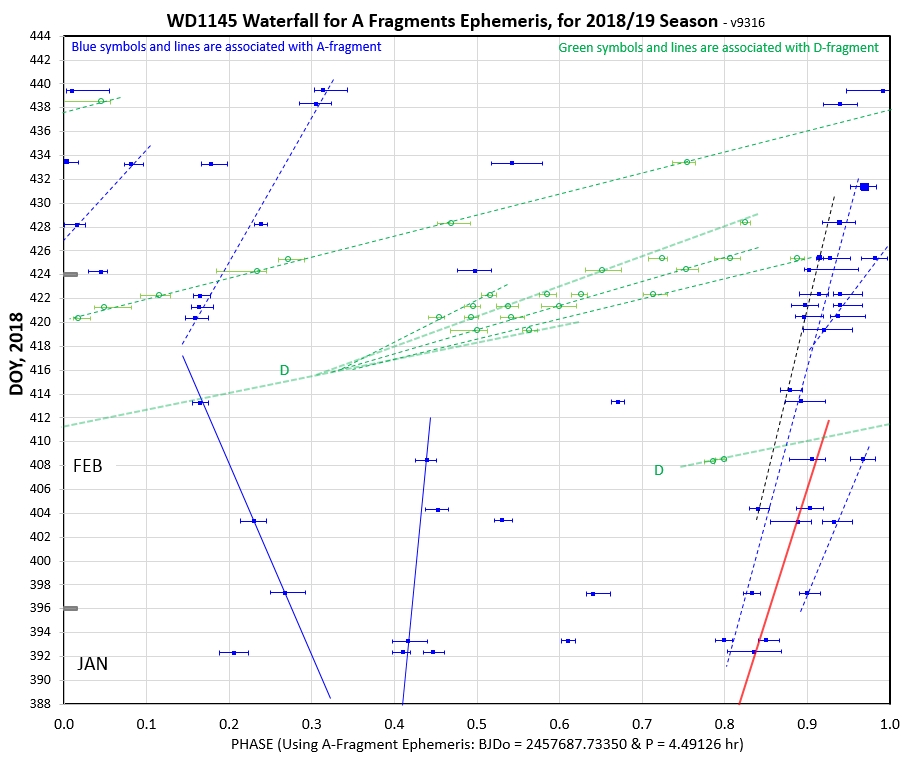
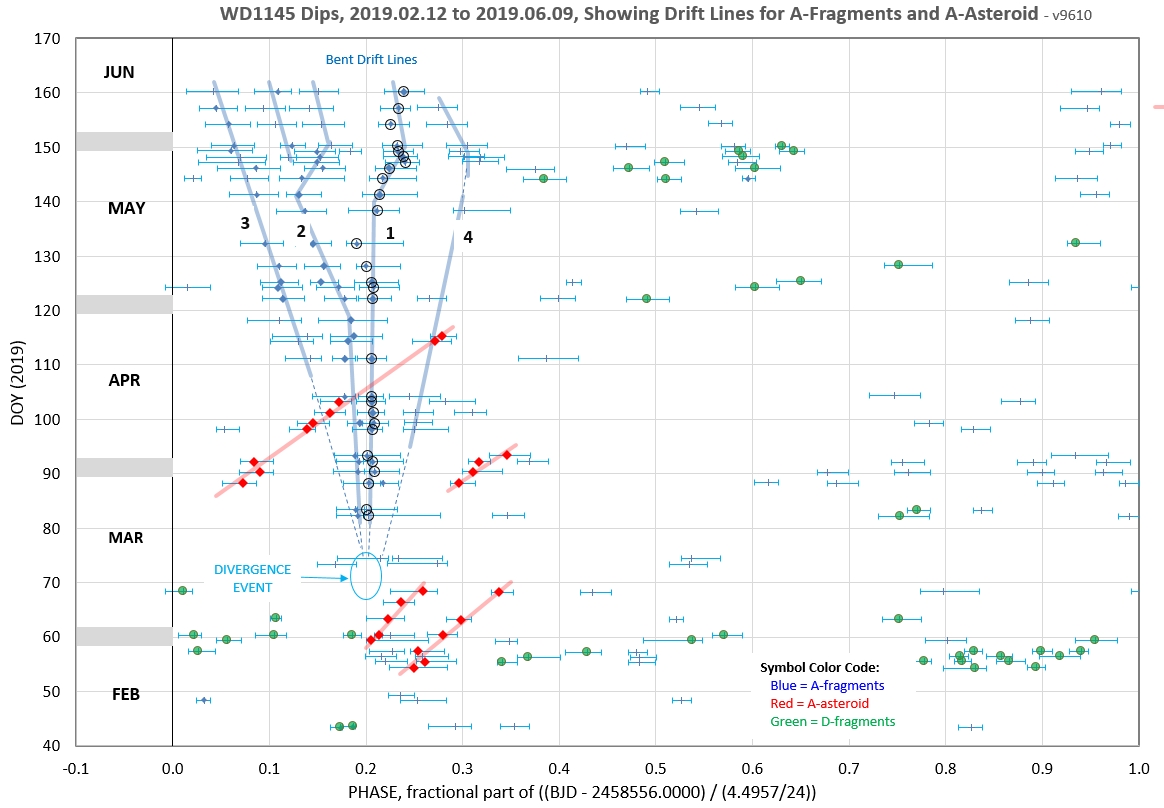
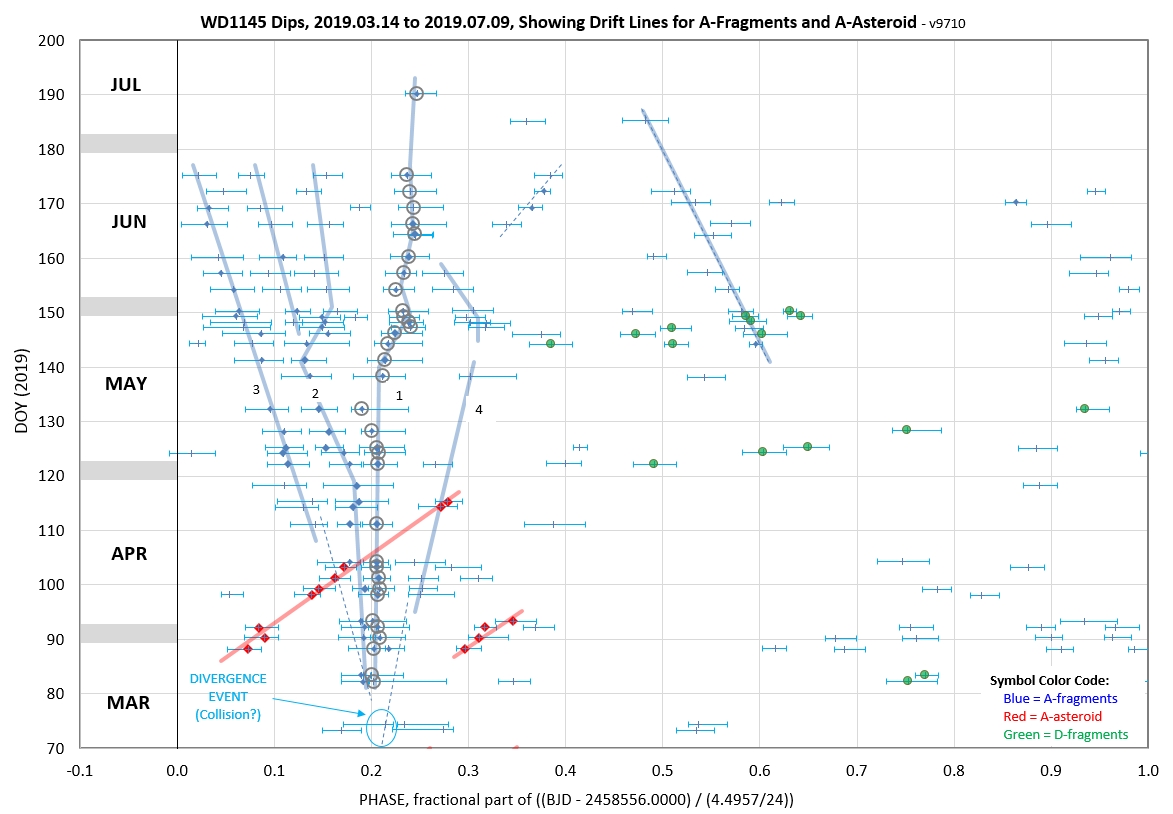
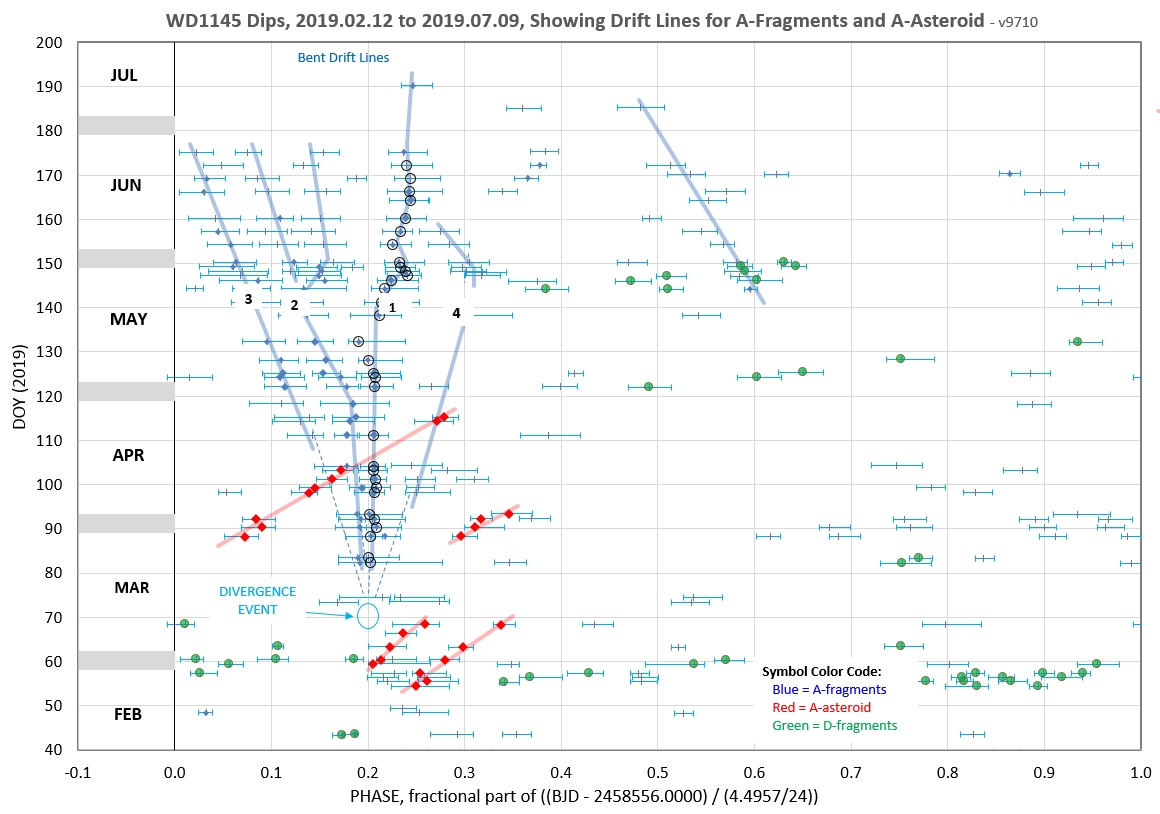
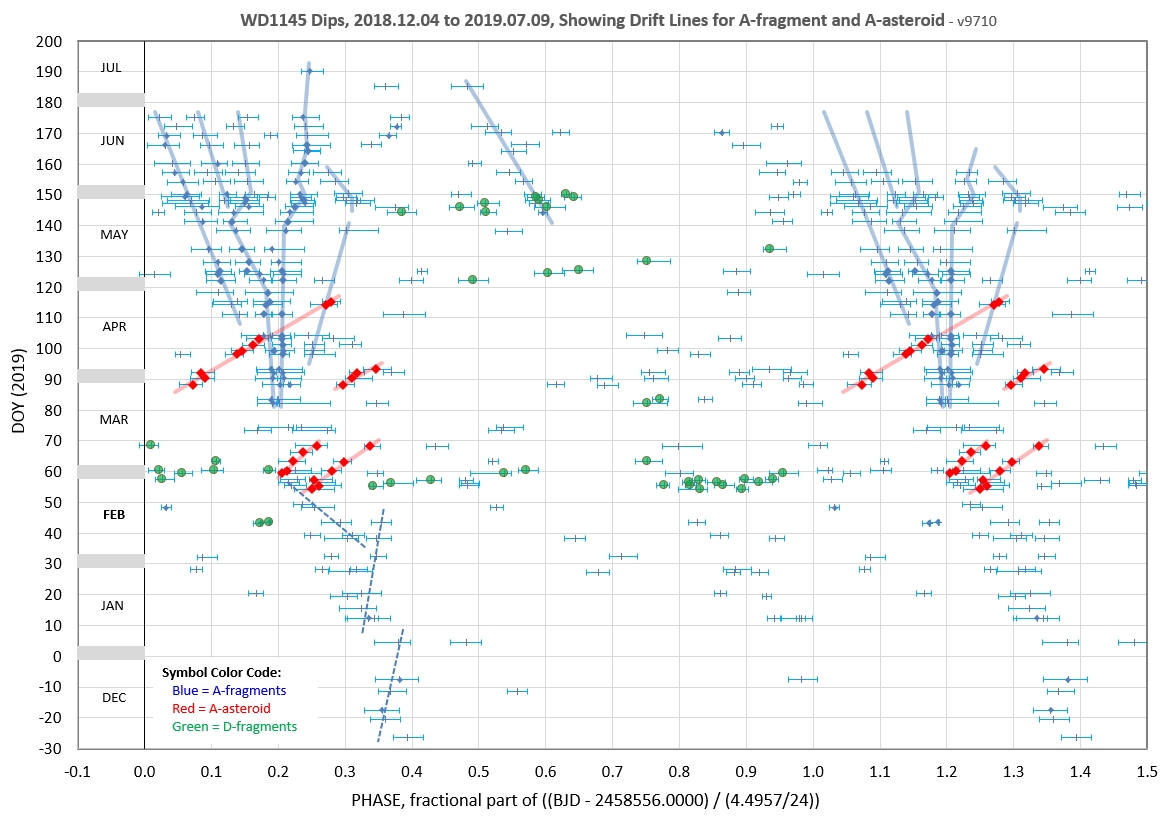
The following 3 waterfall plots show dip phase using an ephemeris for the A-fragments.
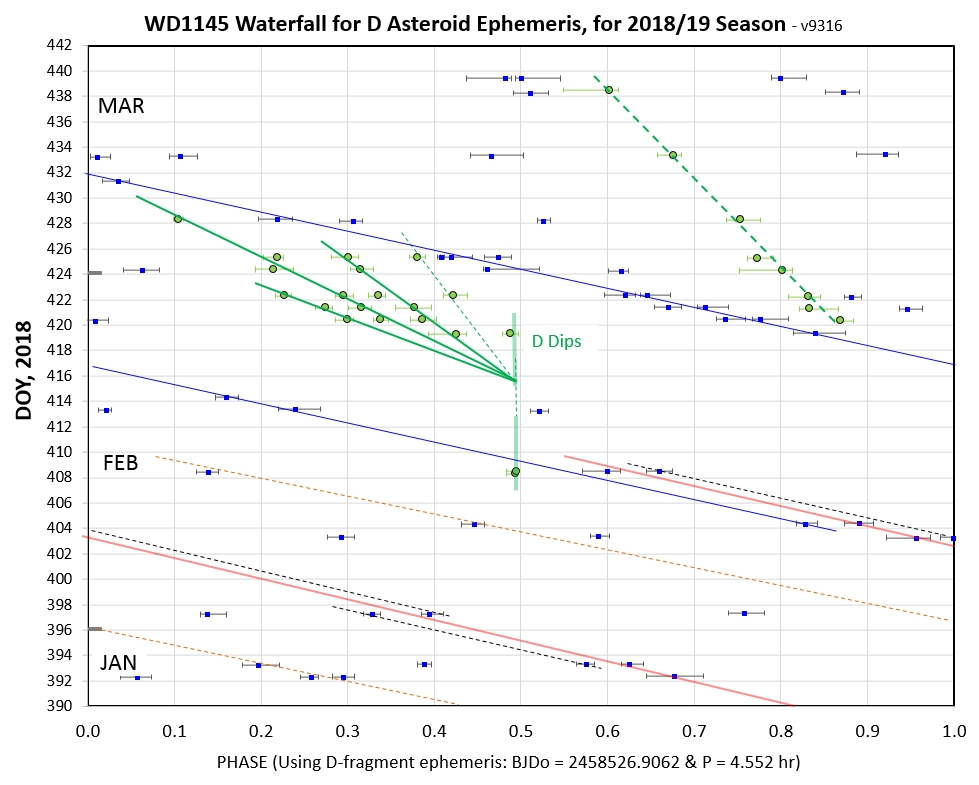
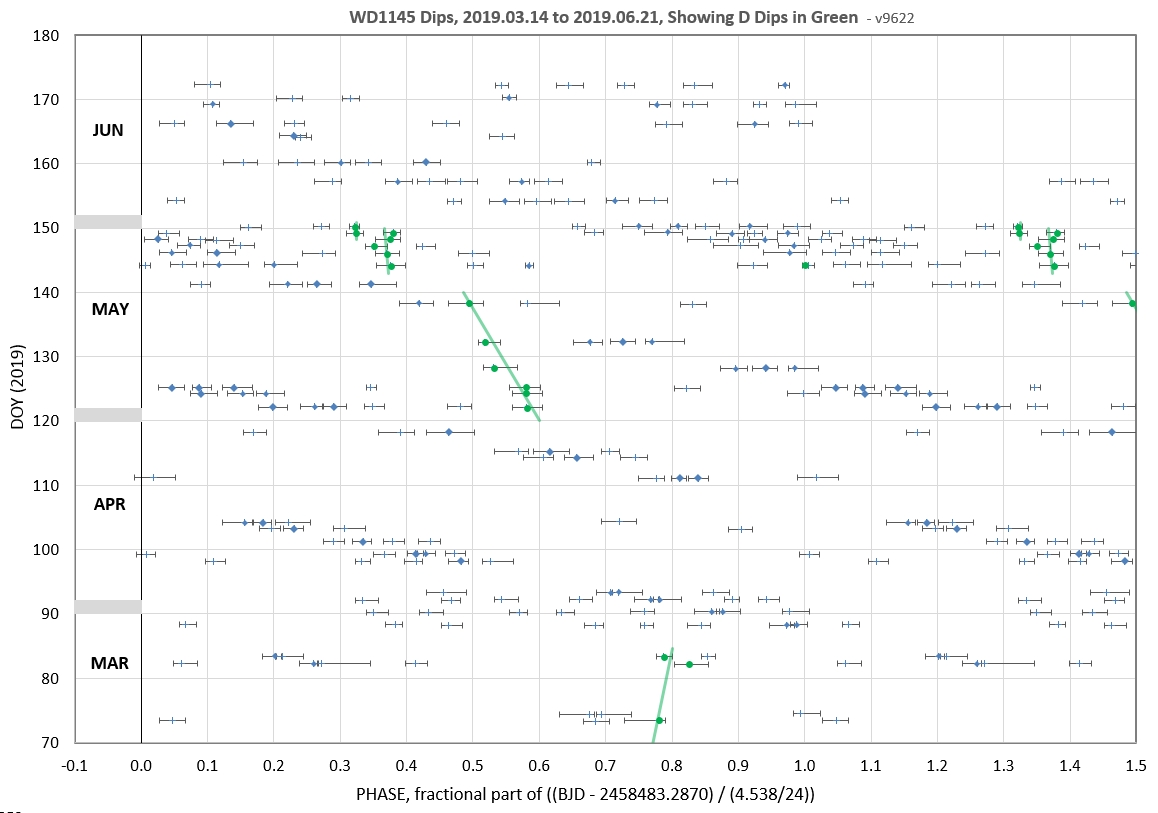
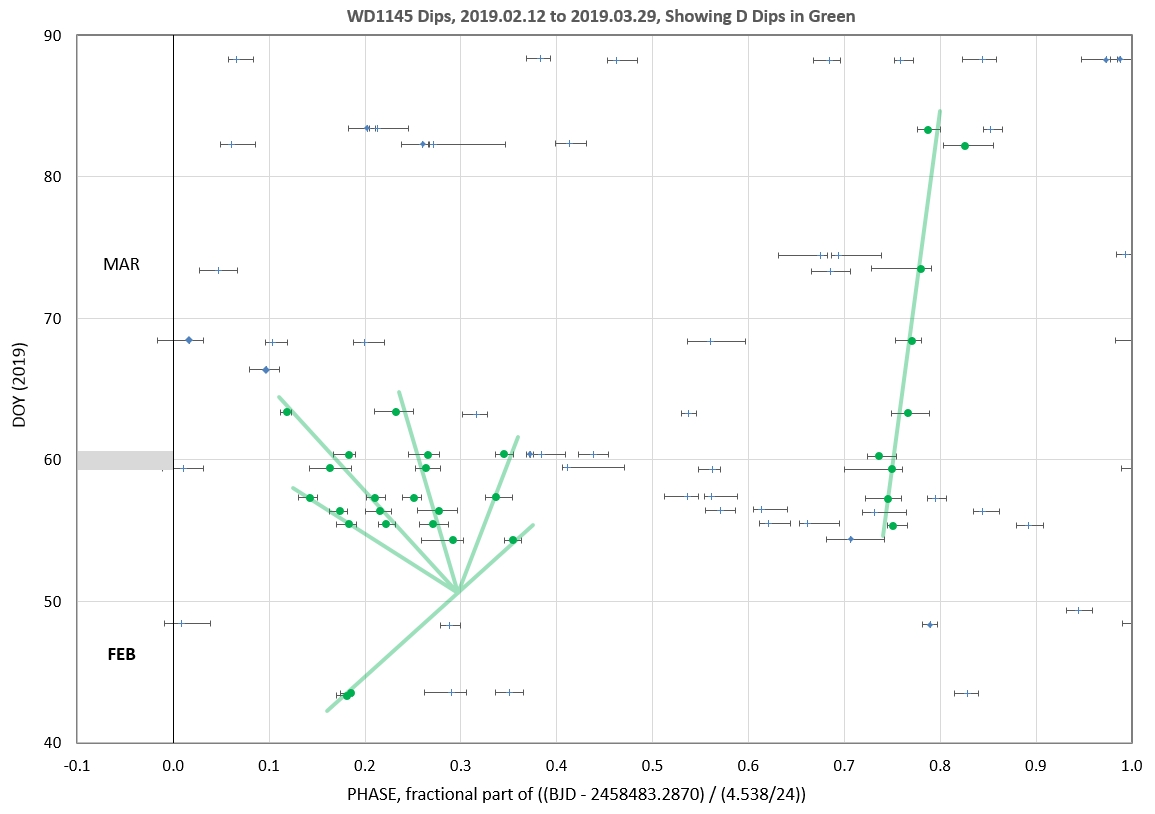
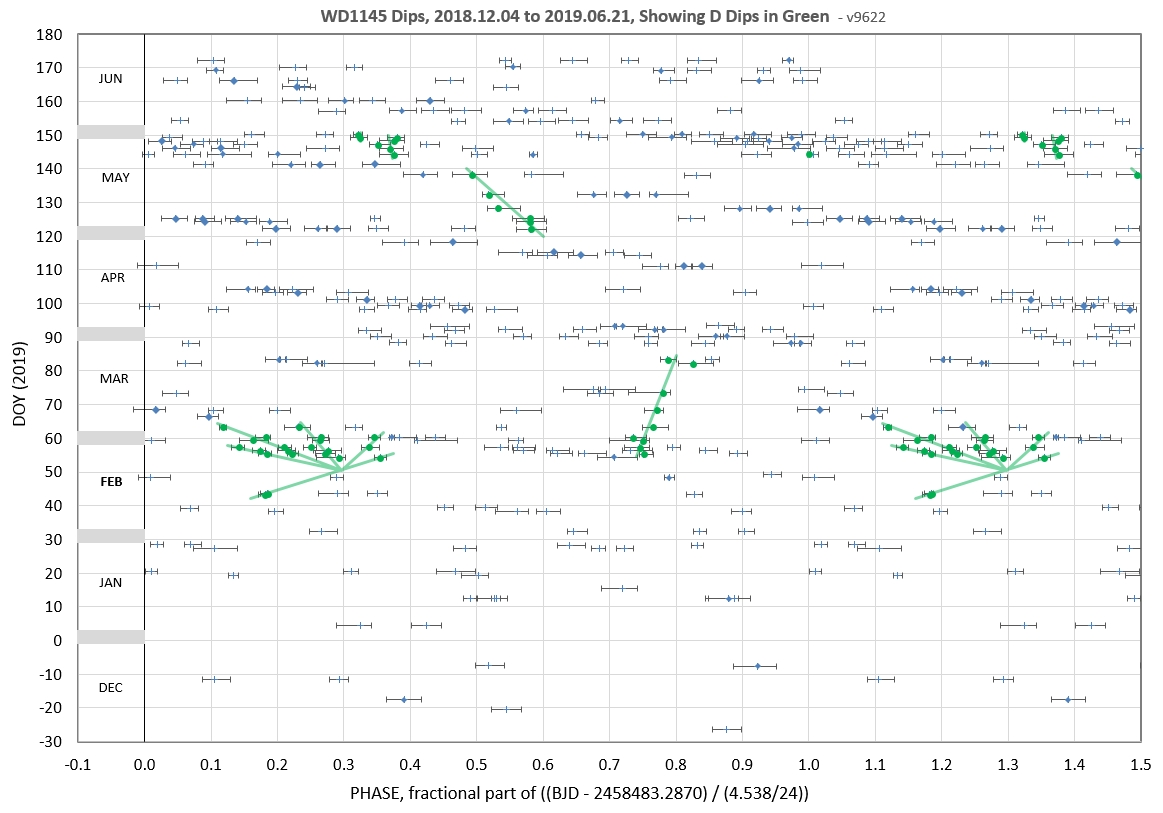
The following 3 waterfall plots show dip phase using an ephemeris for the D-fragments.
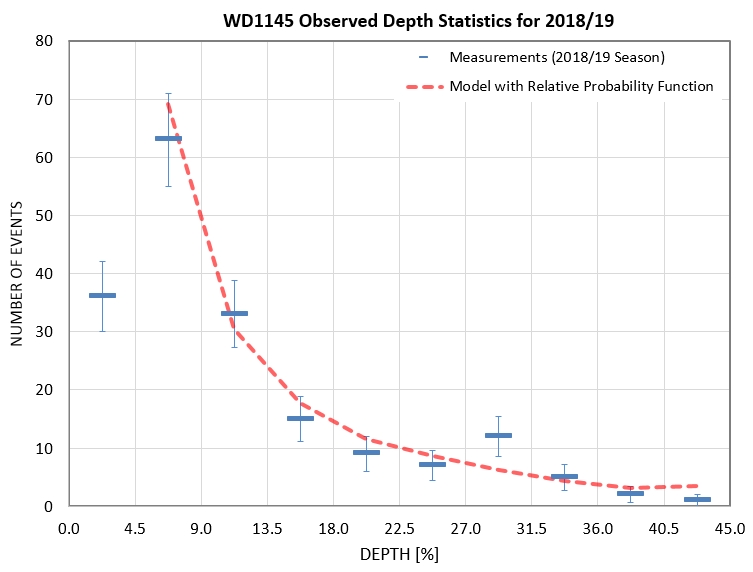
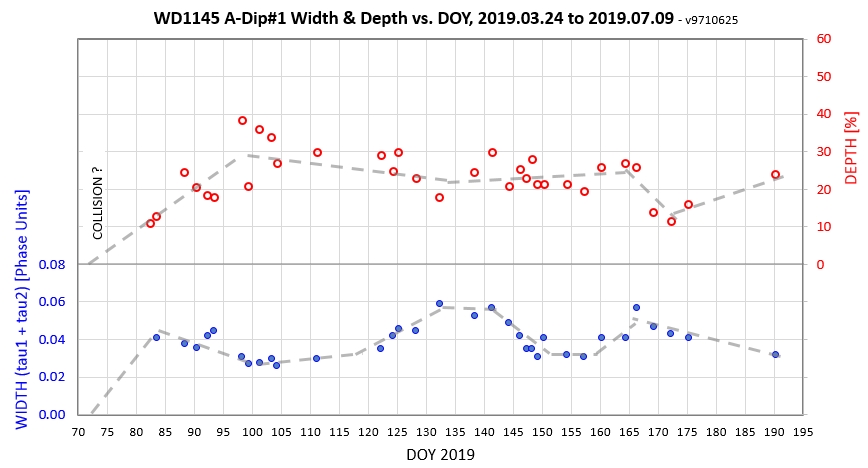
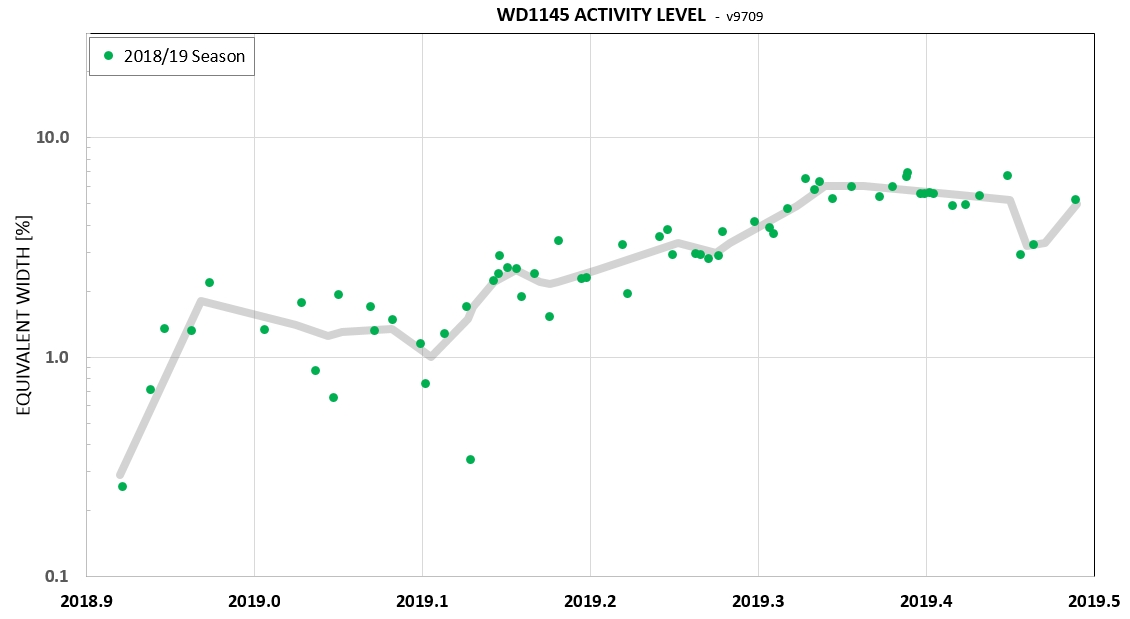
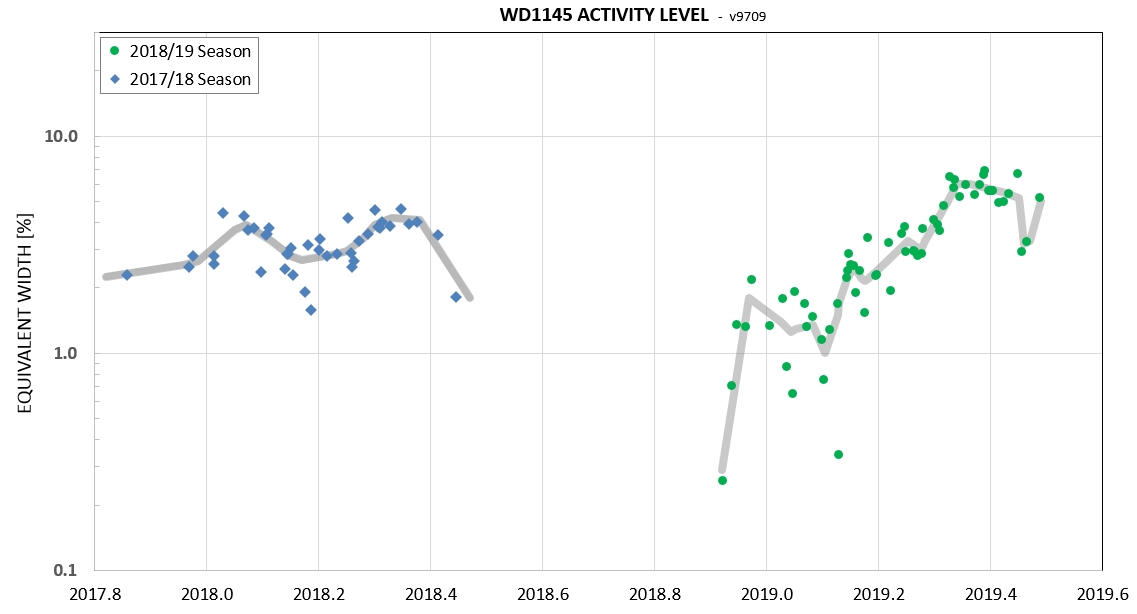
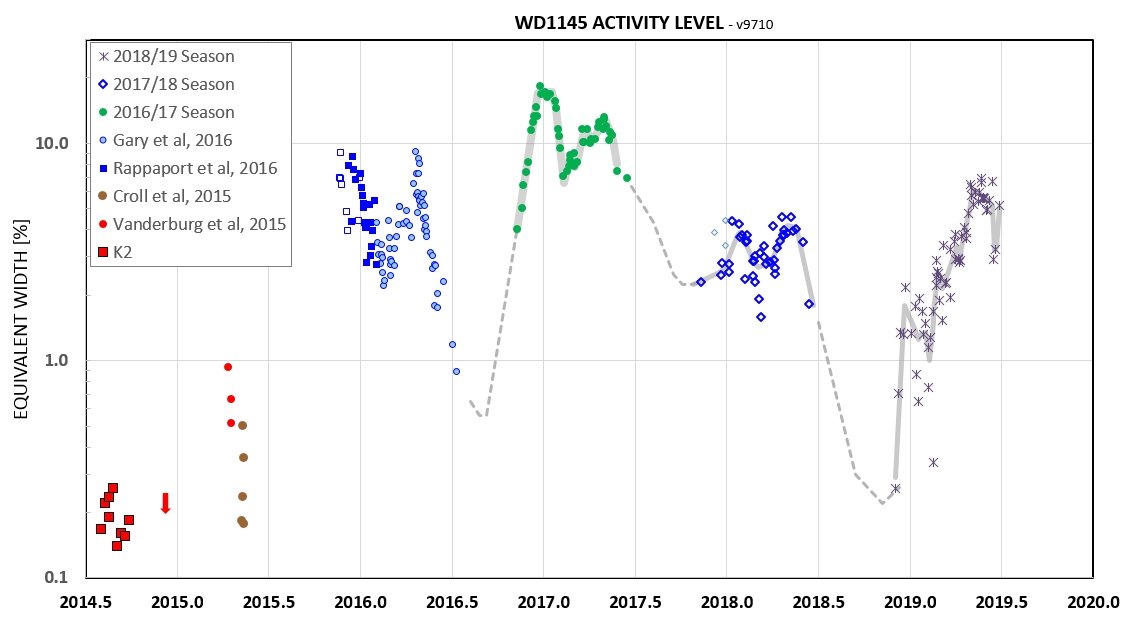
The next 3 lots show dust production "activity" level vs. date.
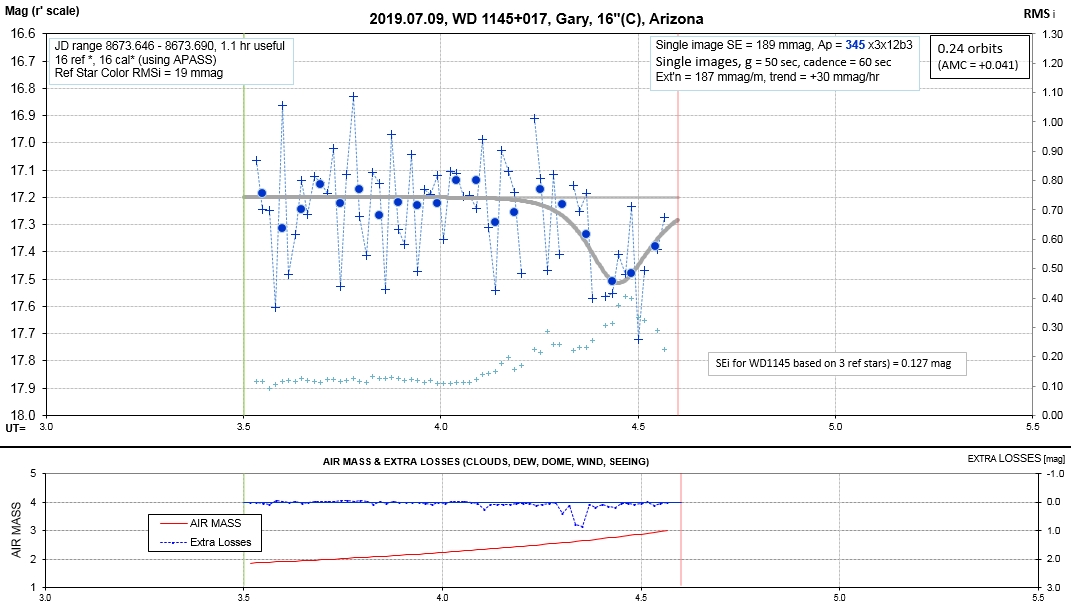
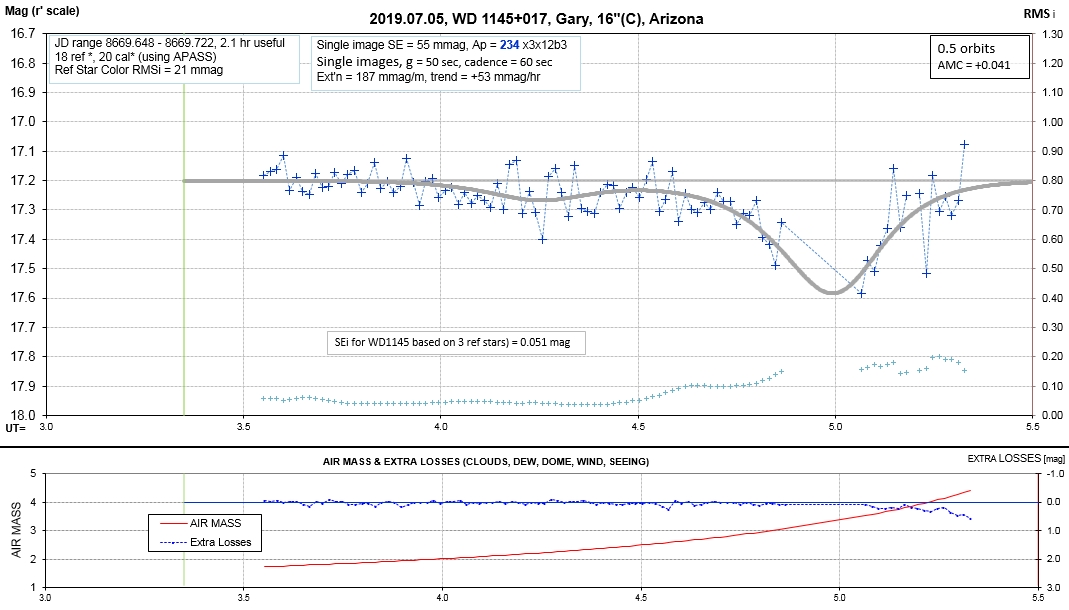
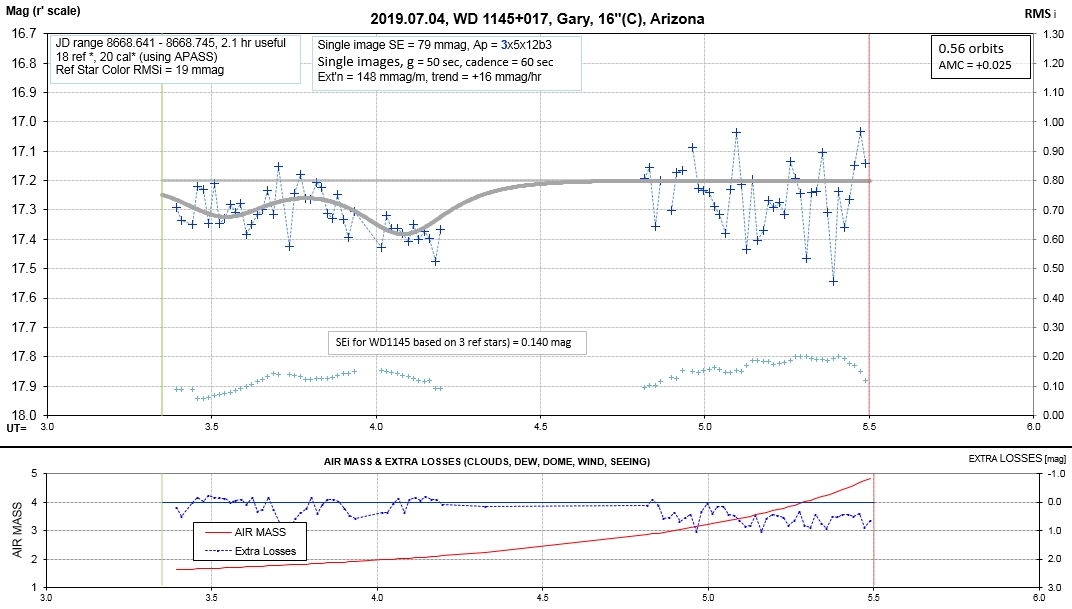
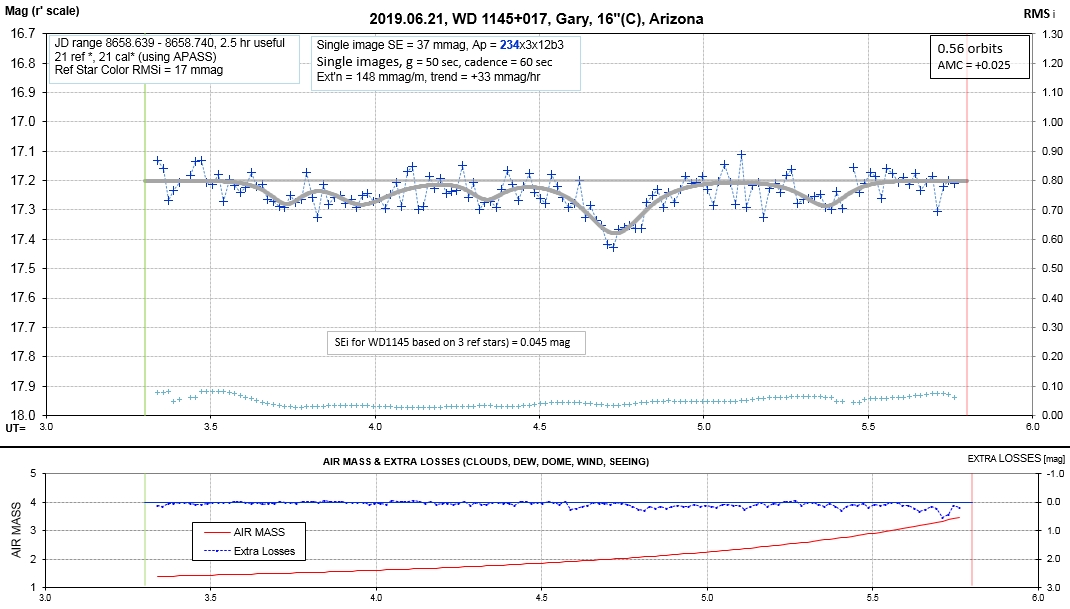
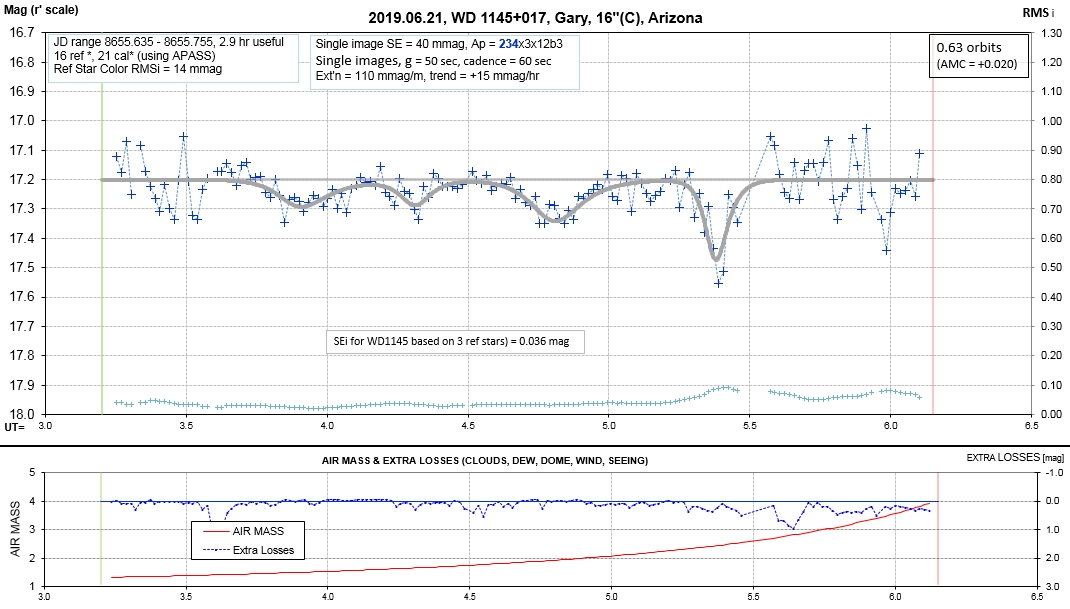
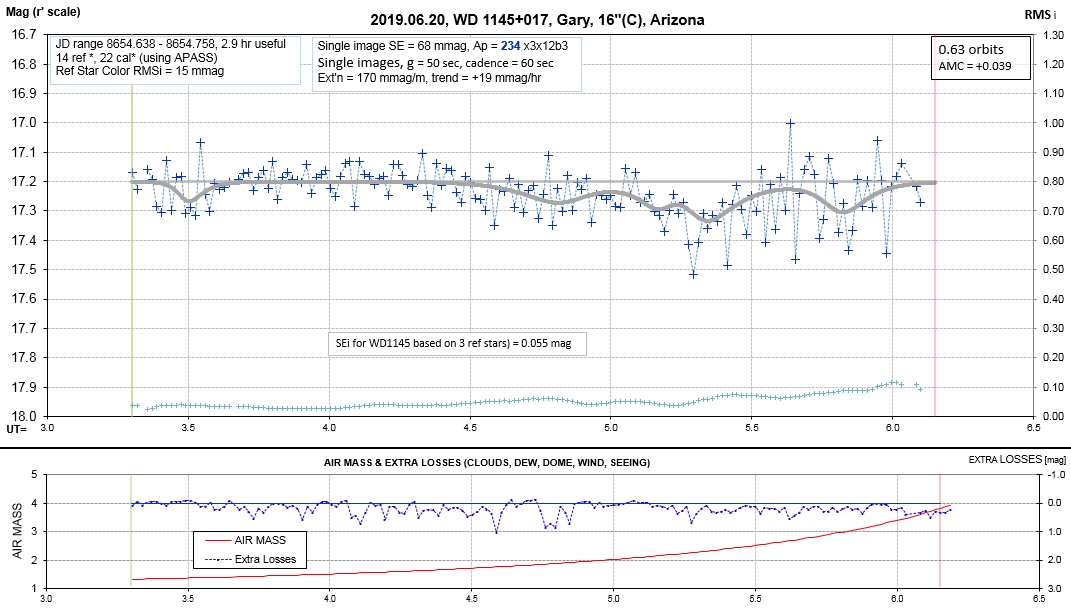
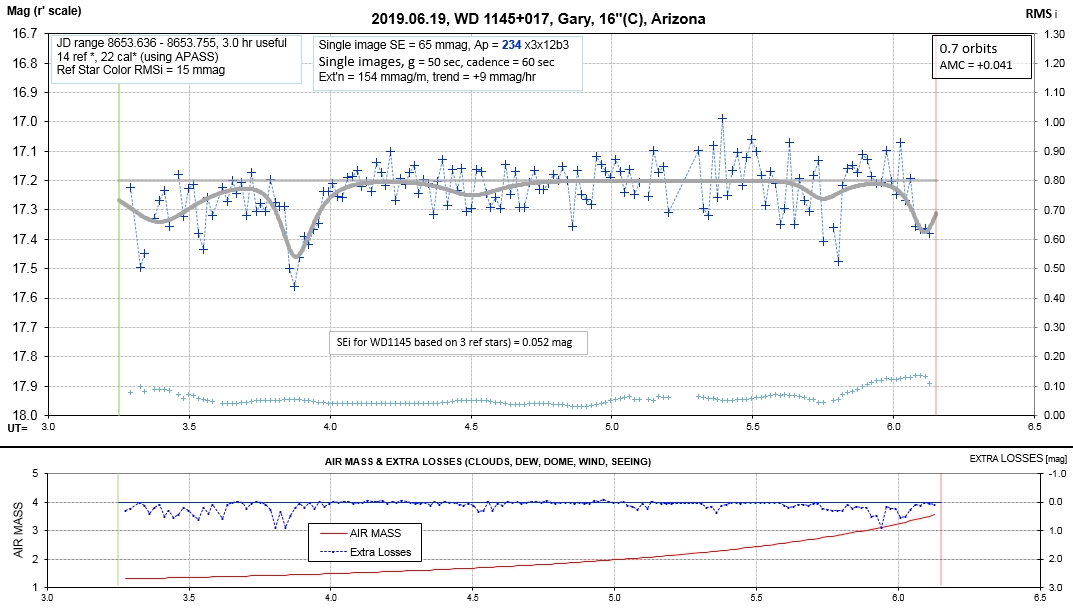
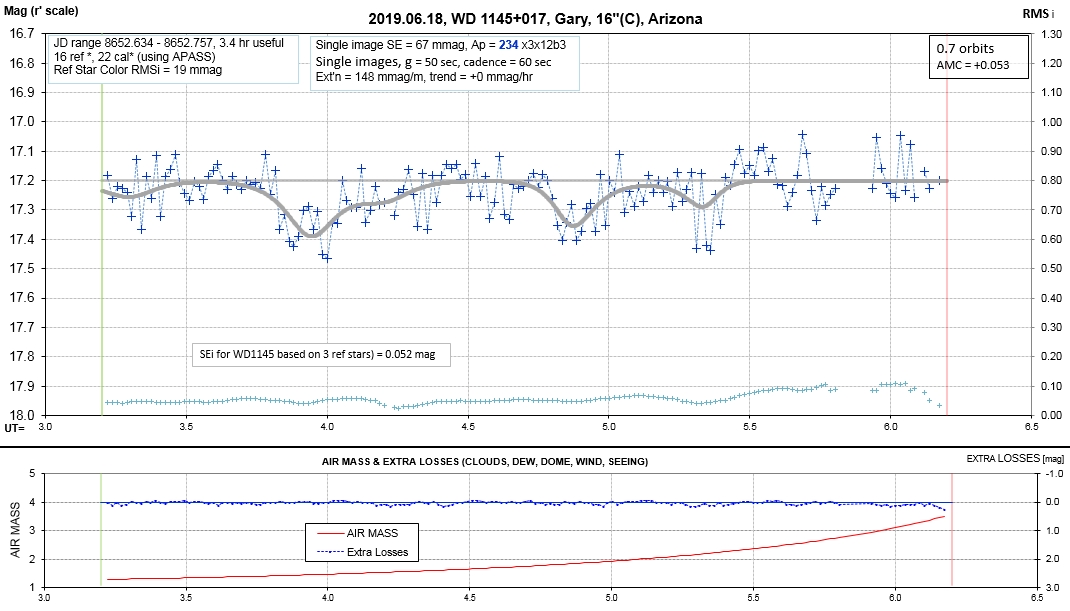
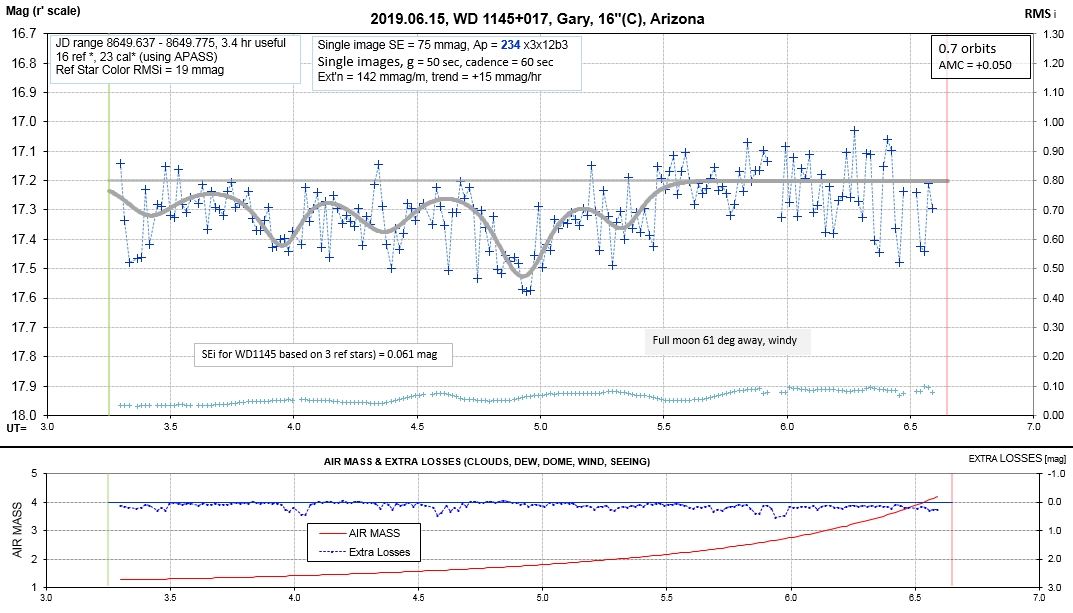
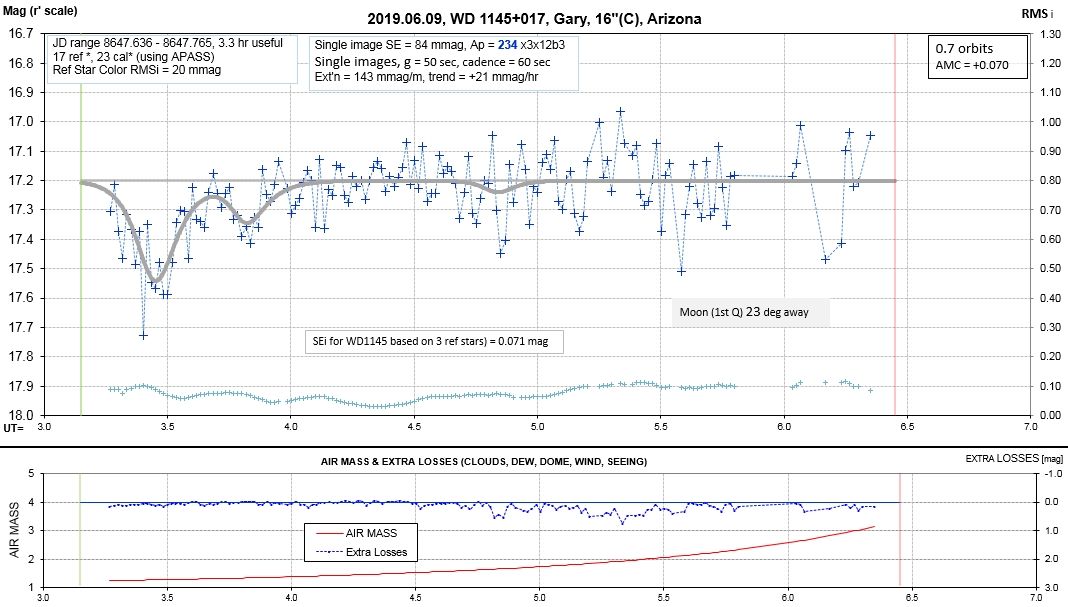
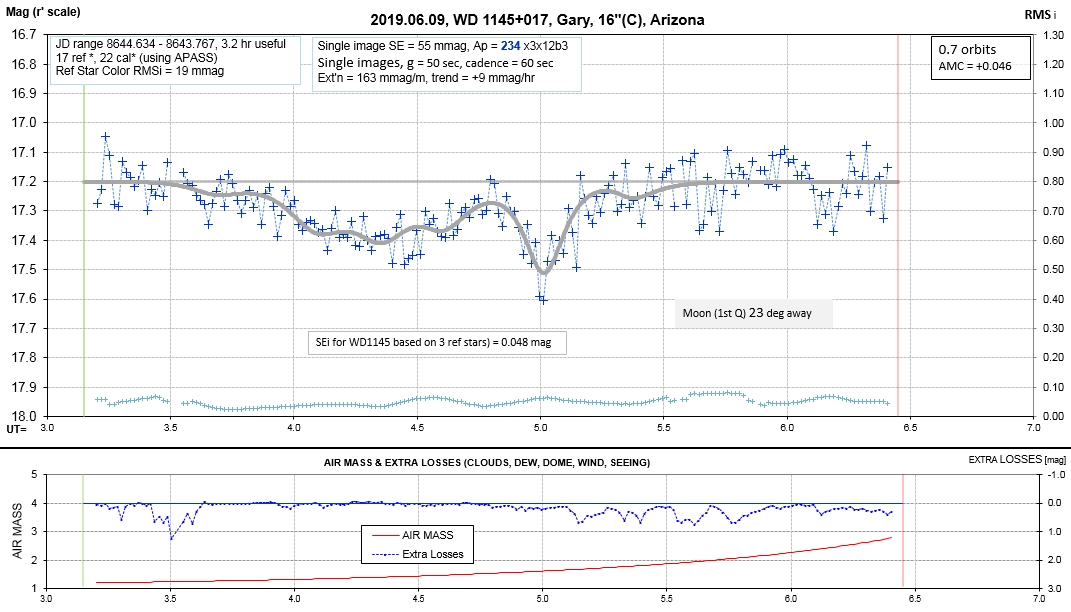
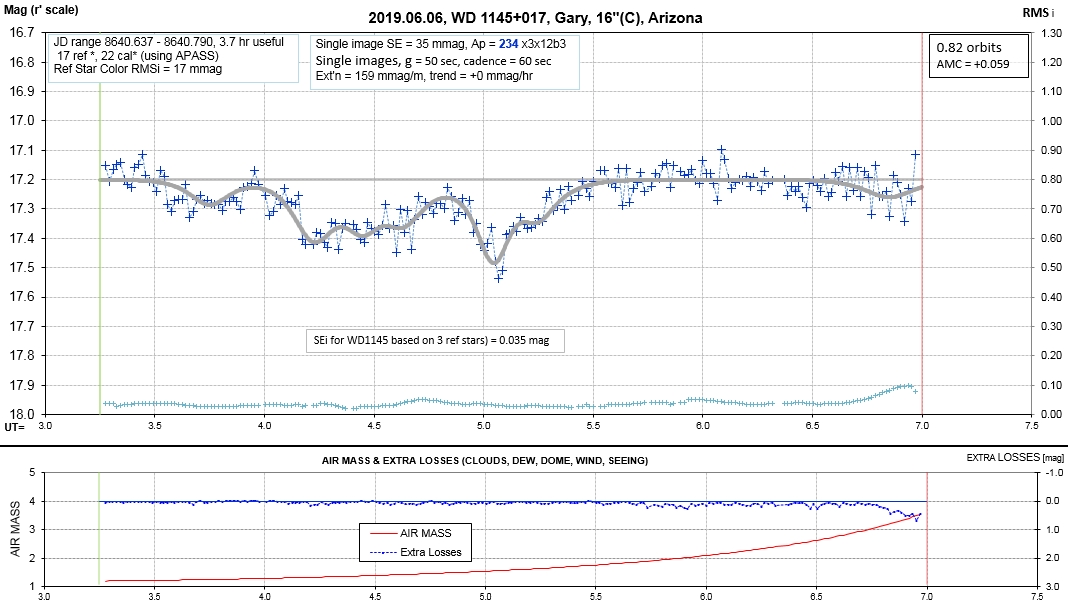
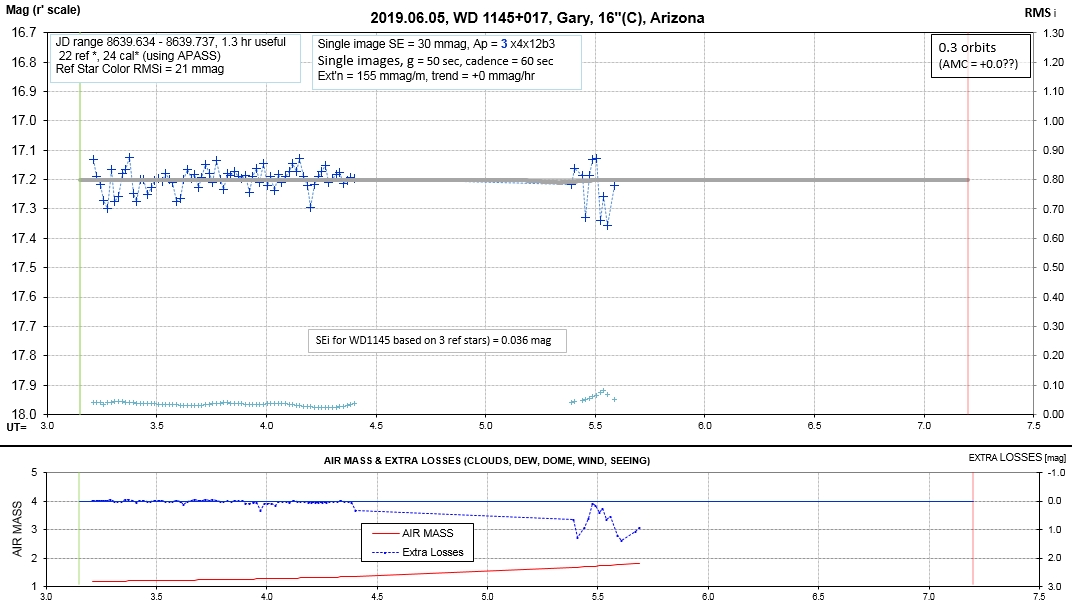
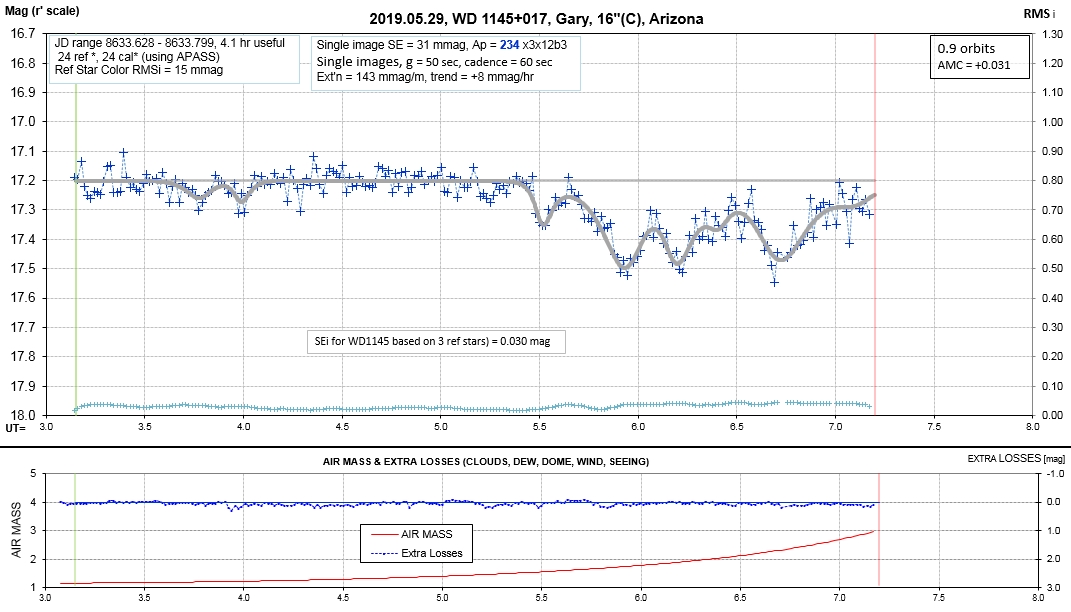
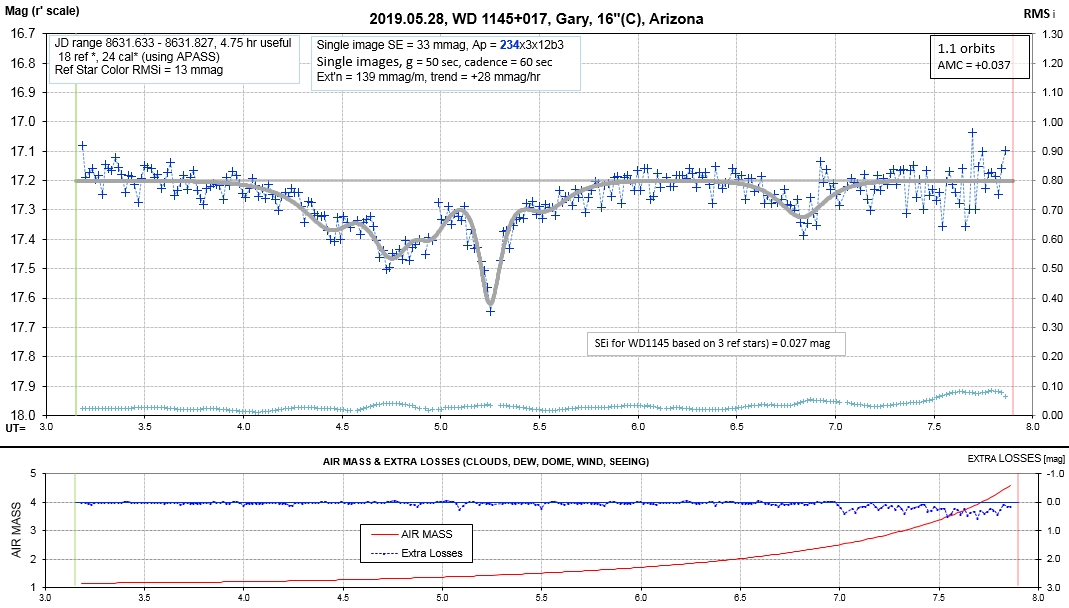
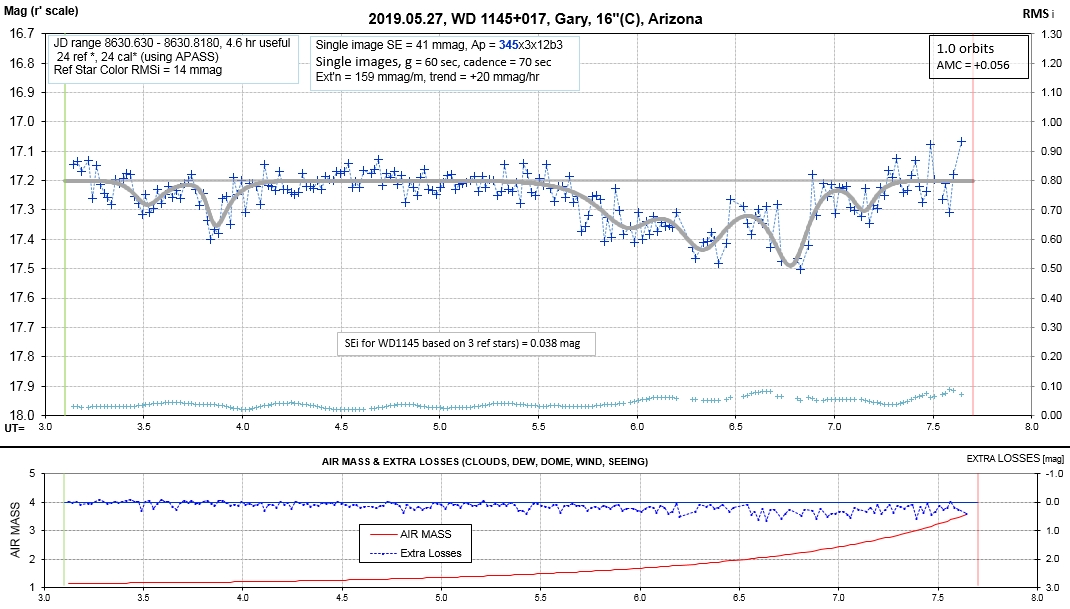
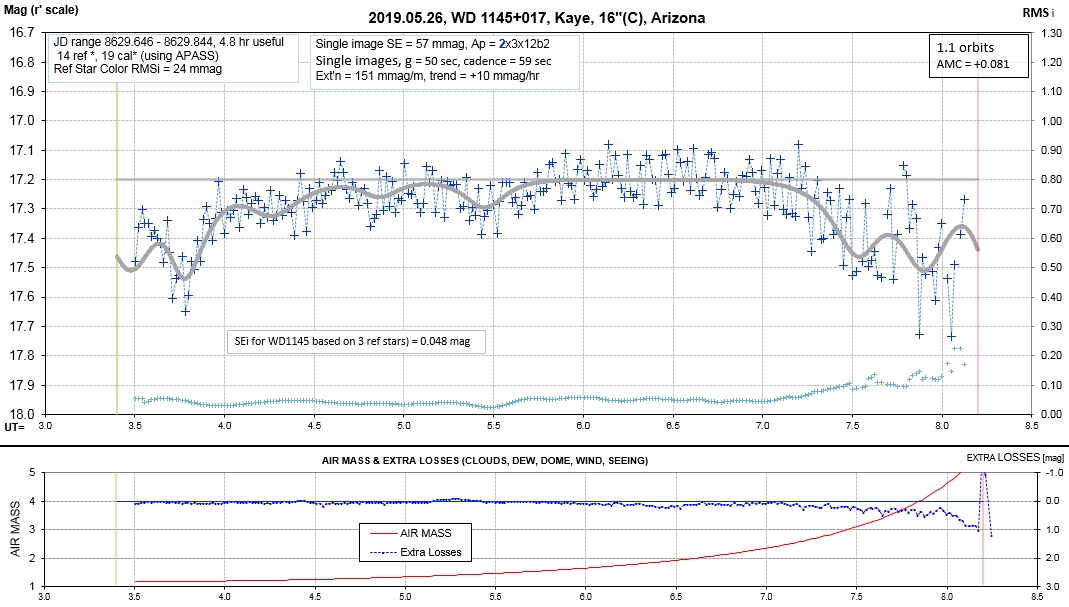
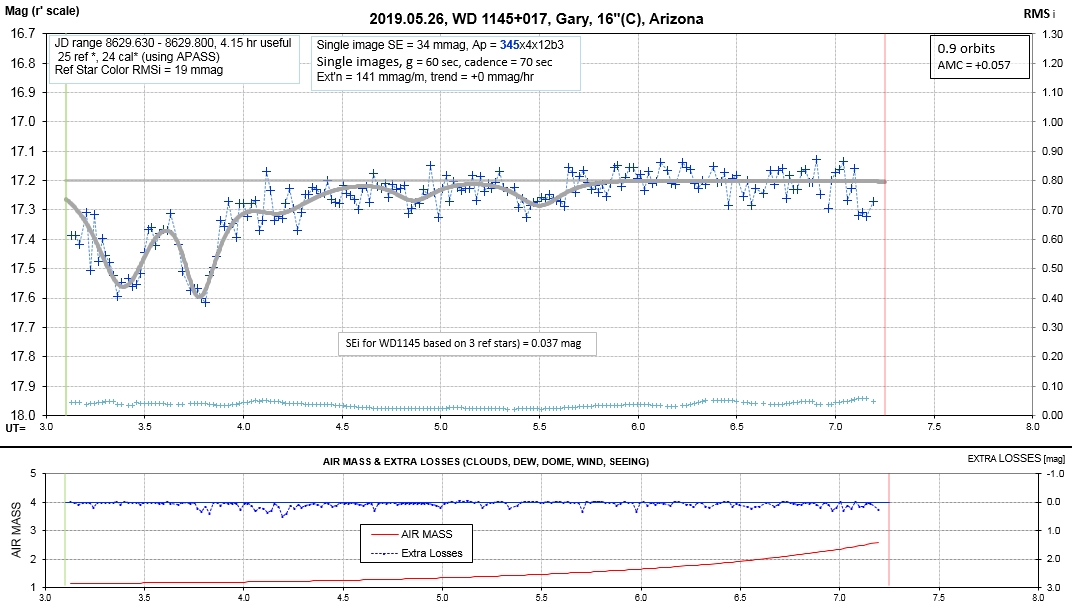
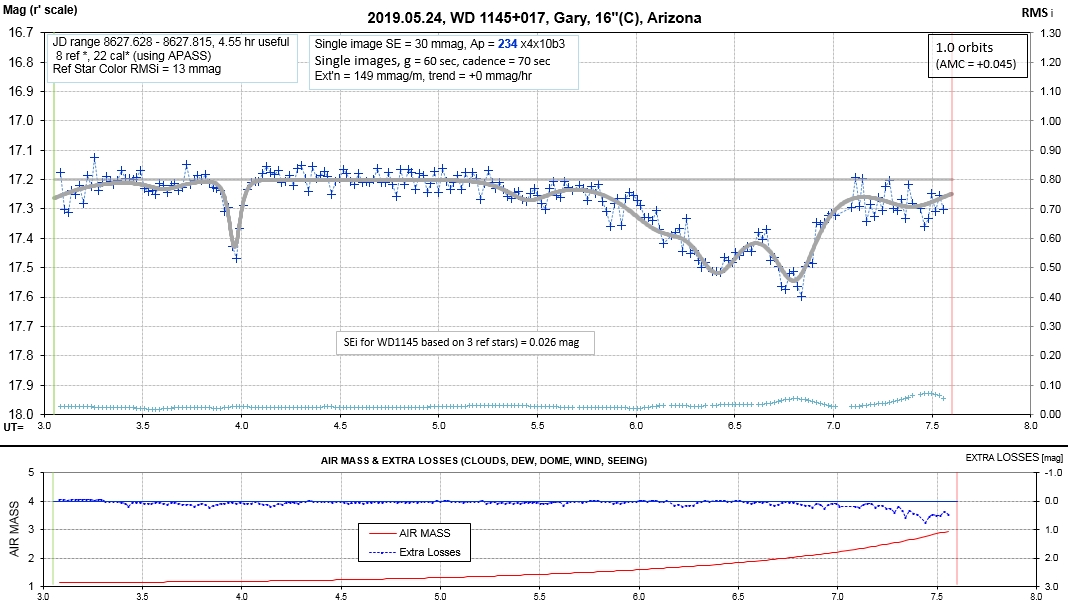
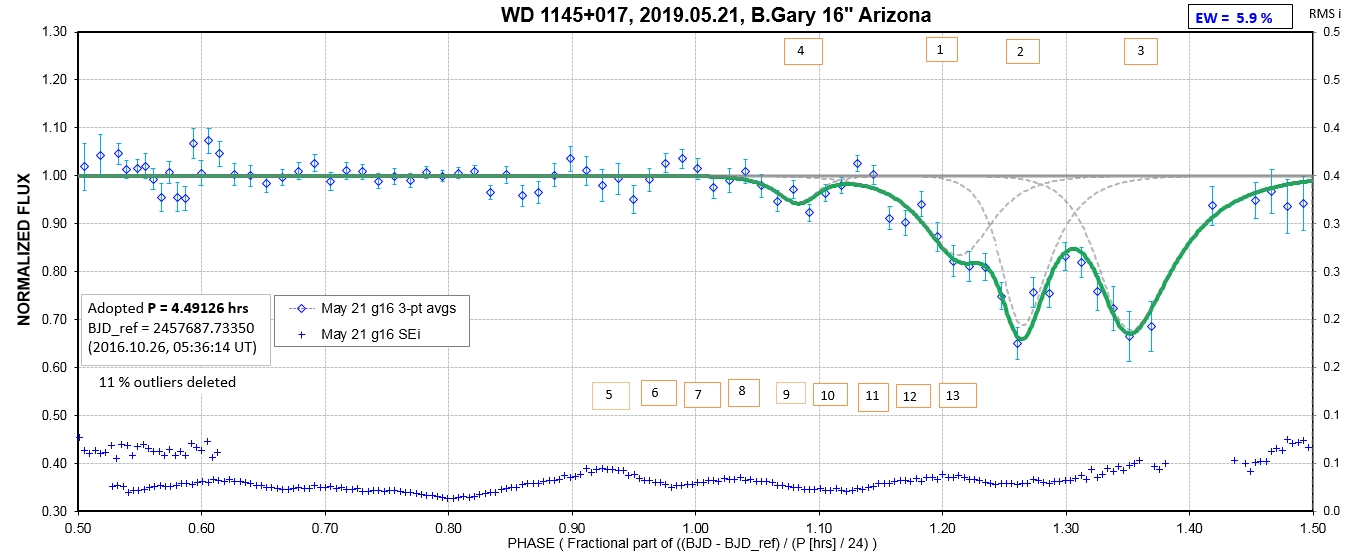
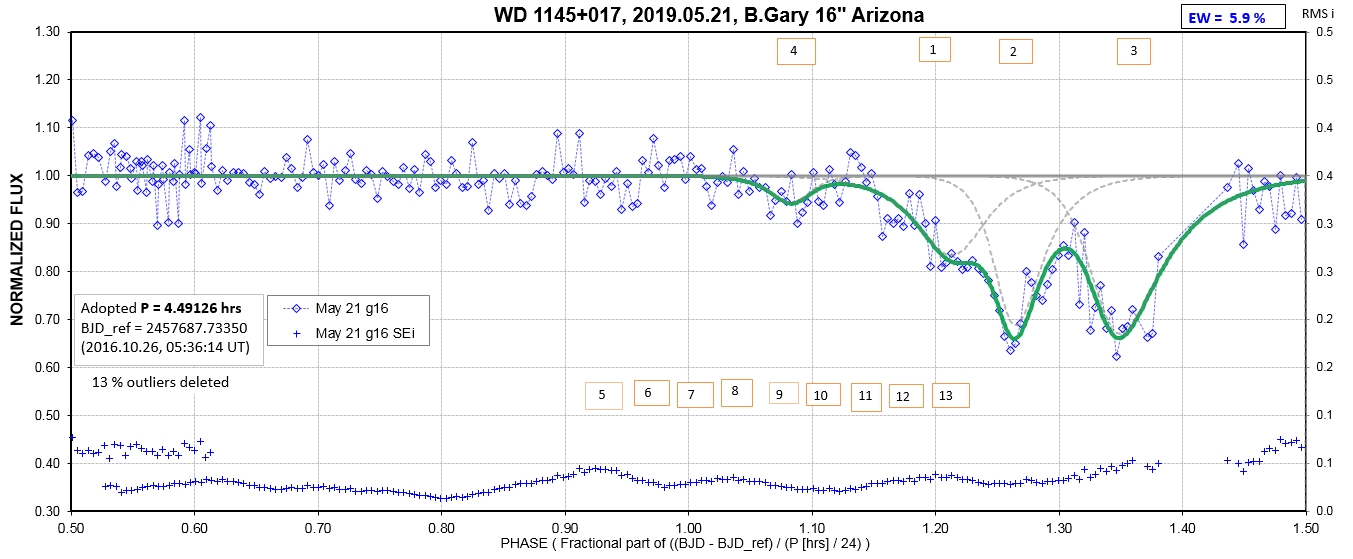
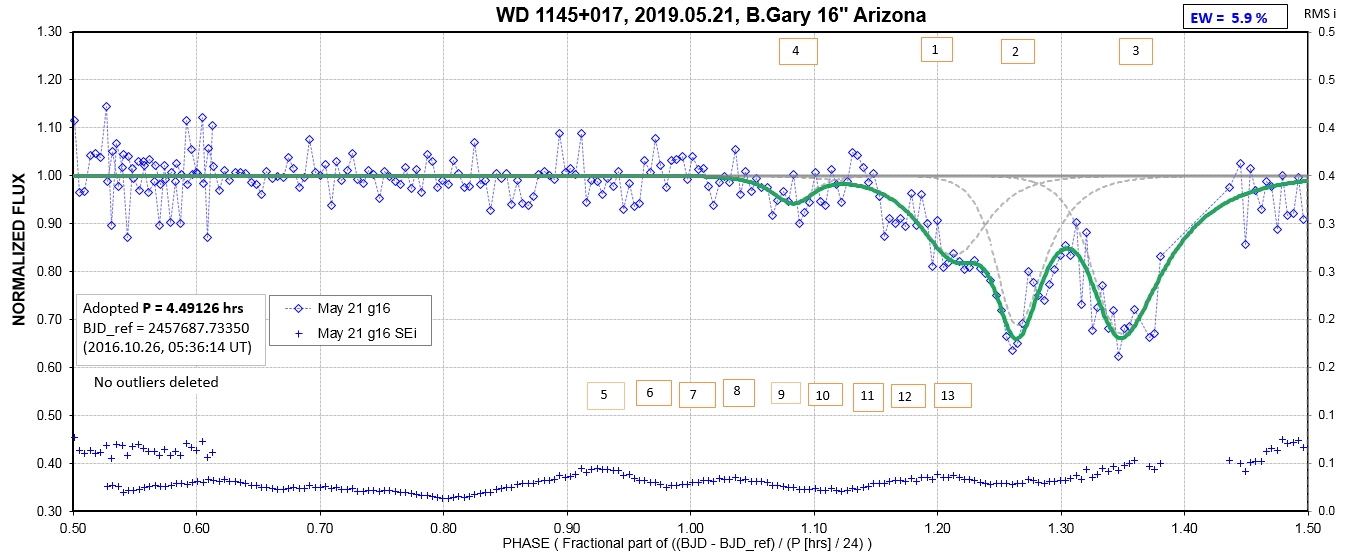
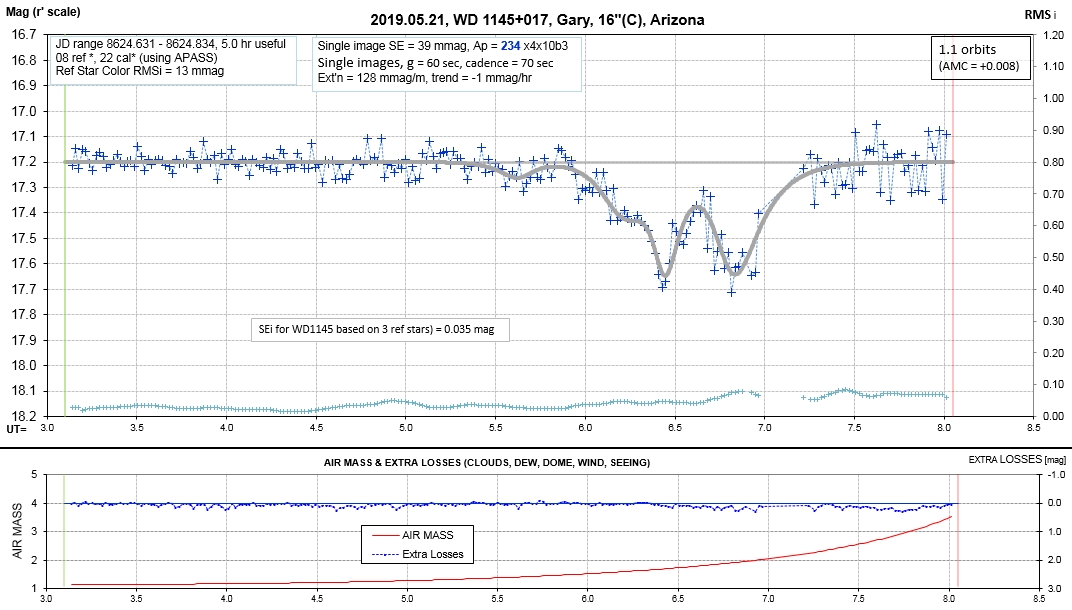
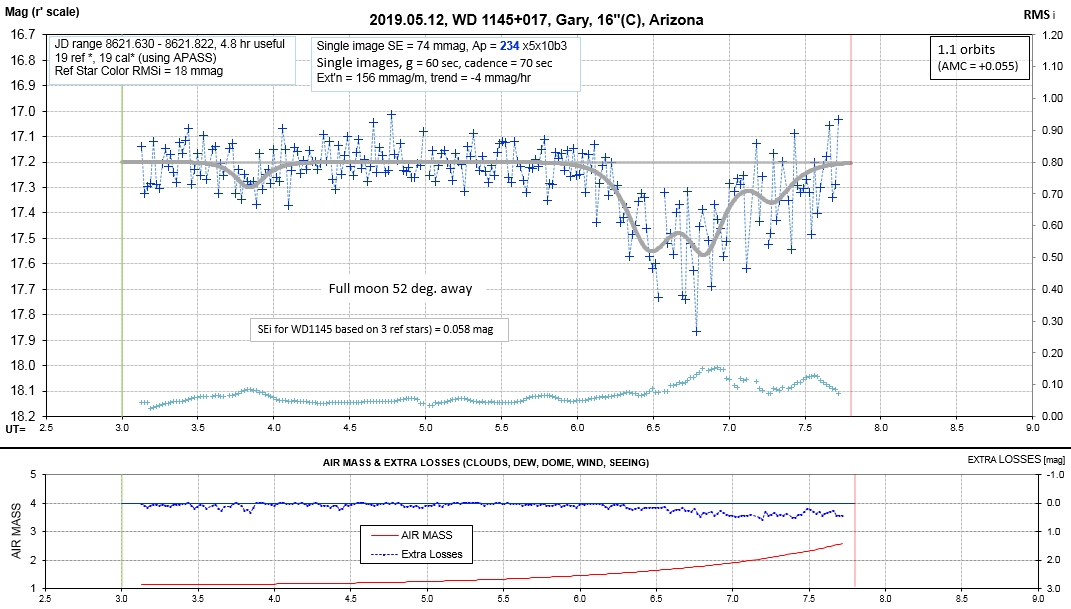
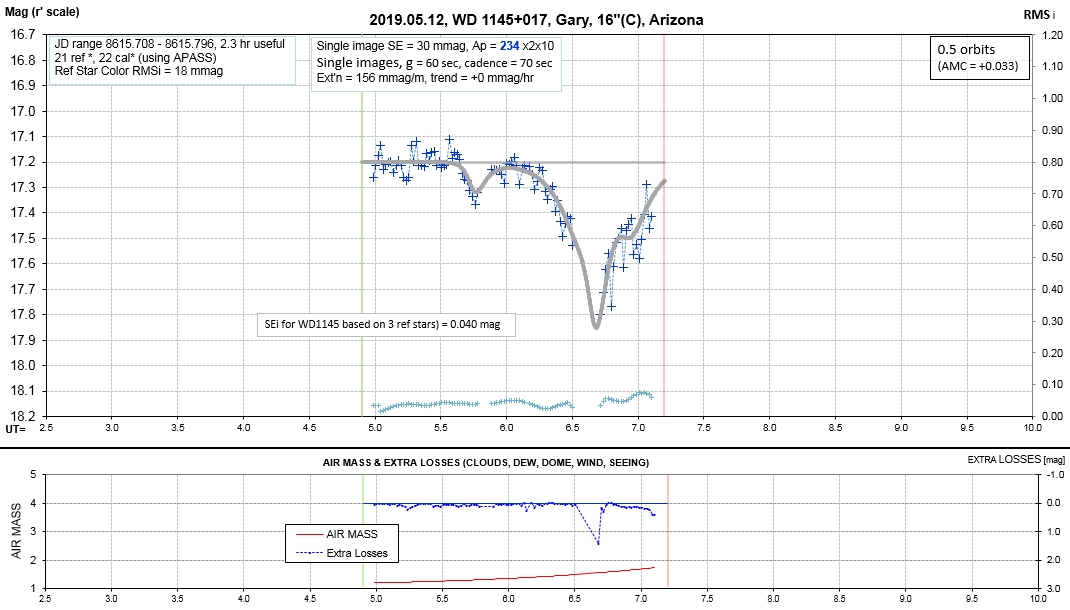
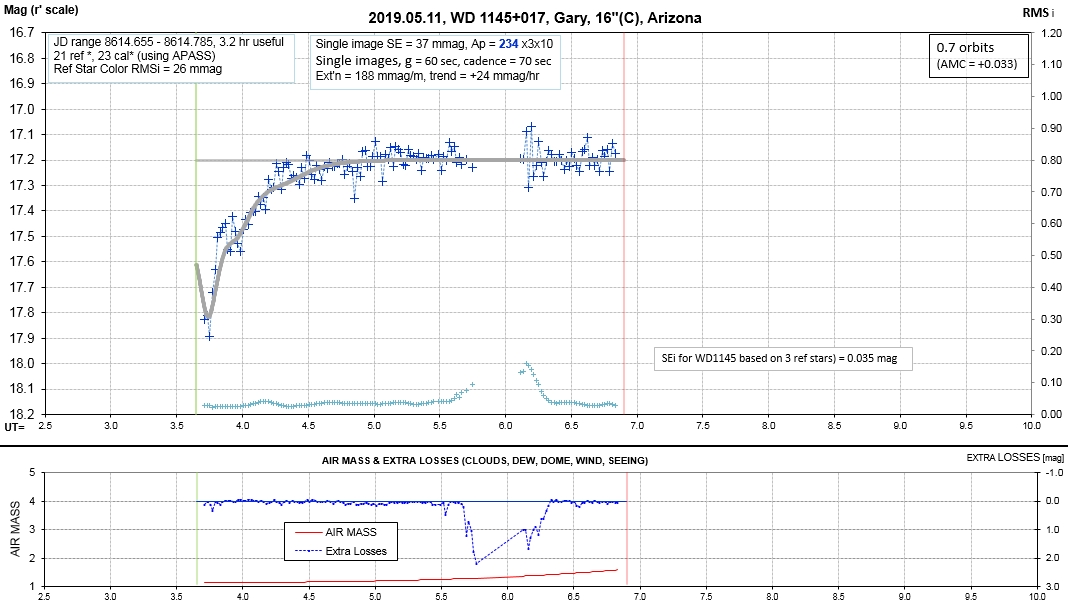
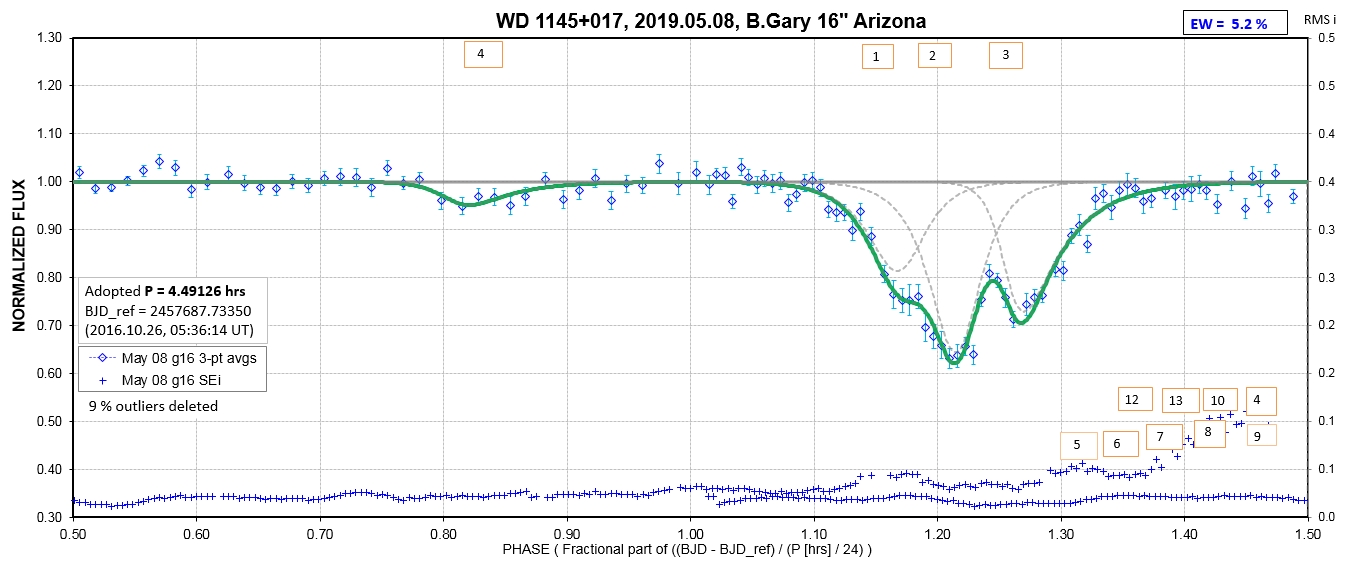
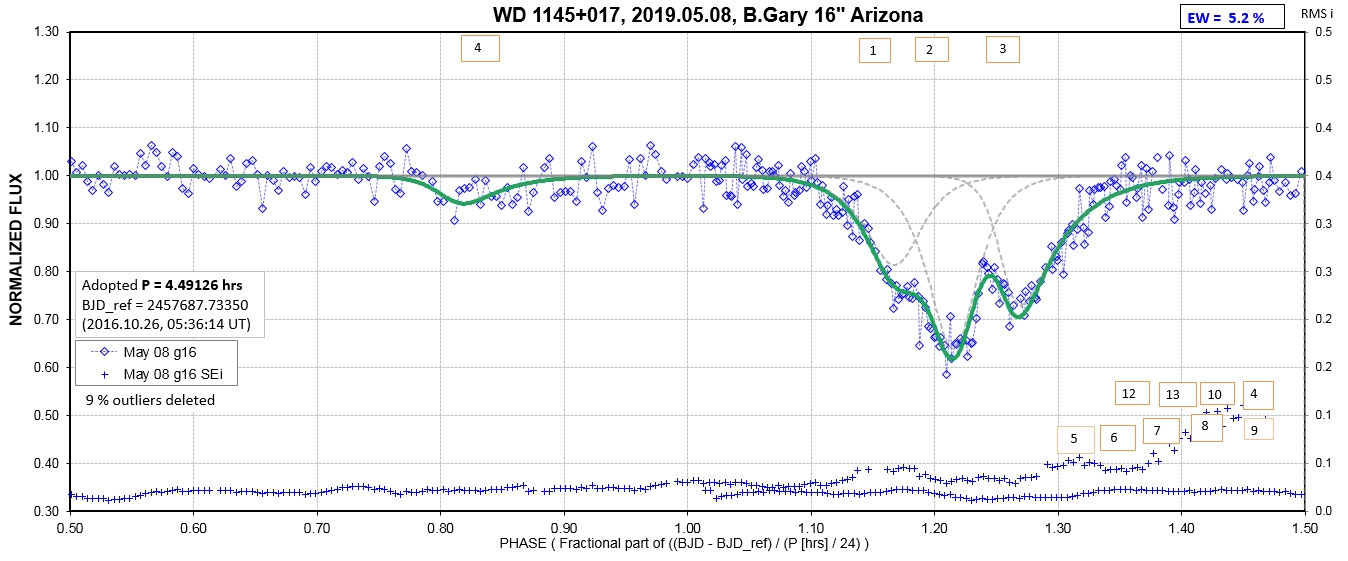
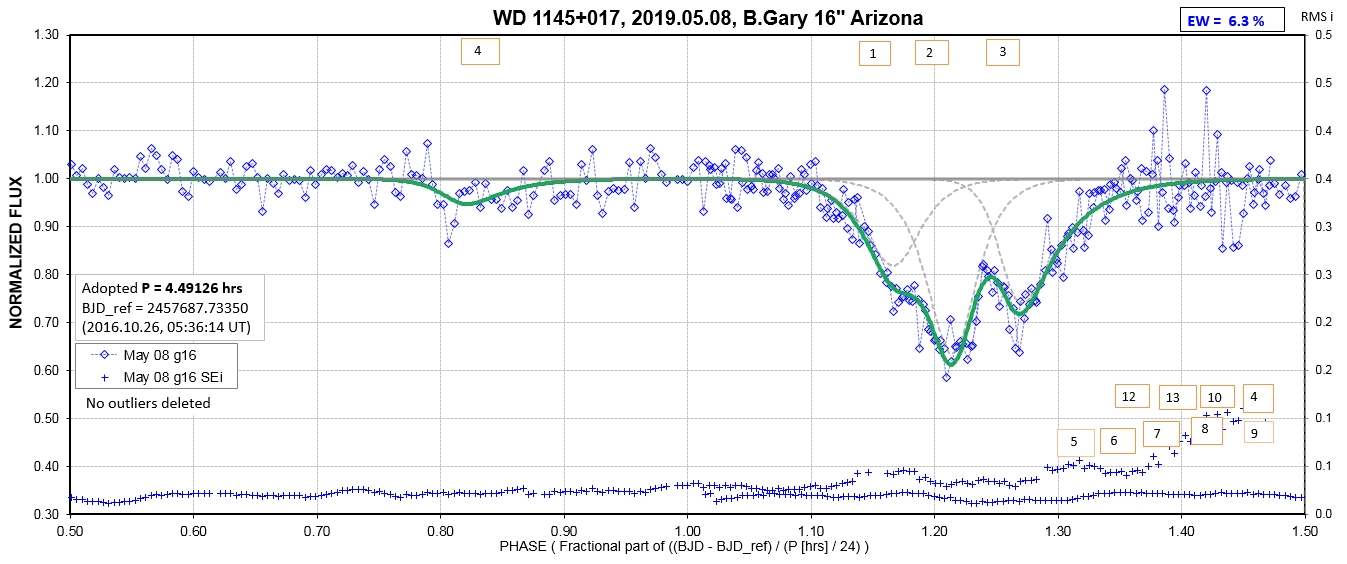
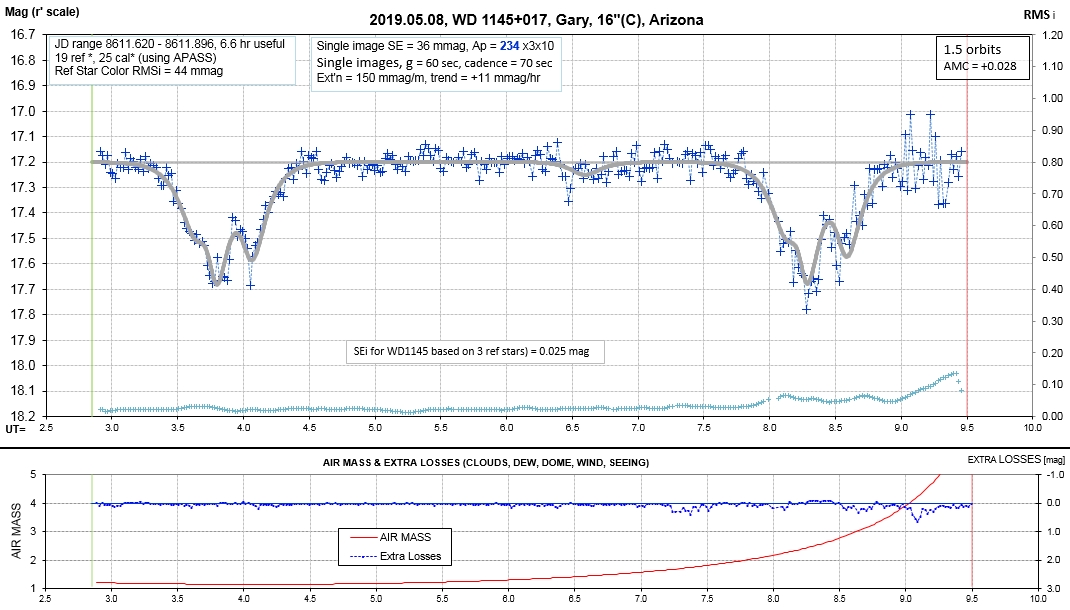
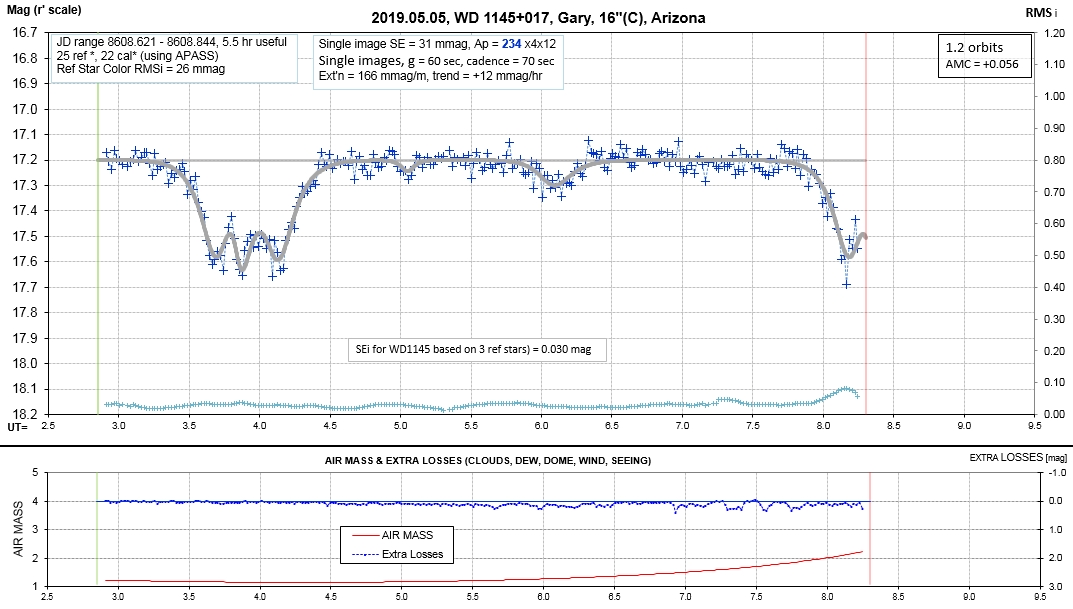
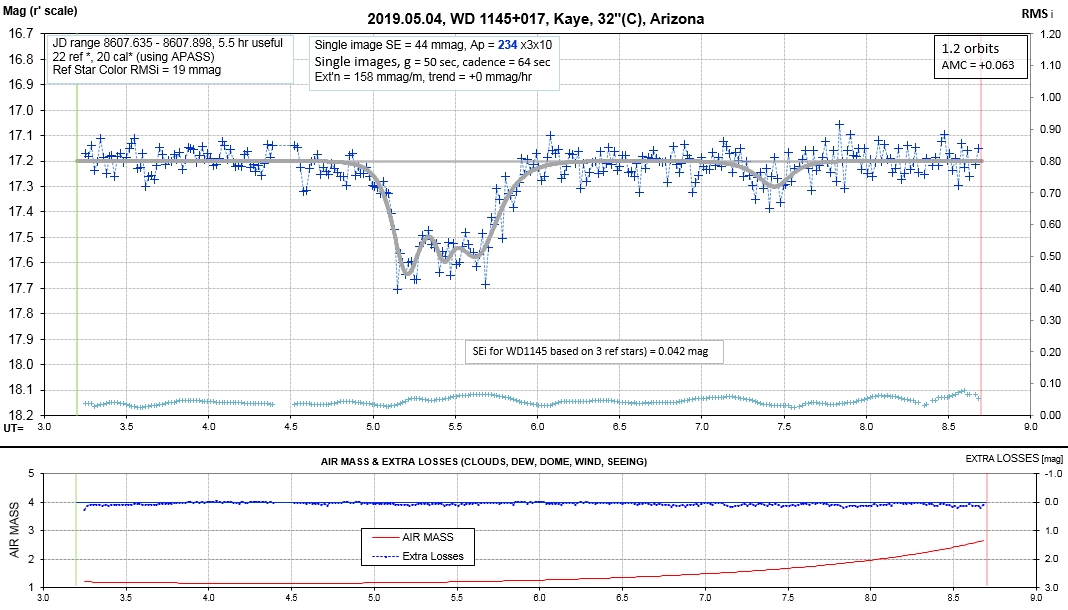
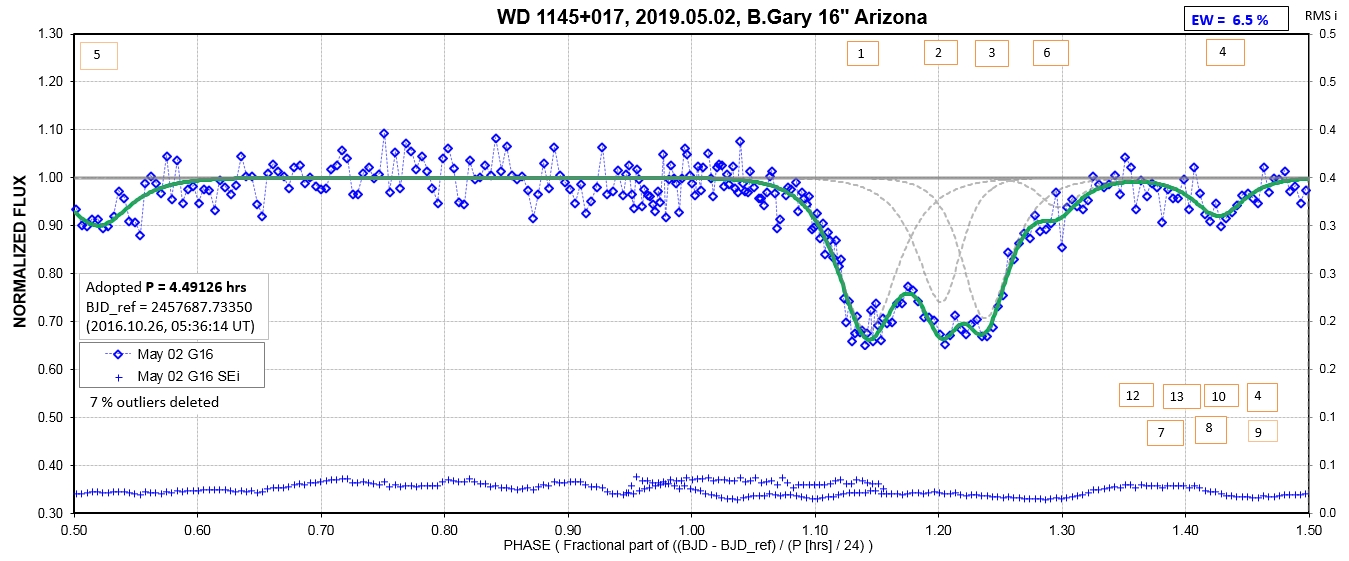
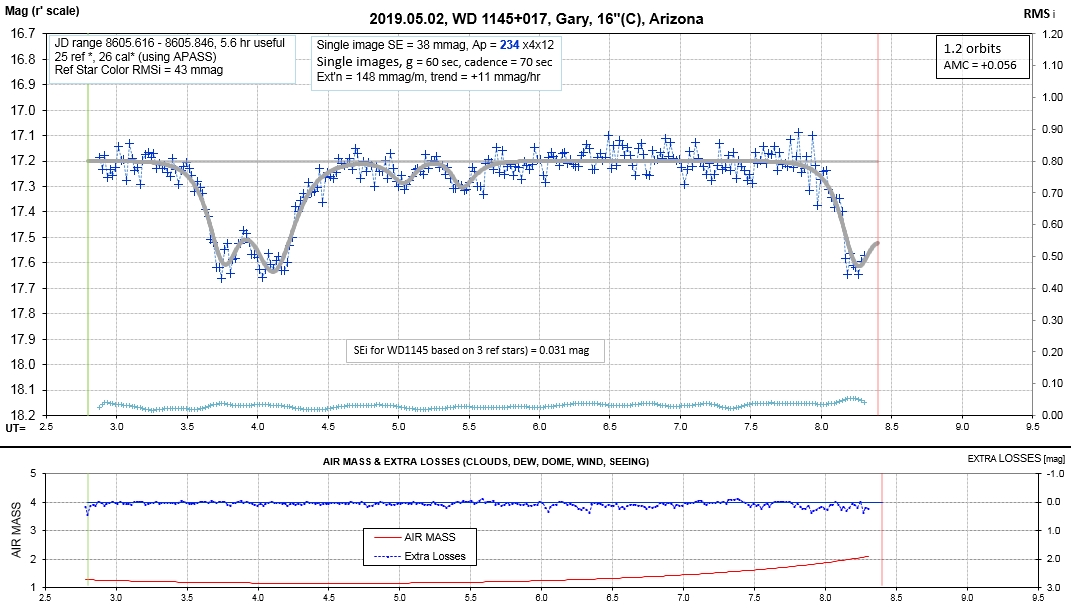
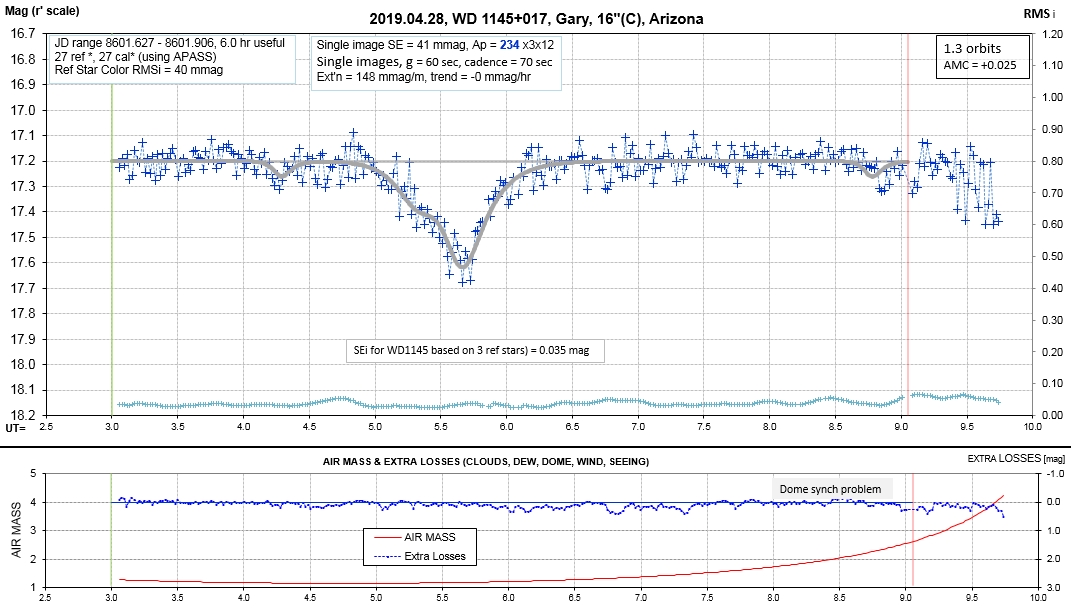
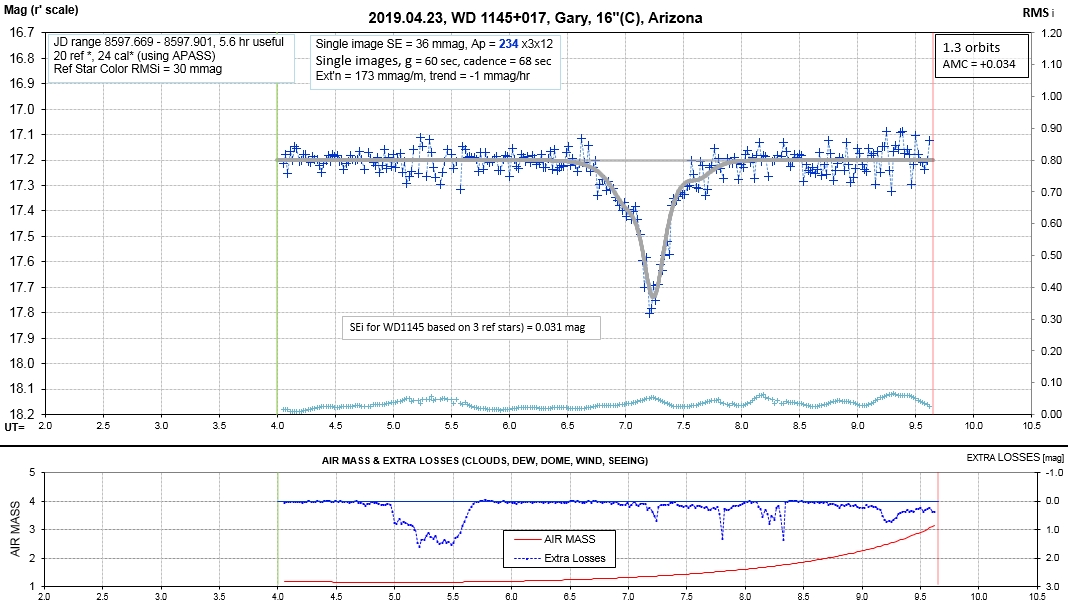
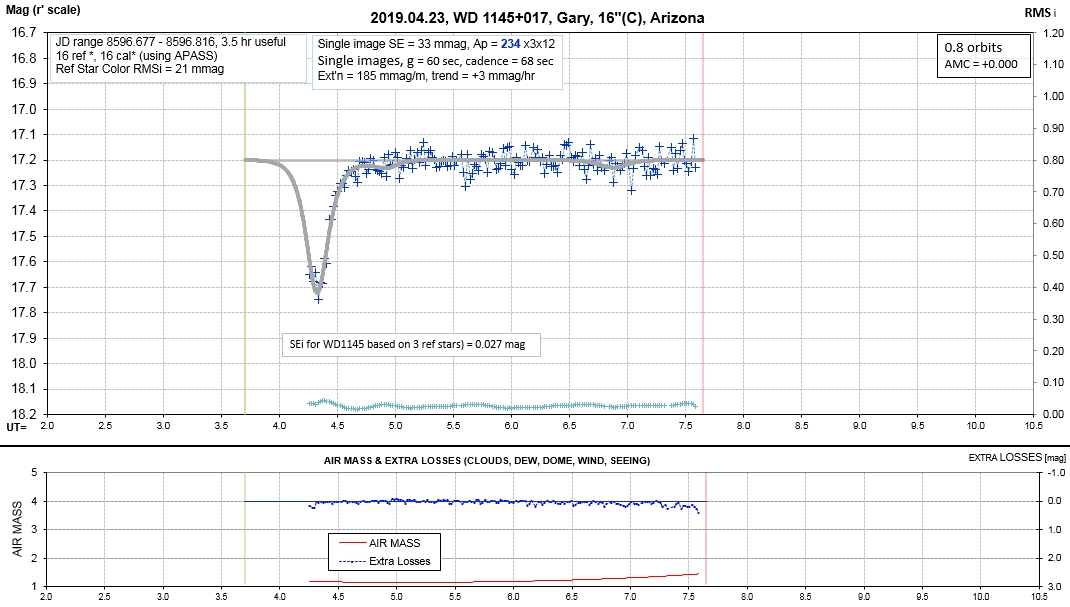
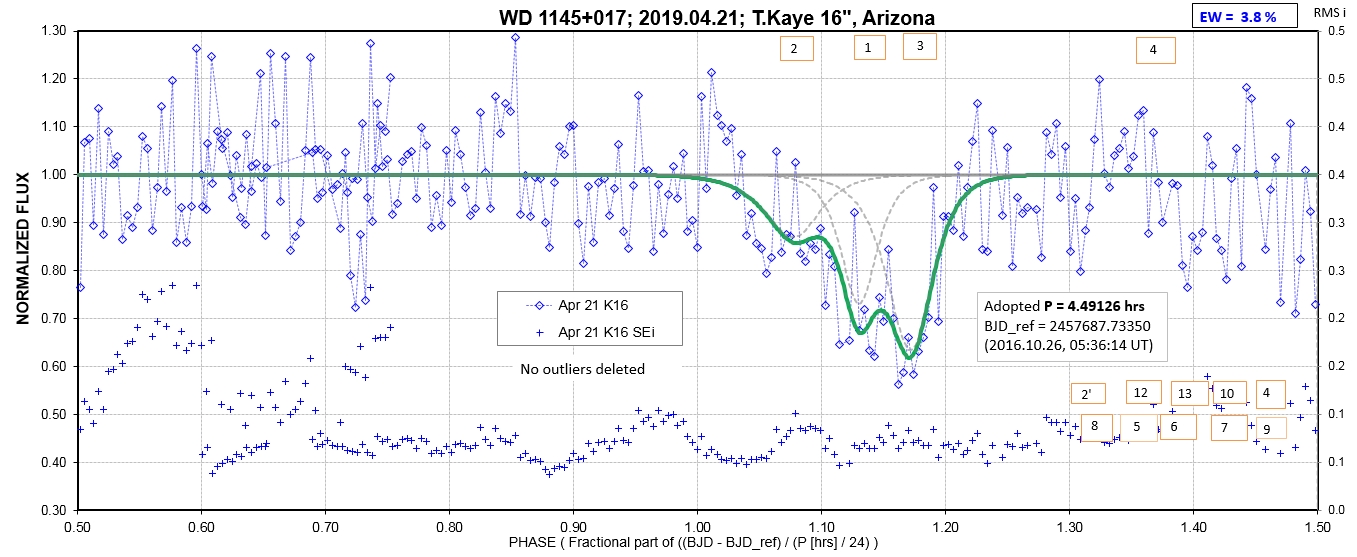
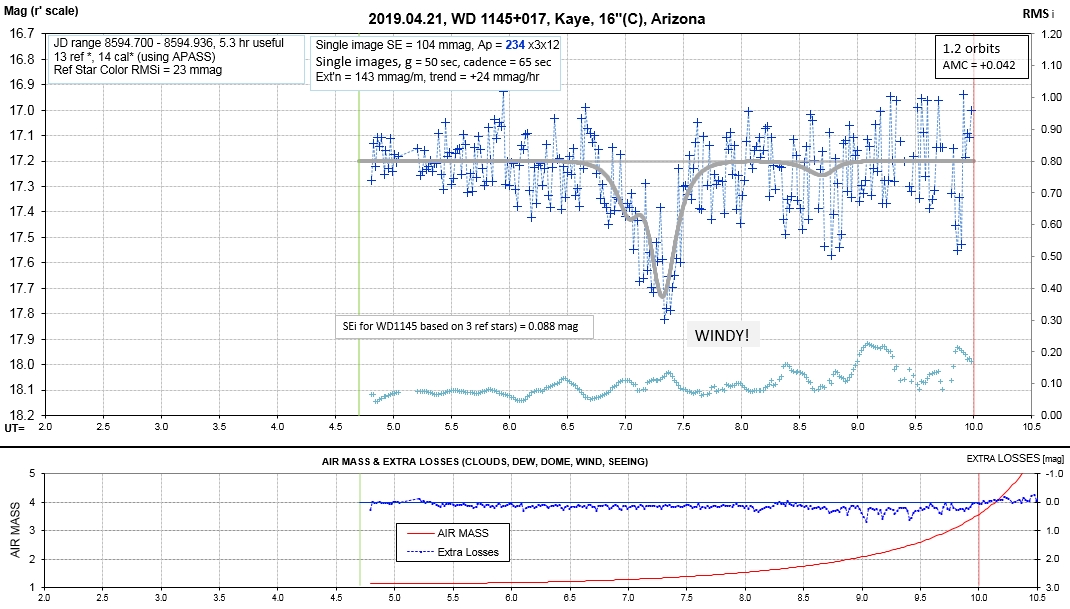
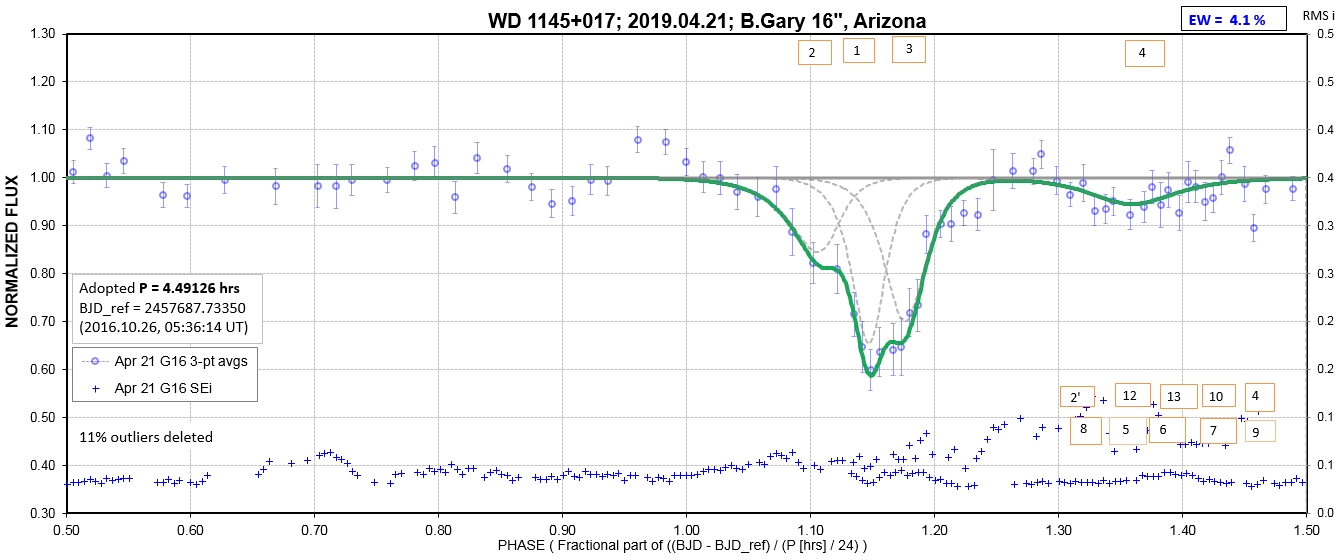
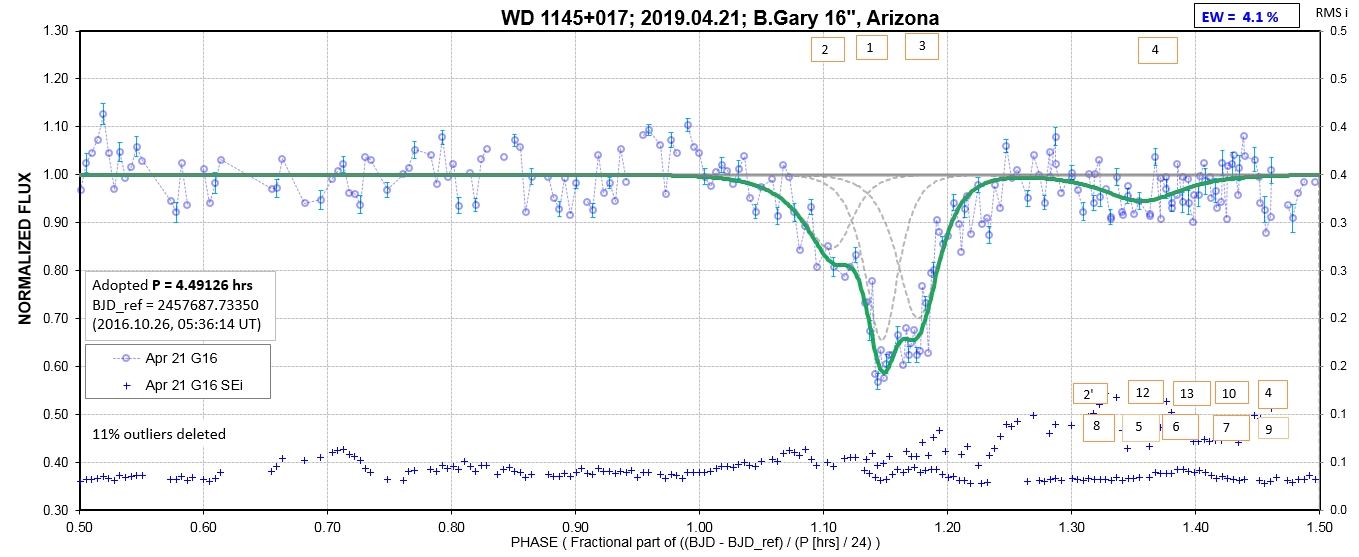
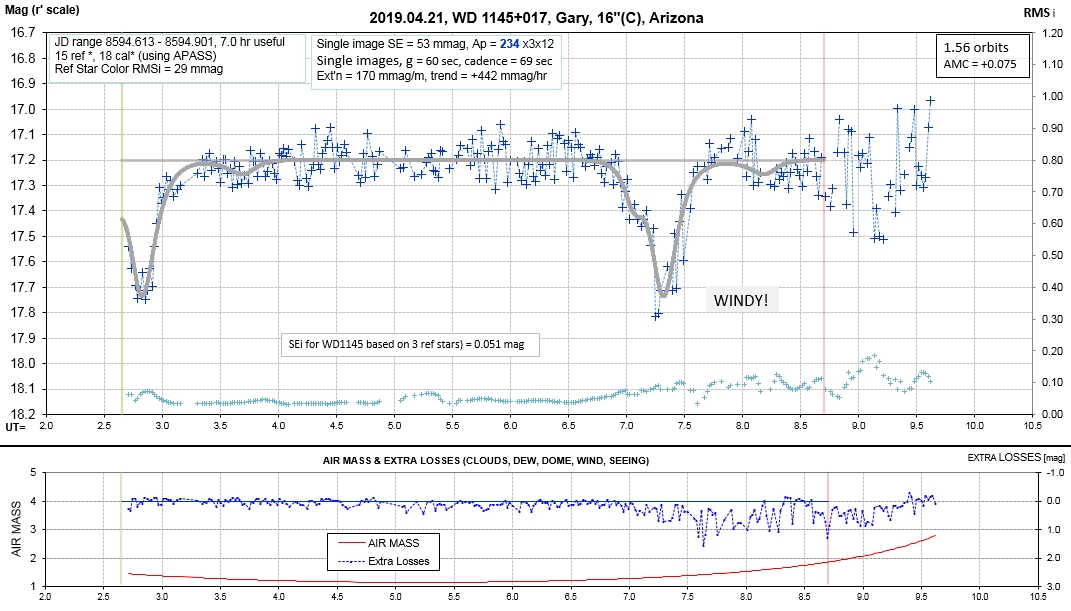
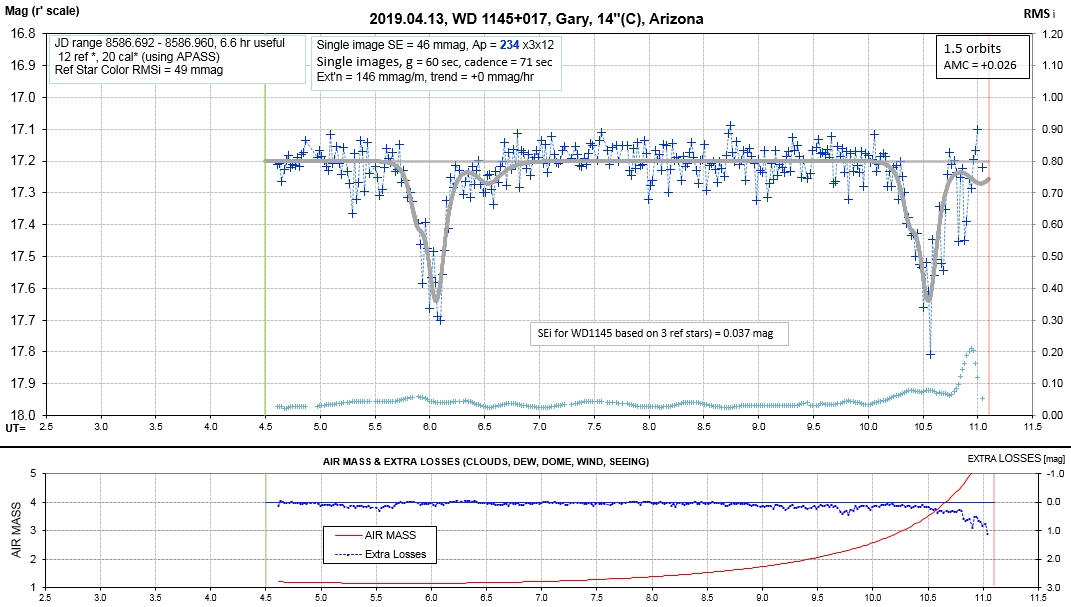
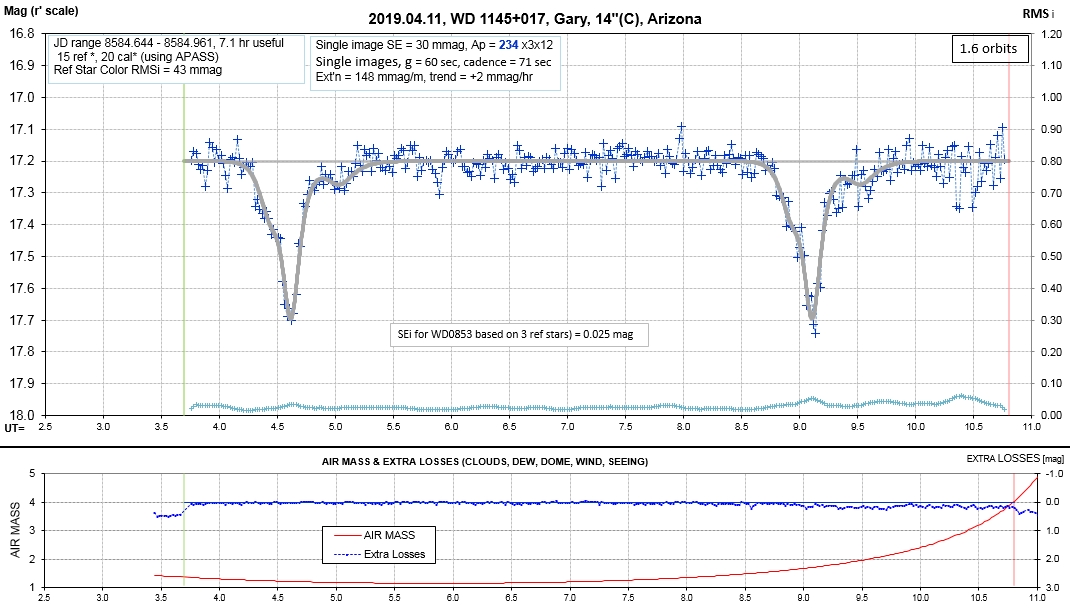
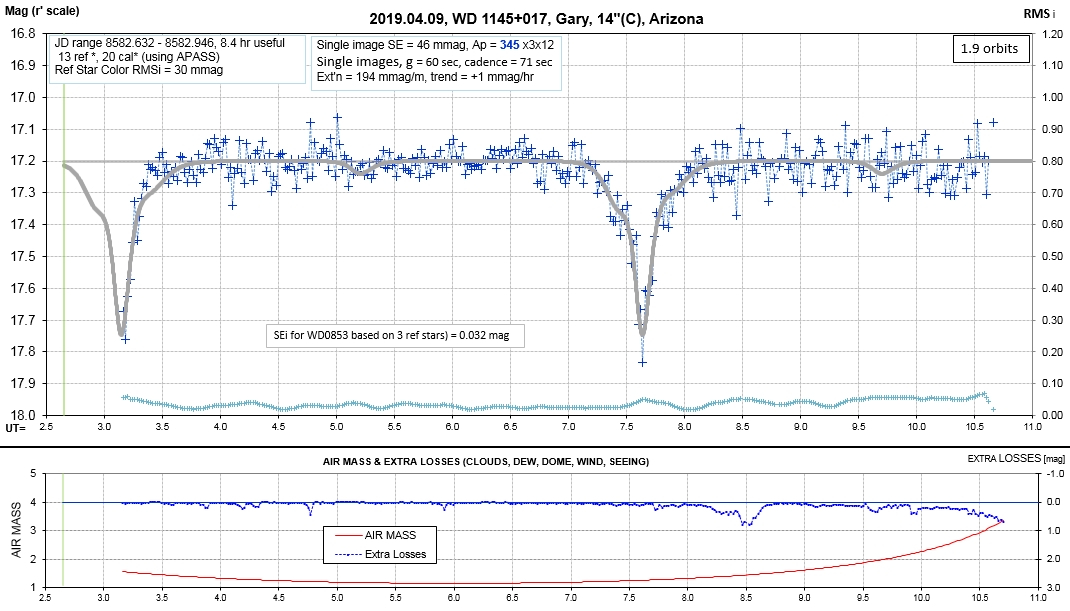
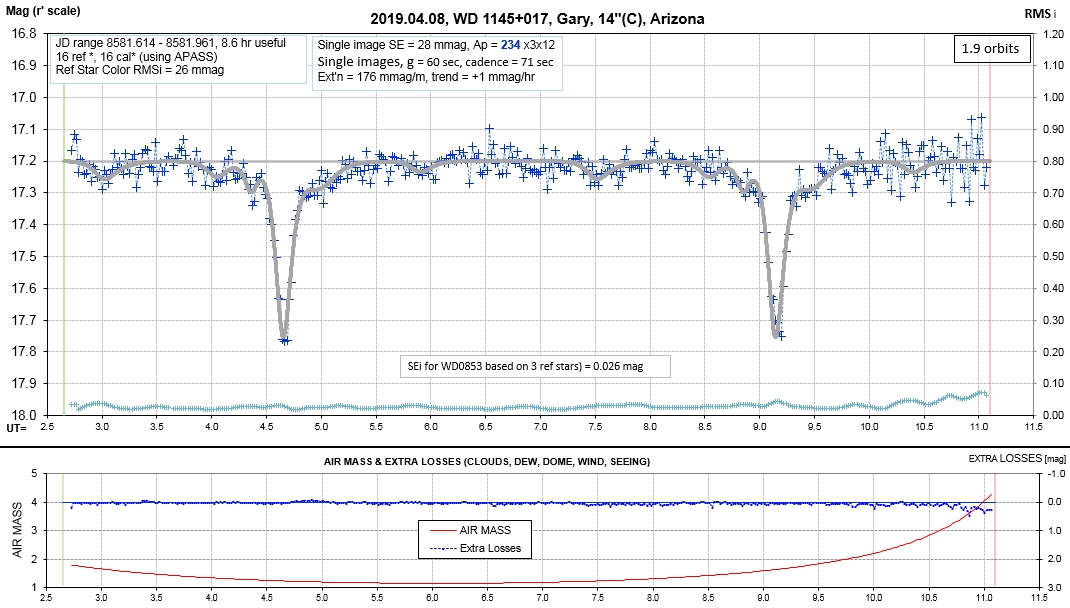
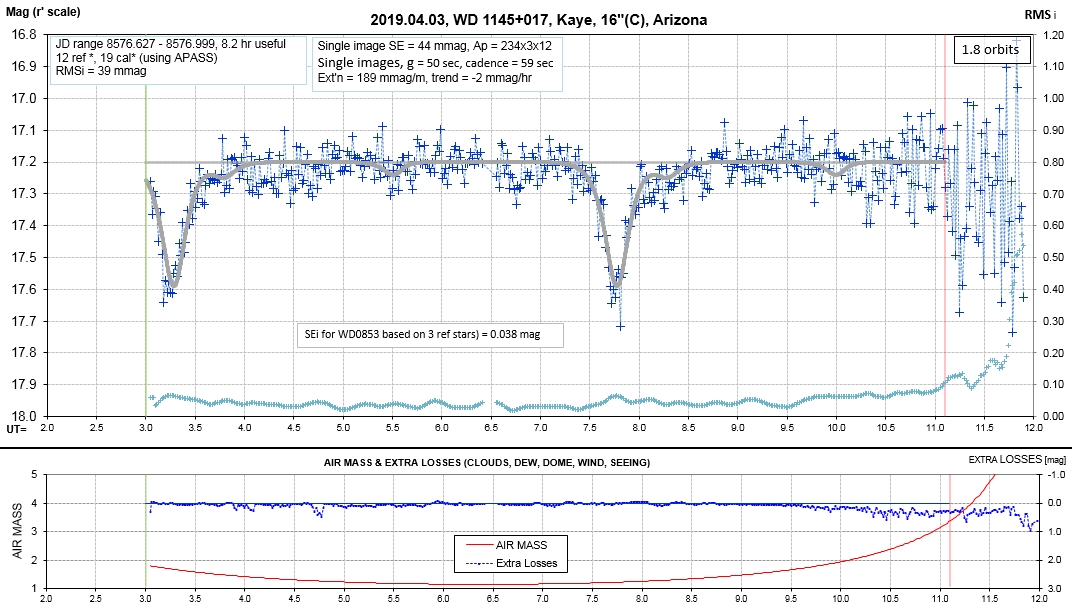
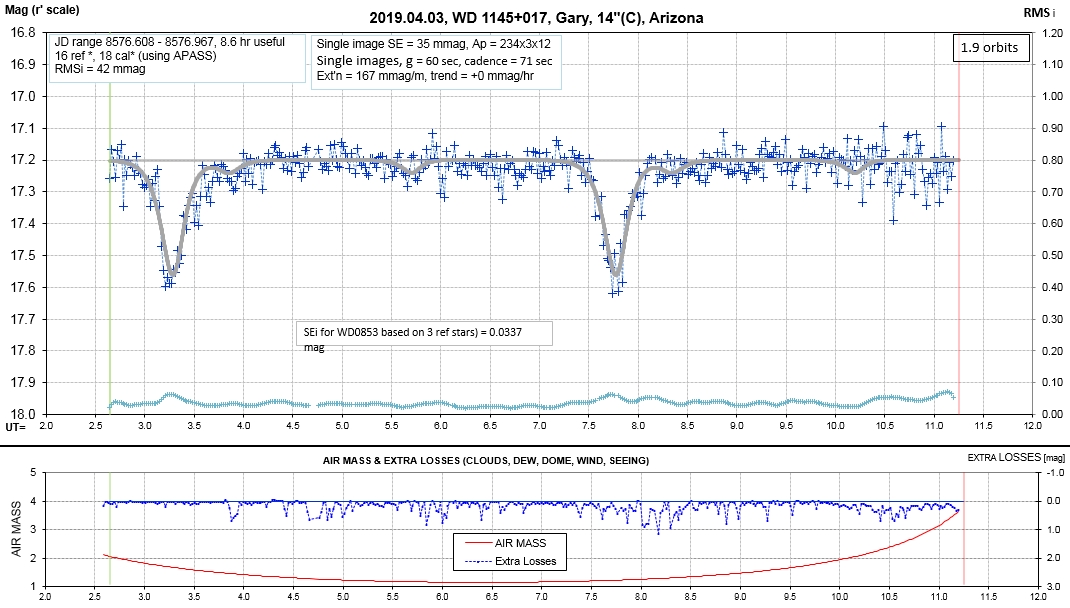
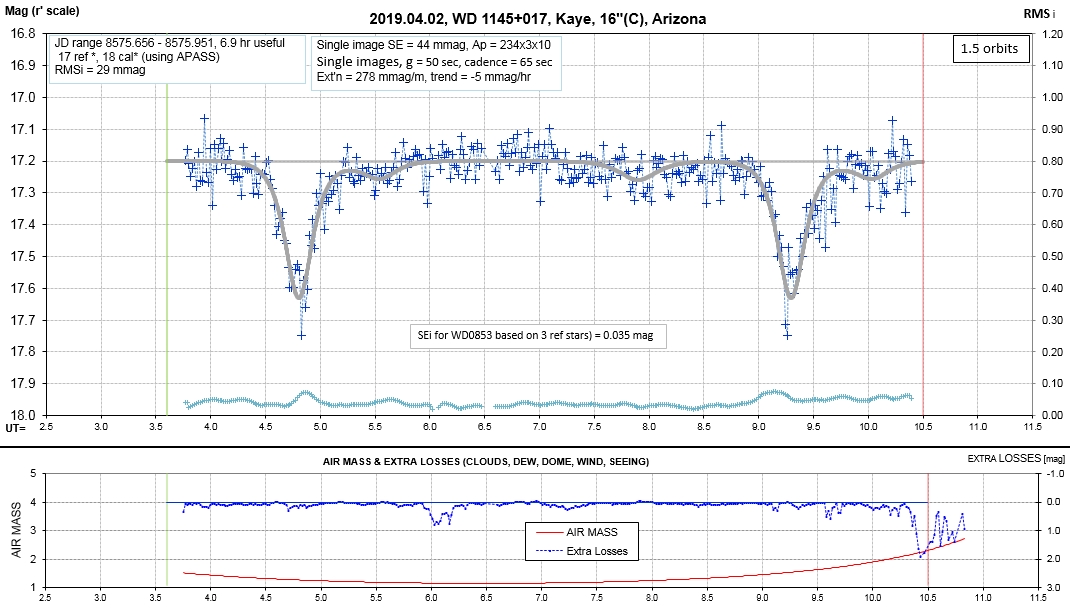
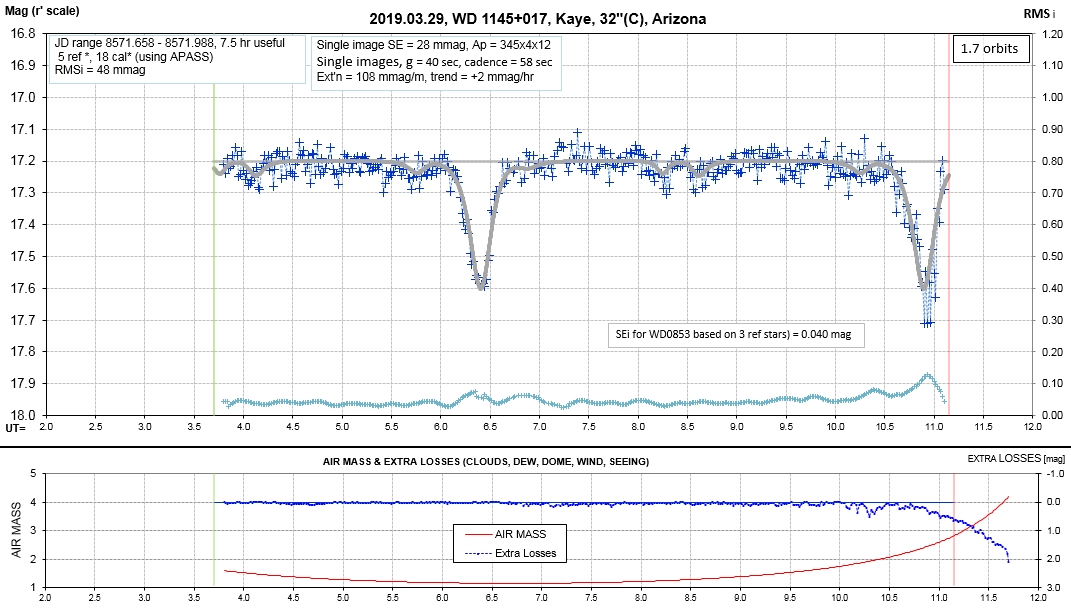
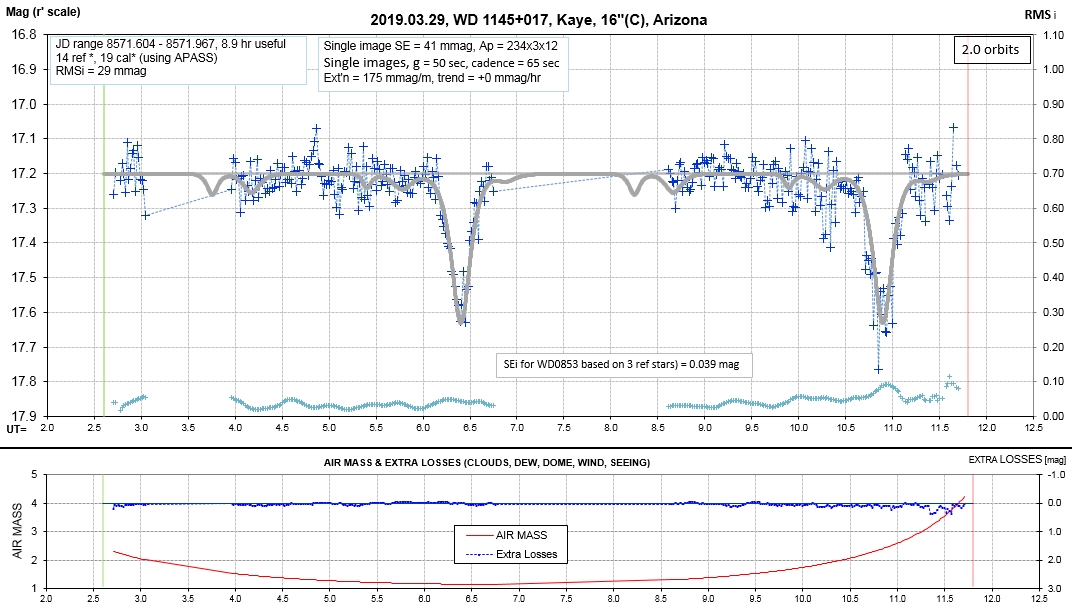
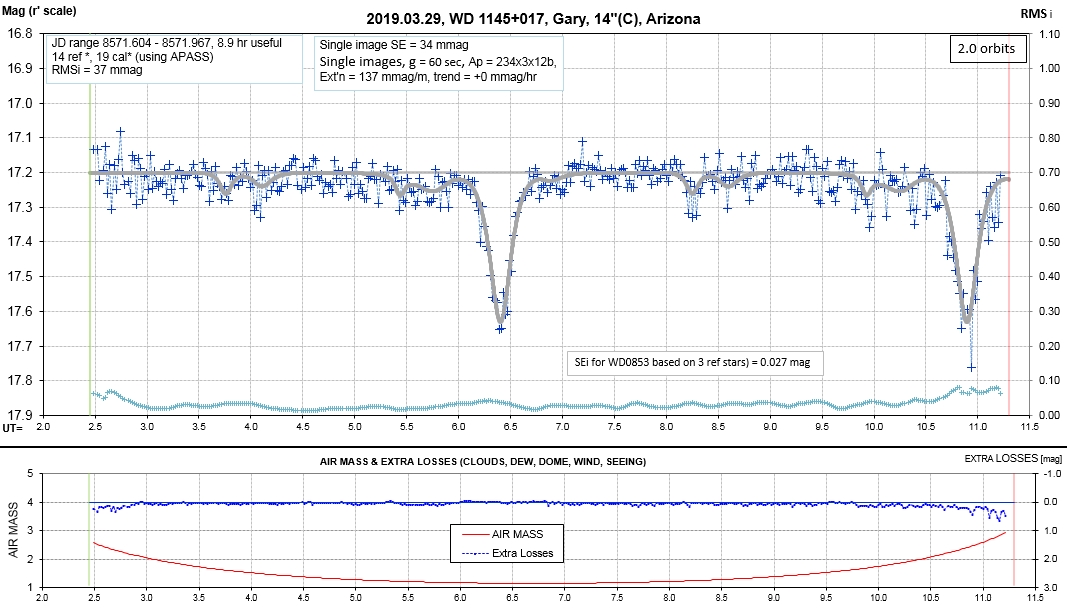
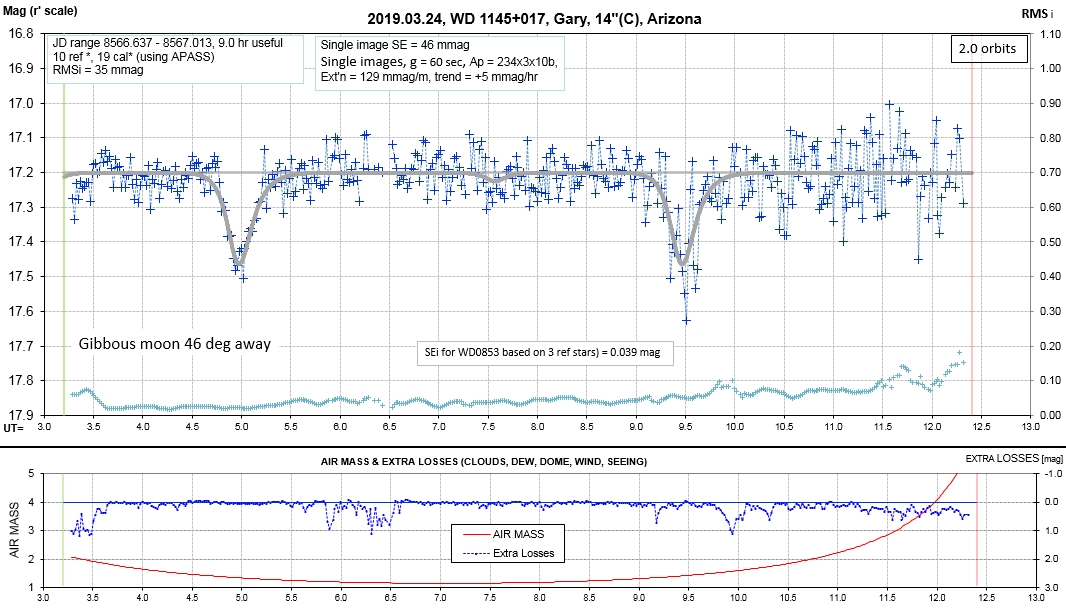
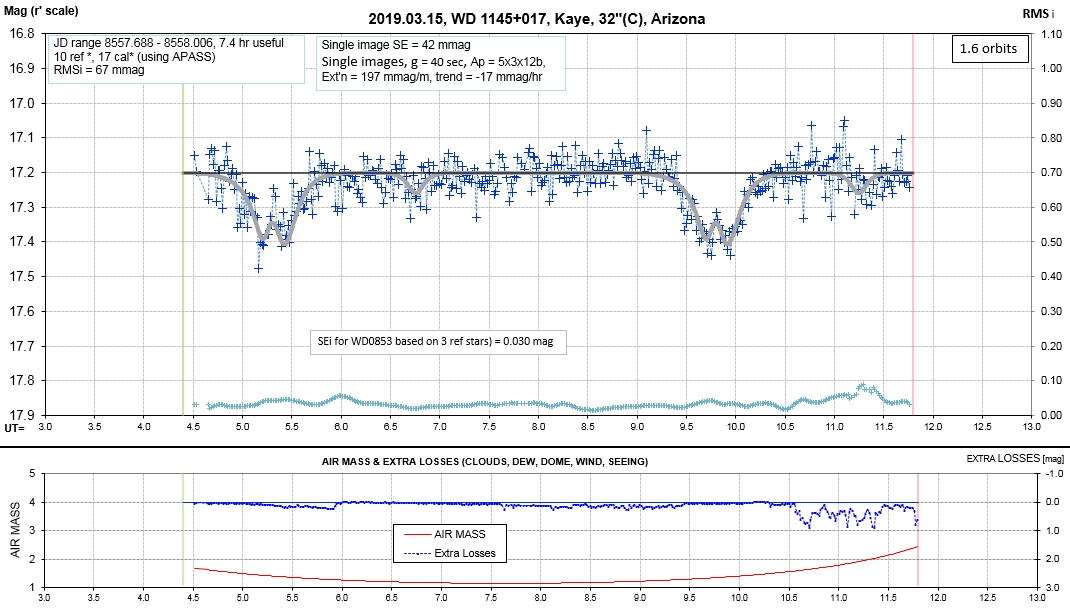
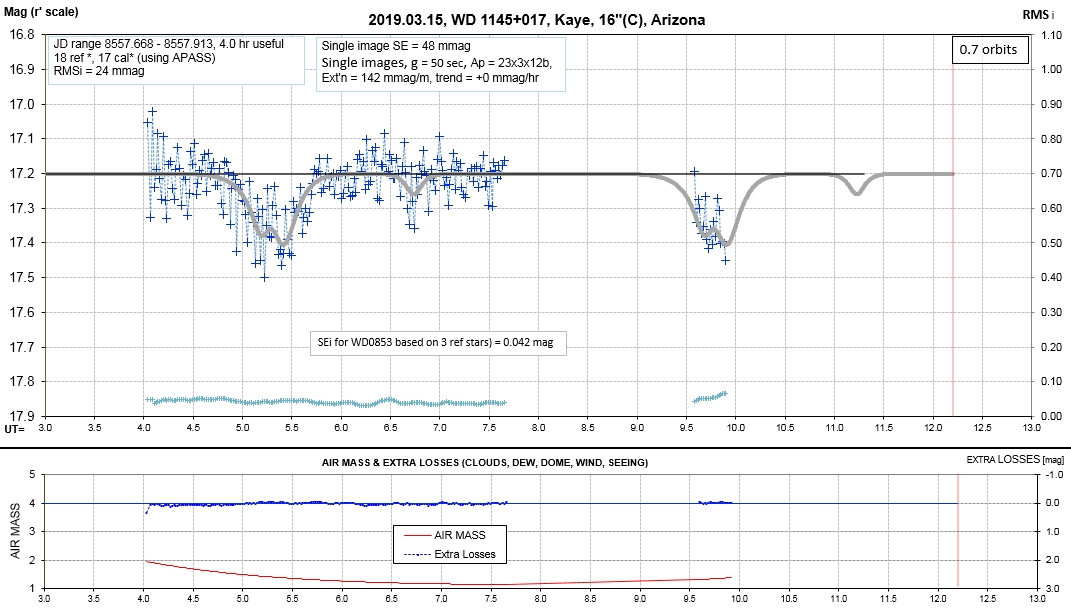
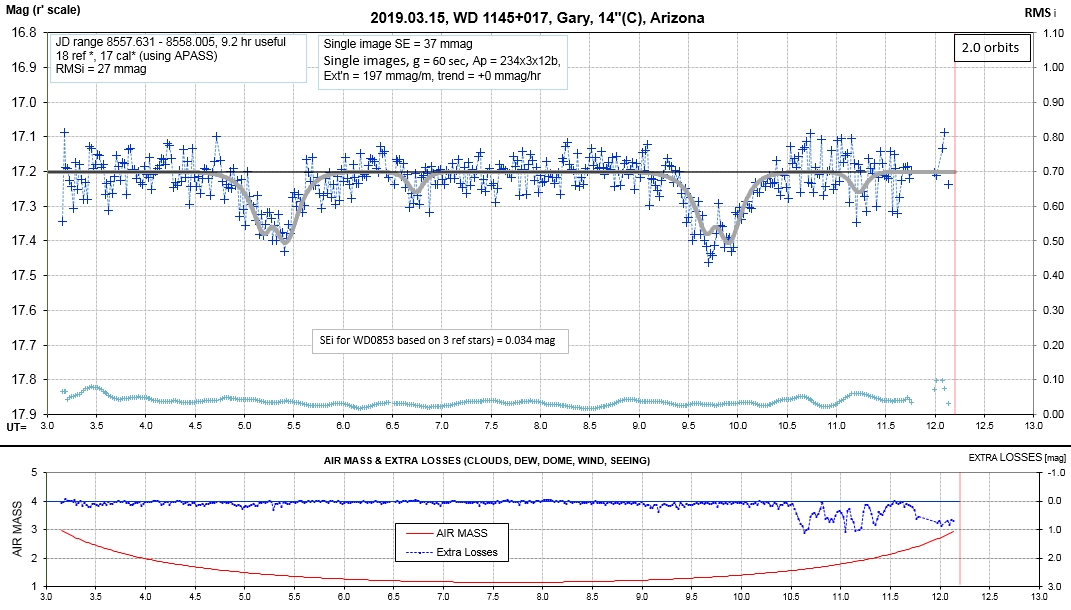
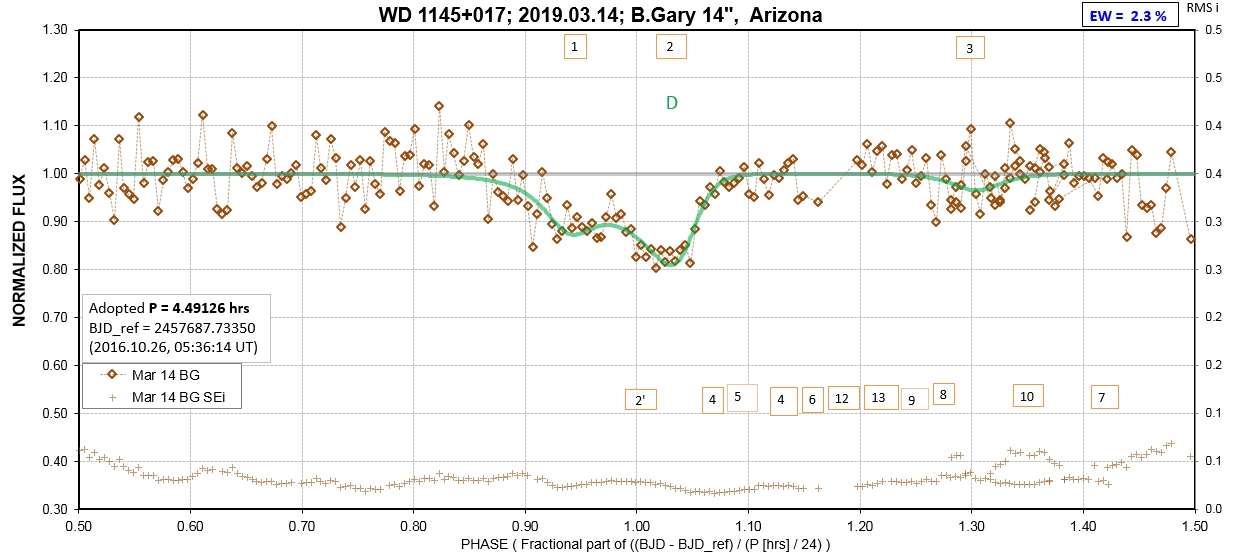
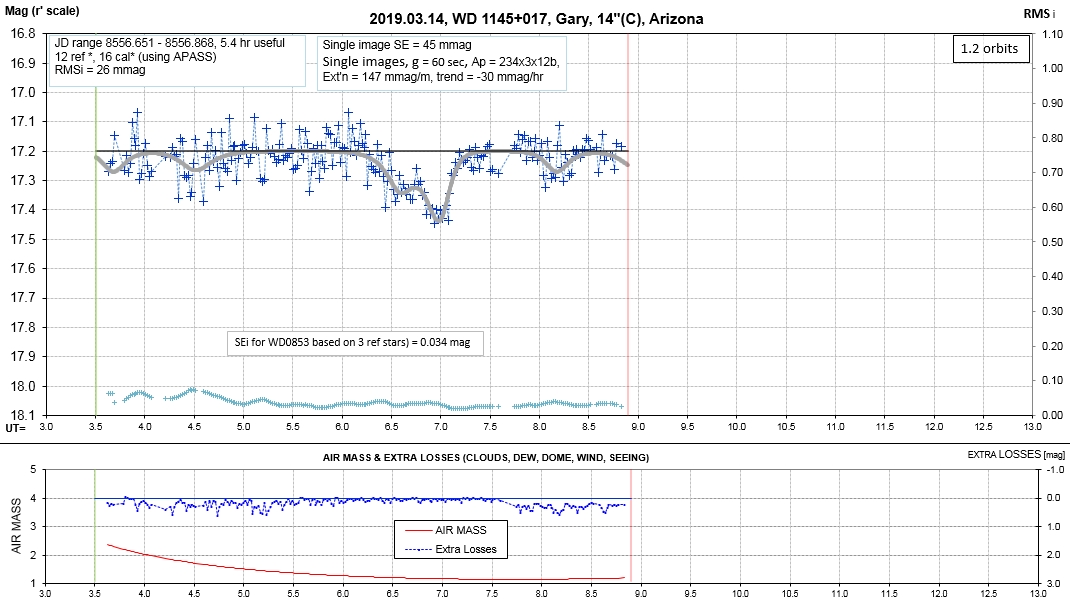
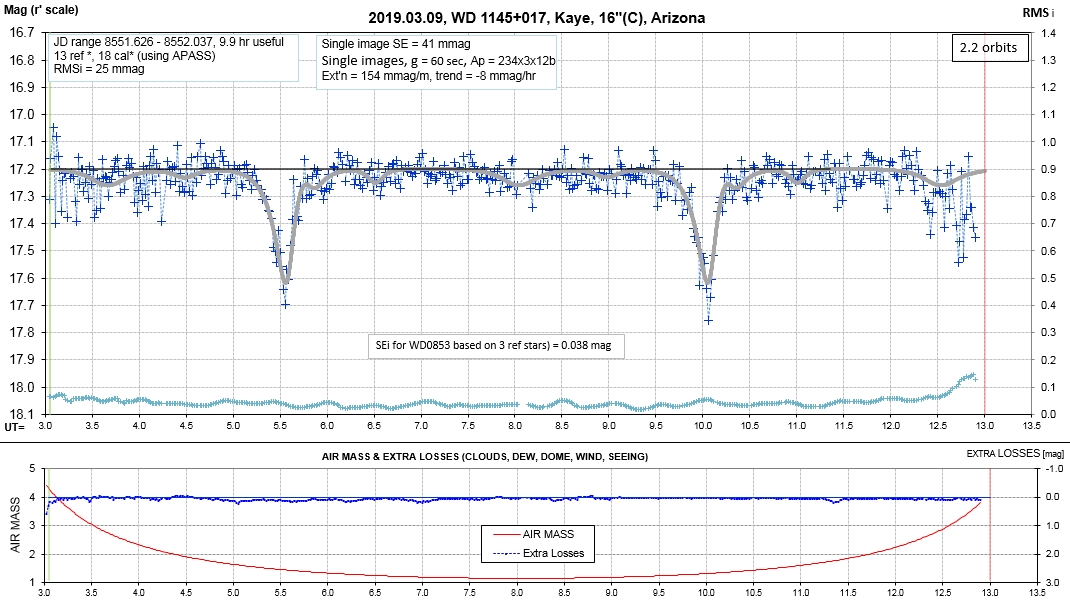
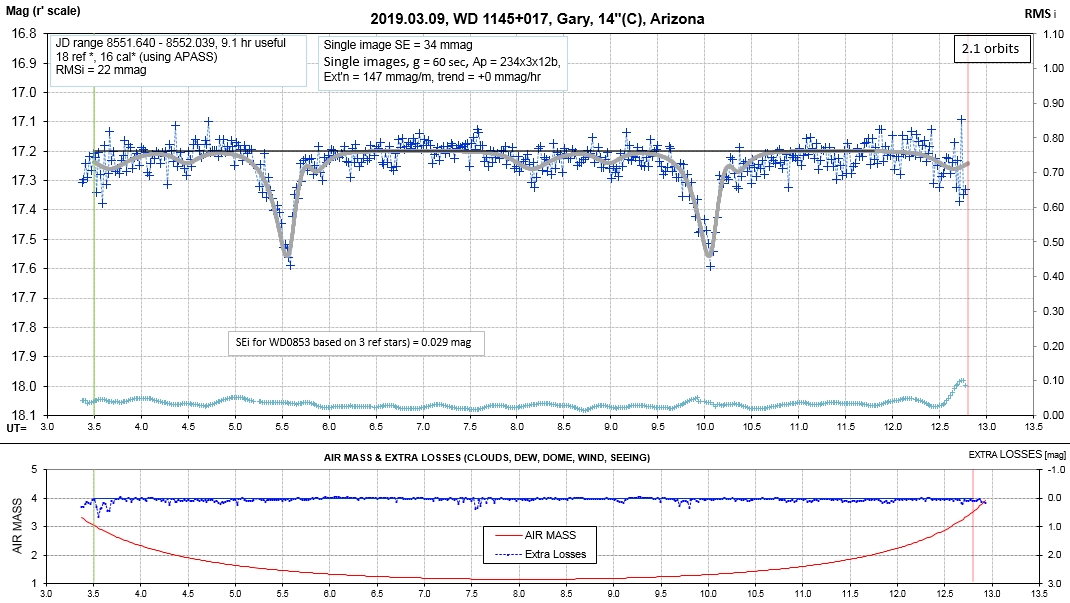
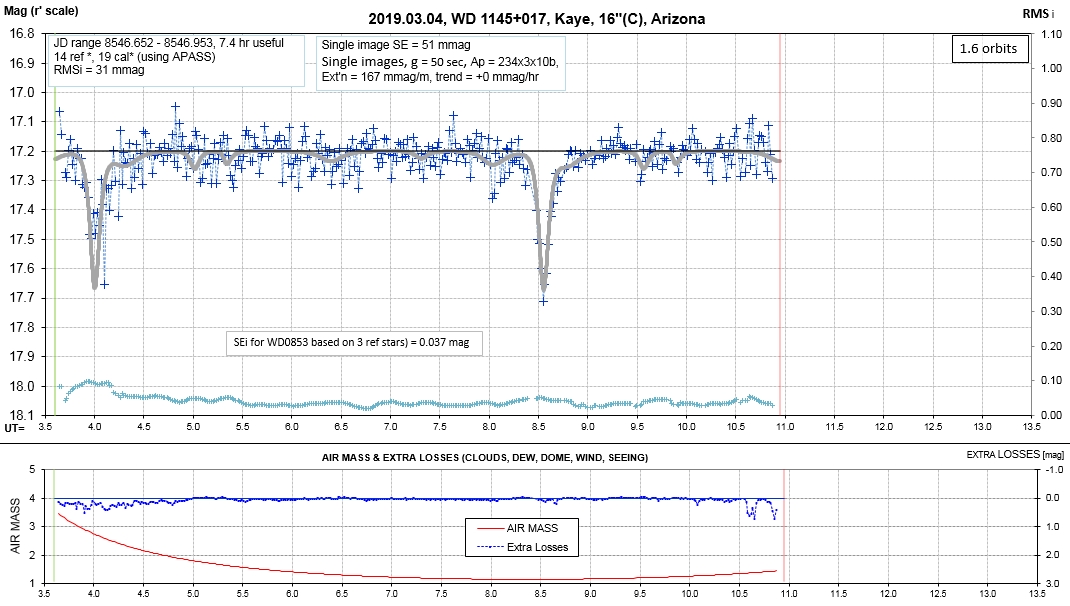
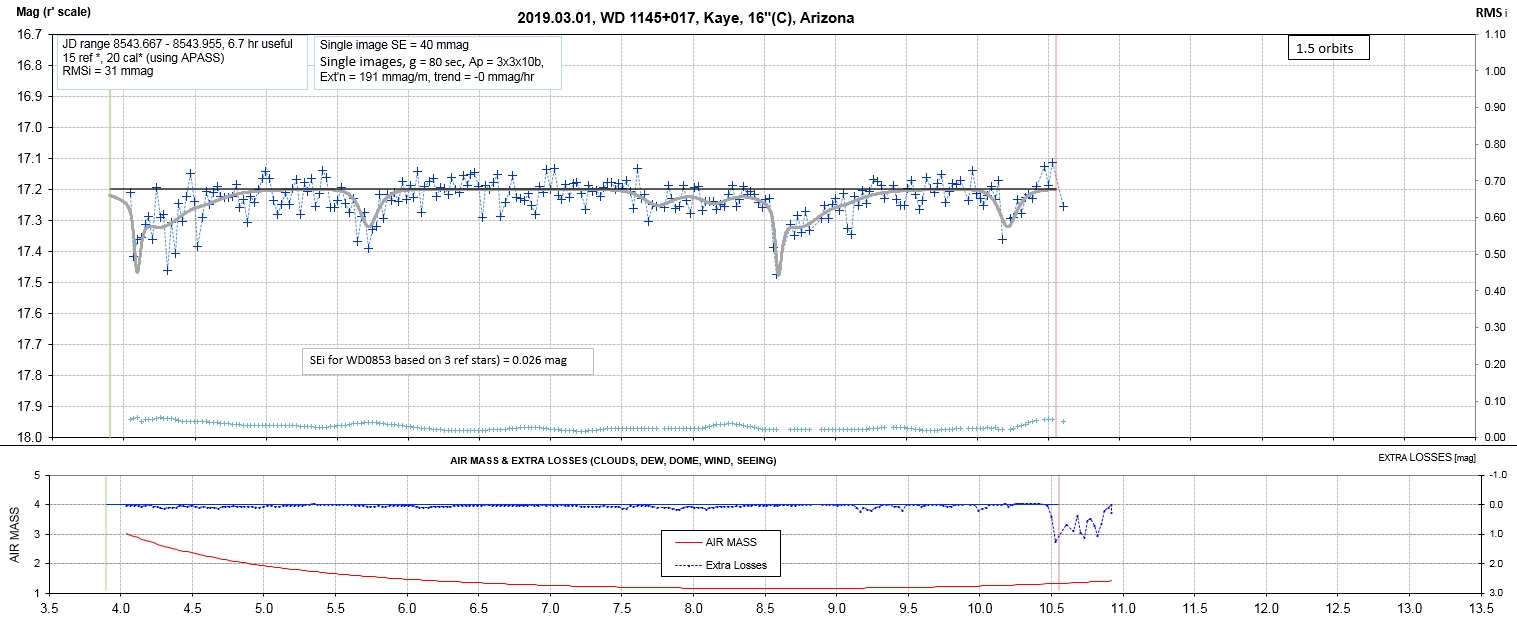
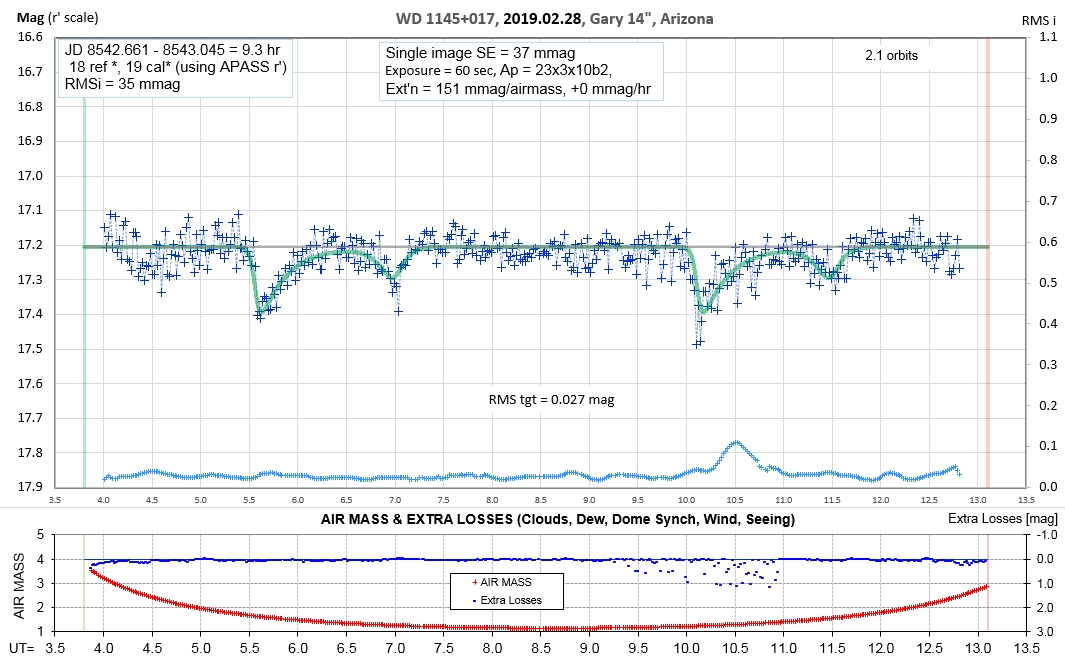
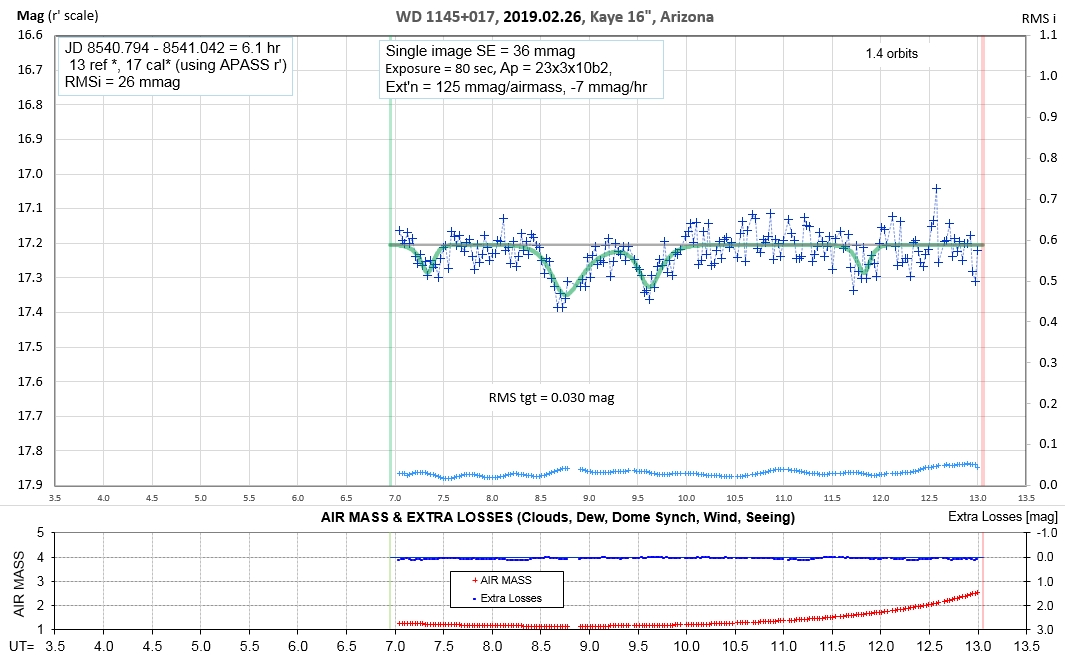
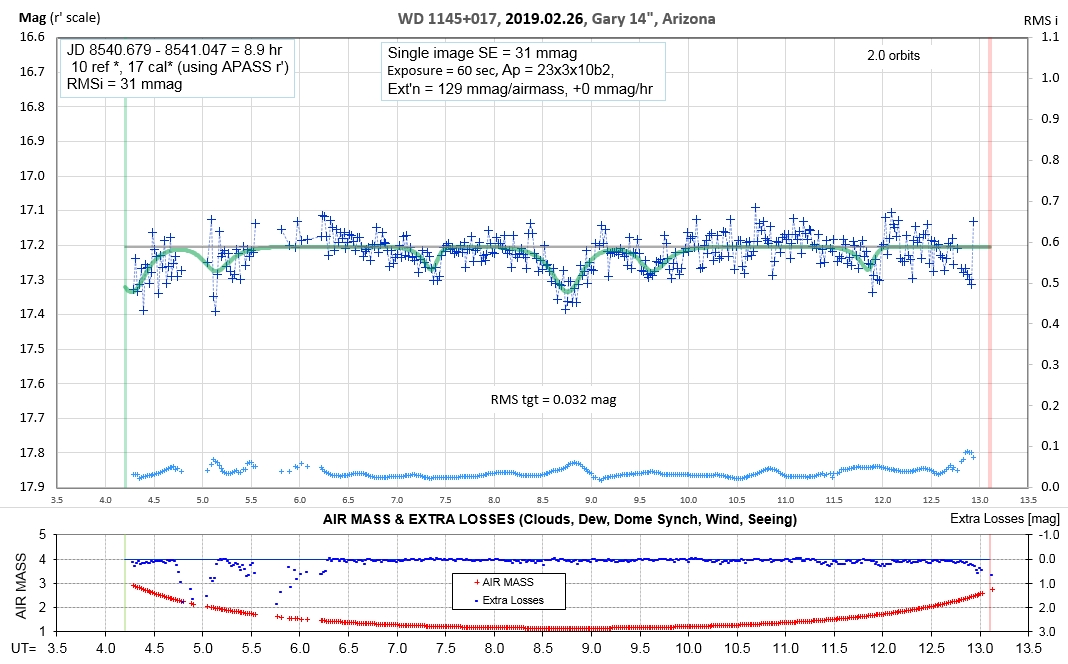
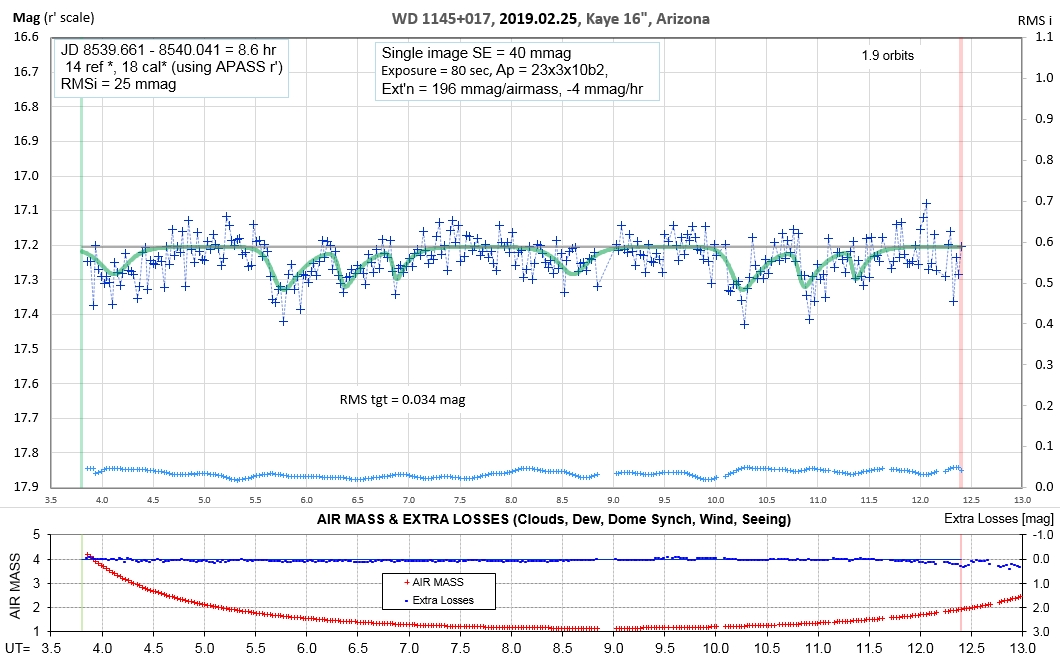
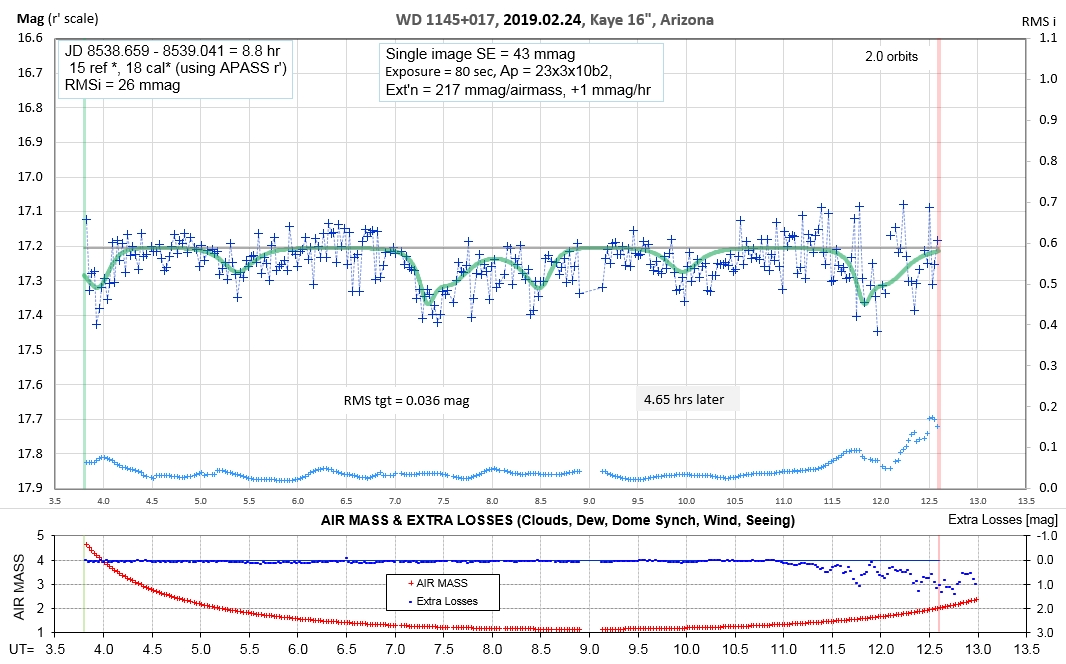
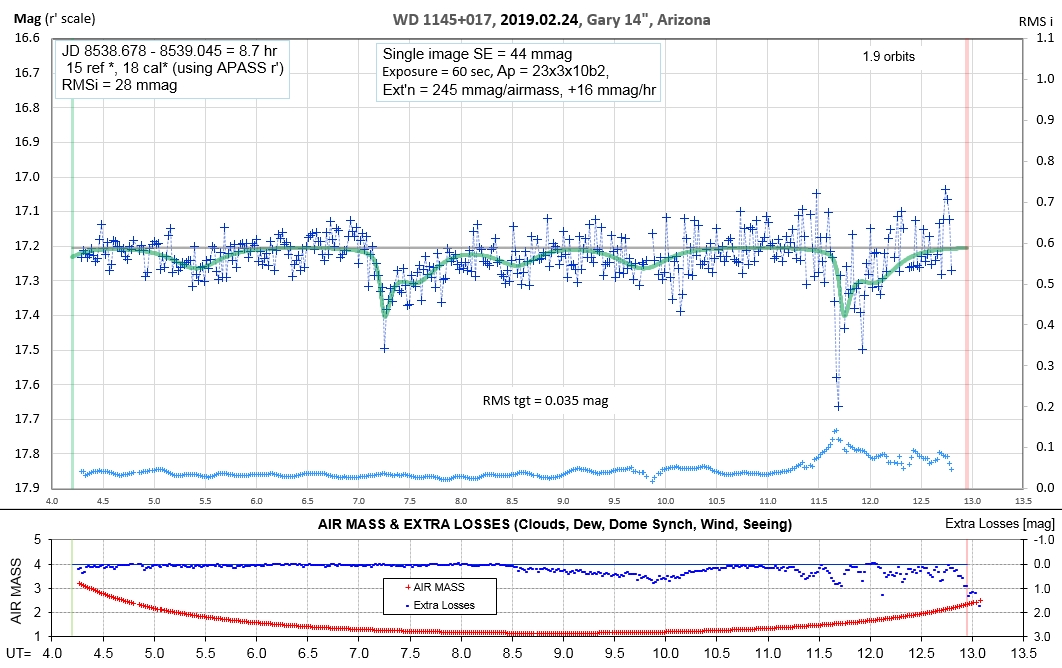
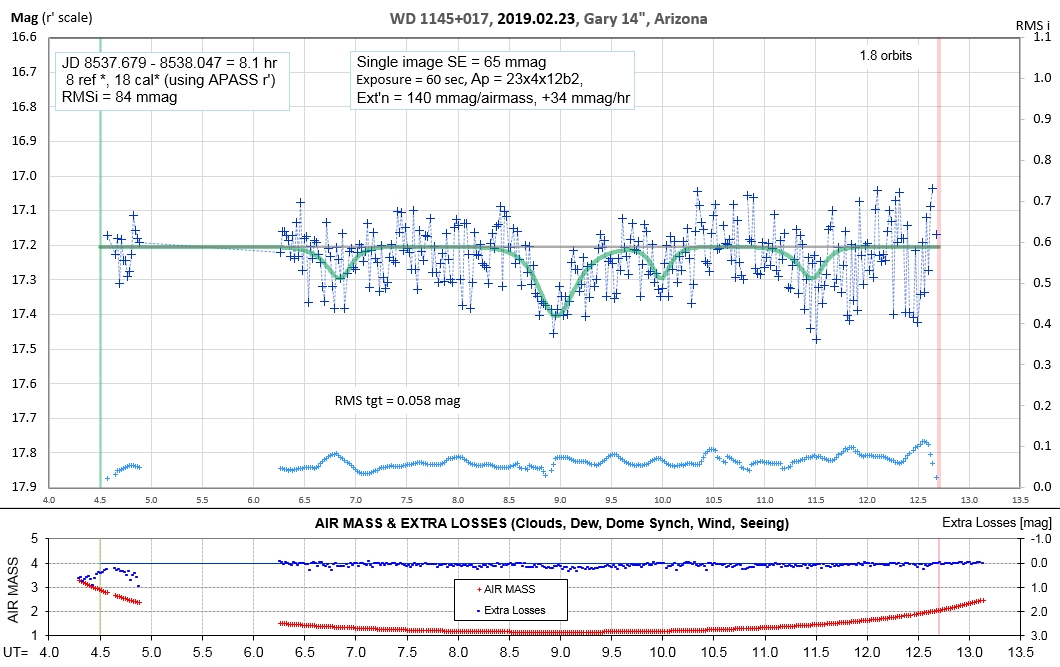
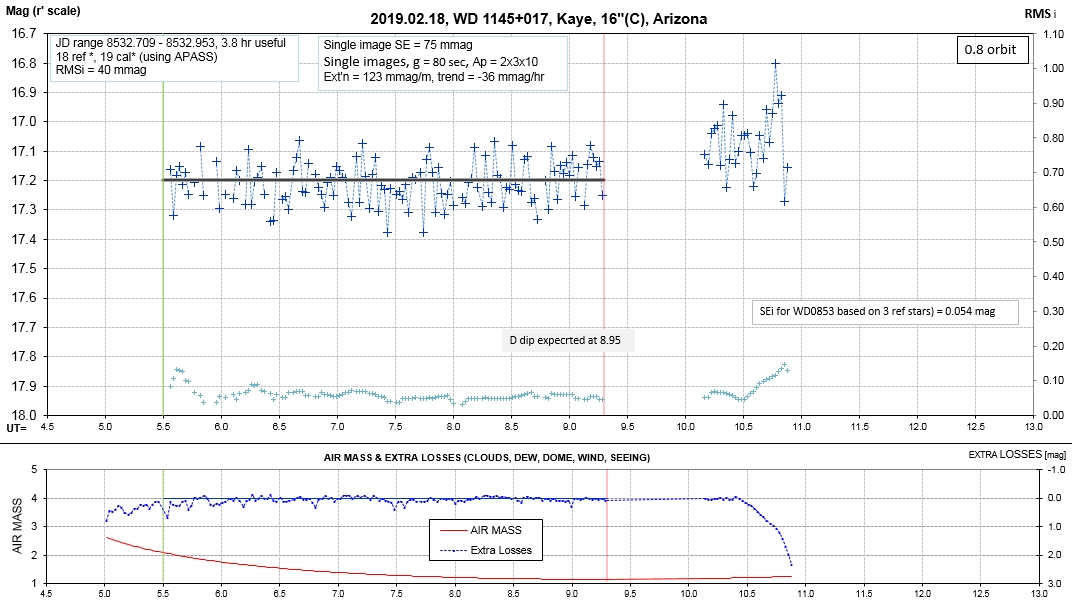
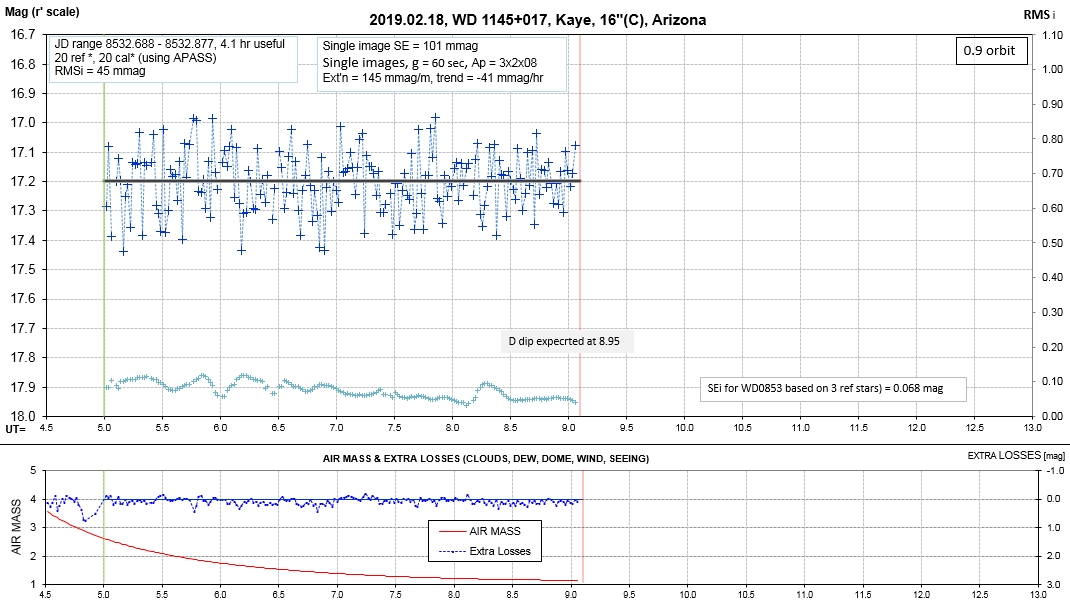
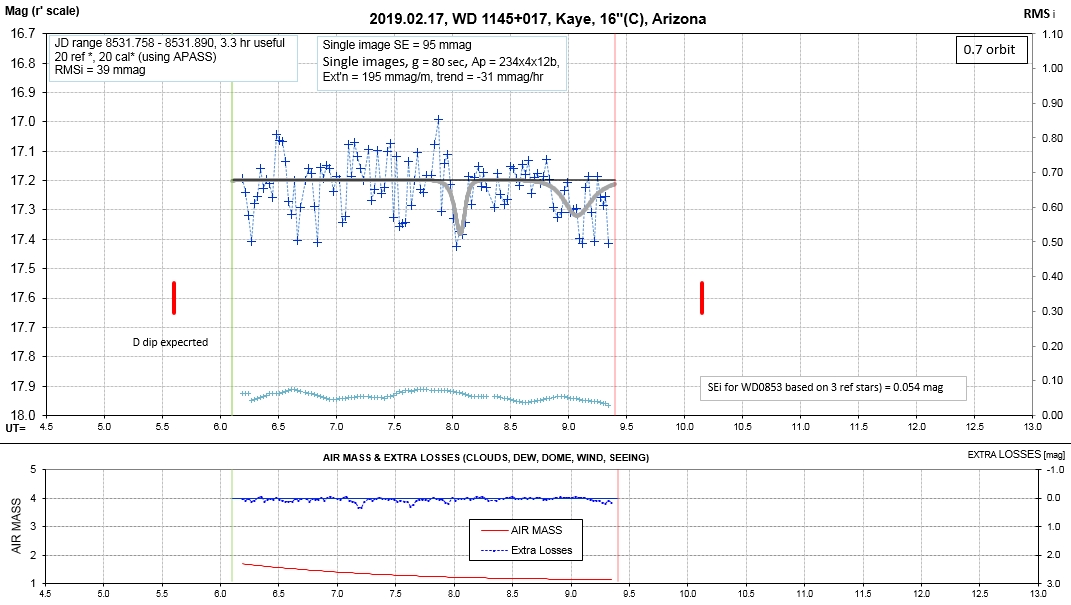
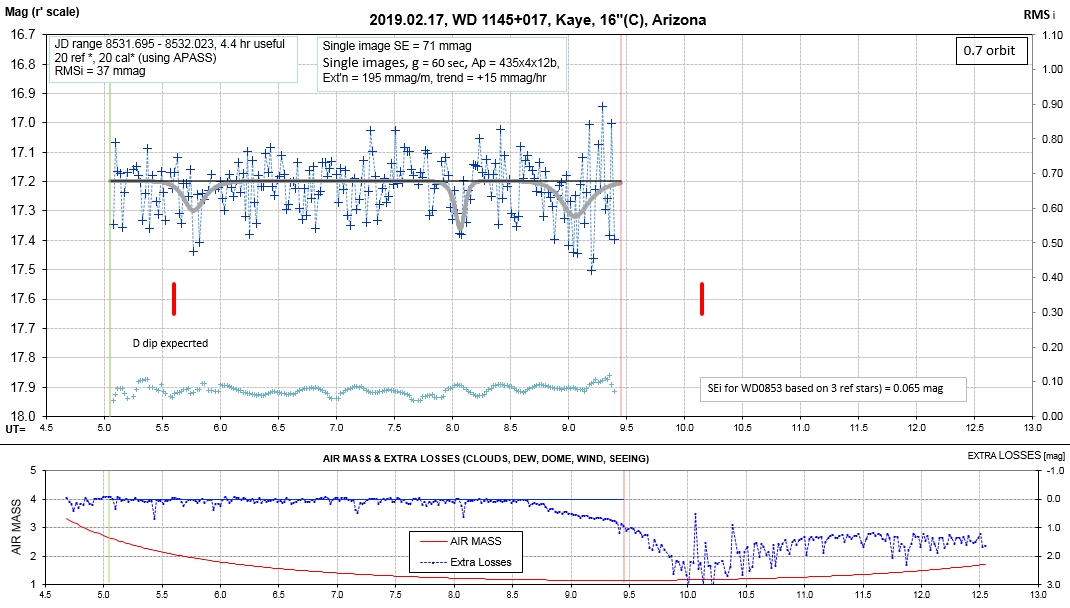
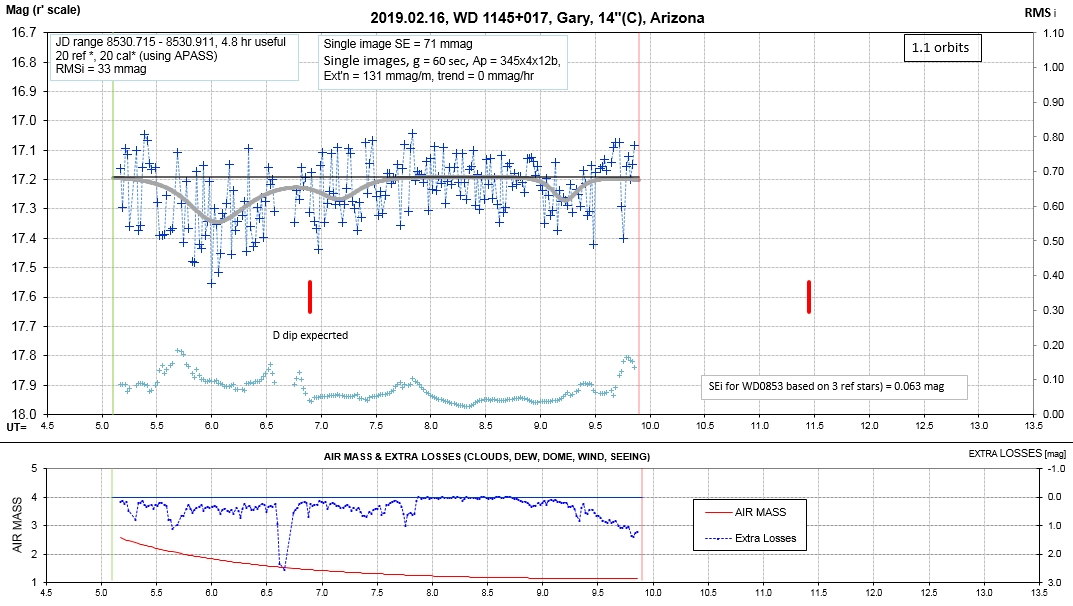
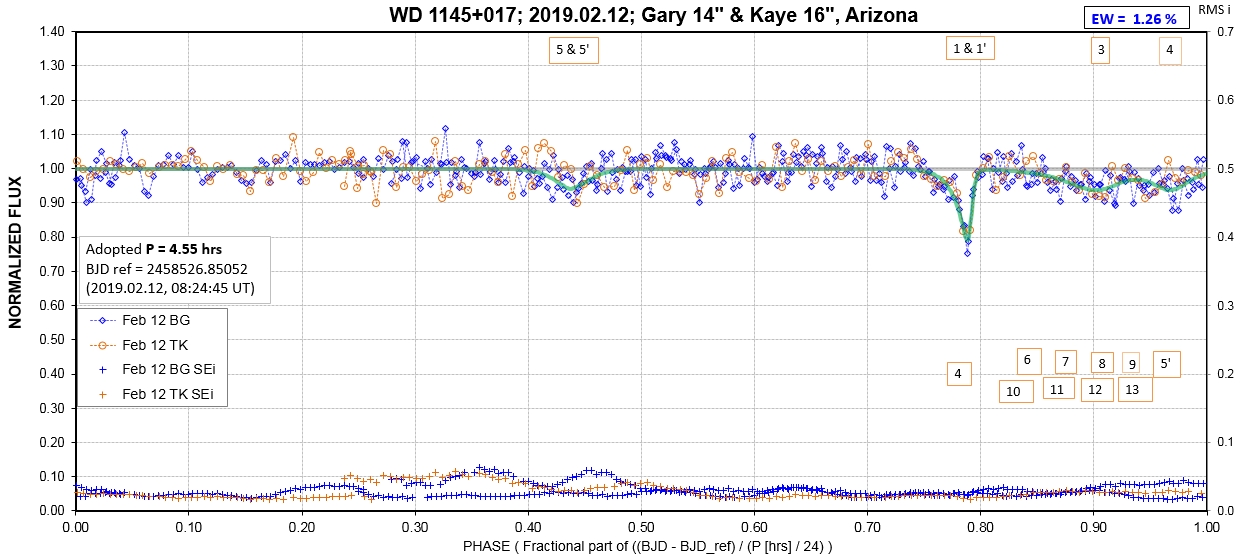
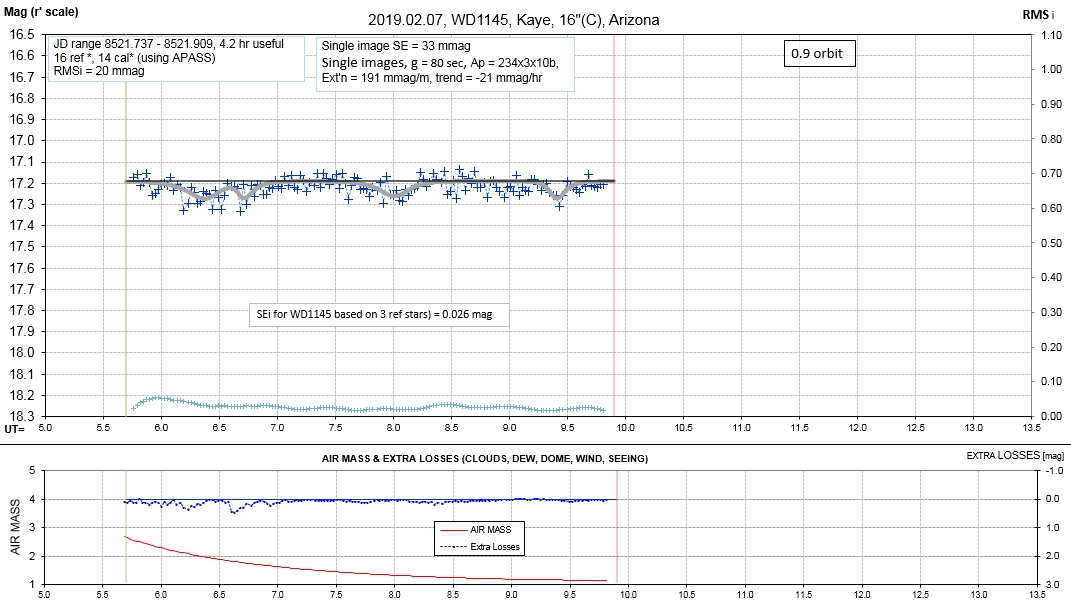
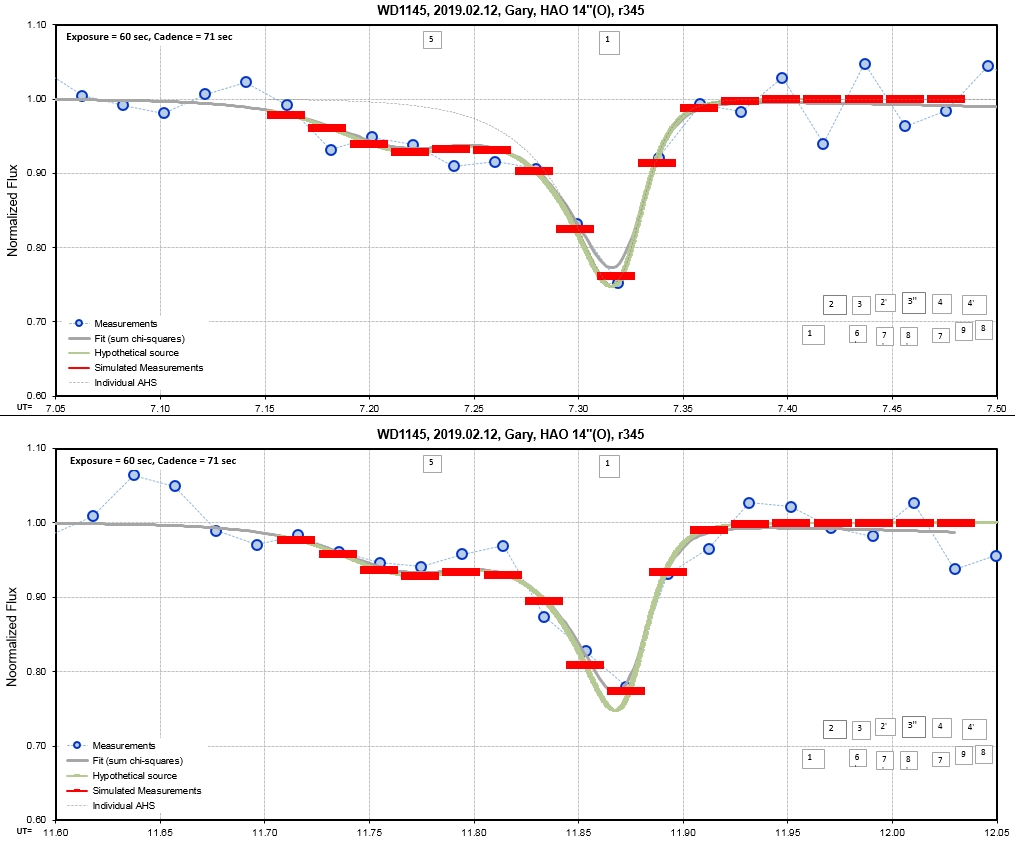
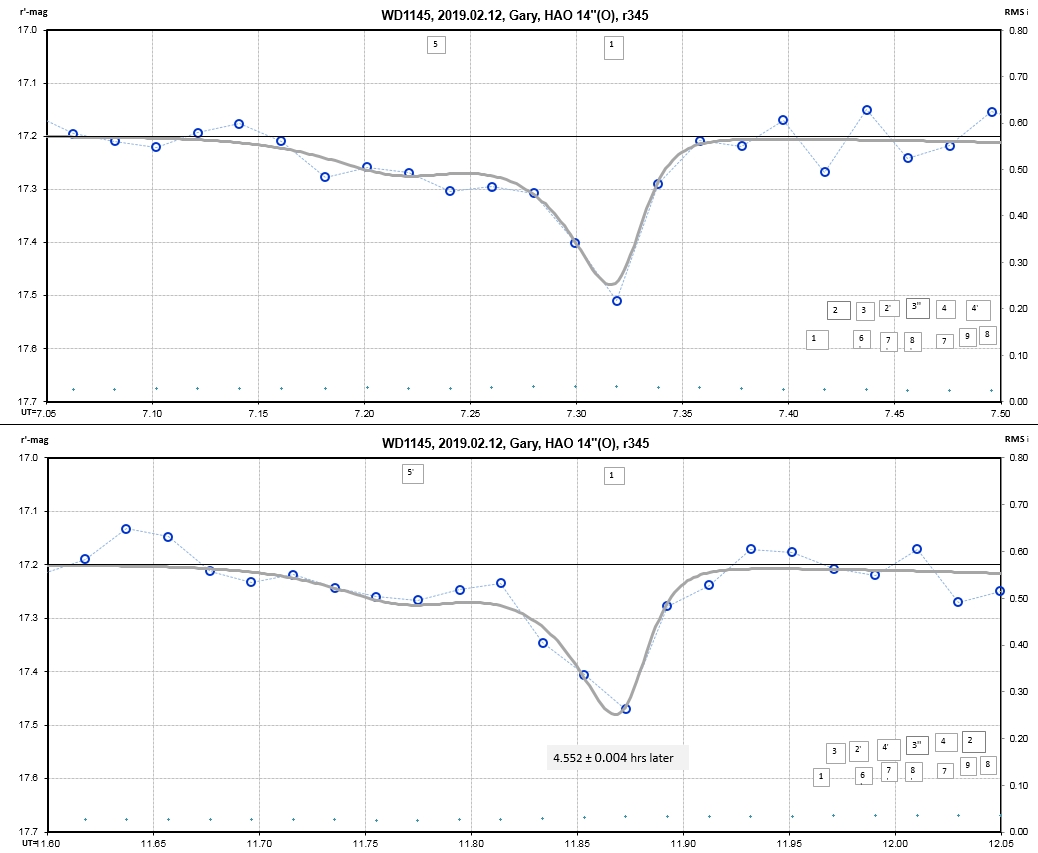
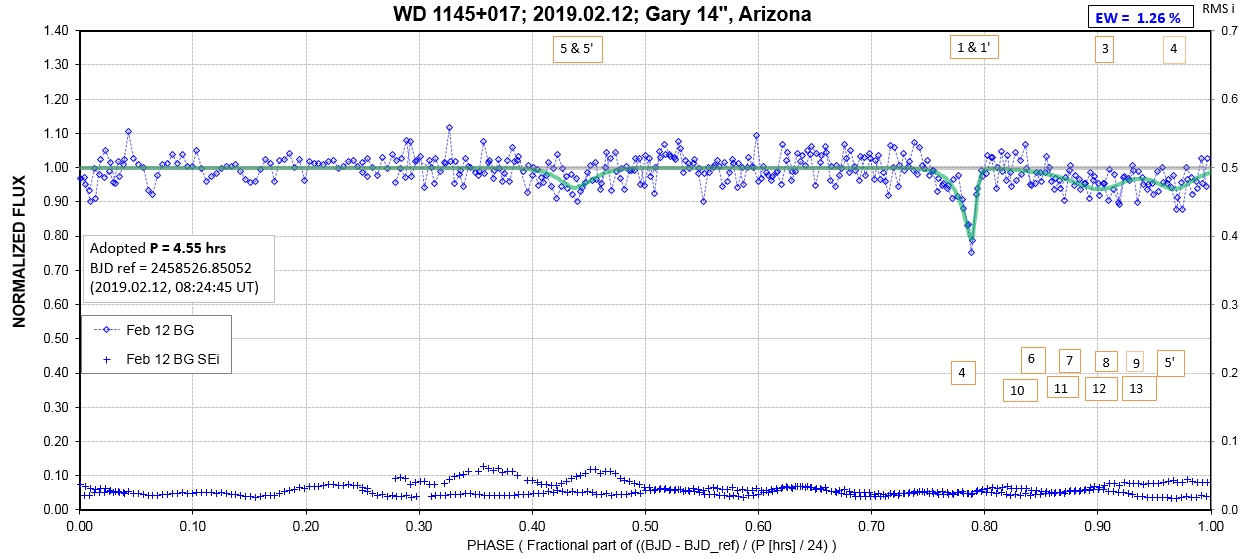
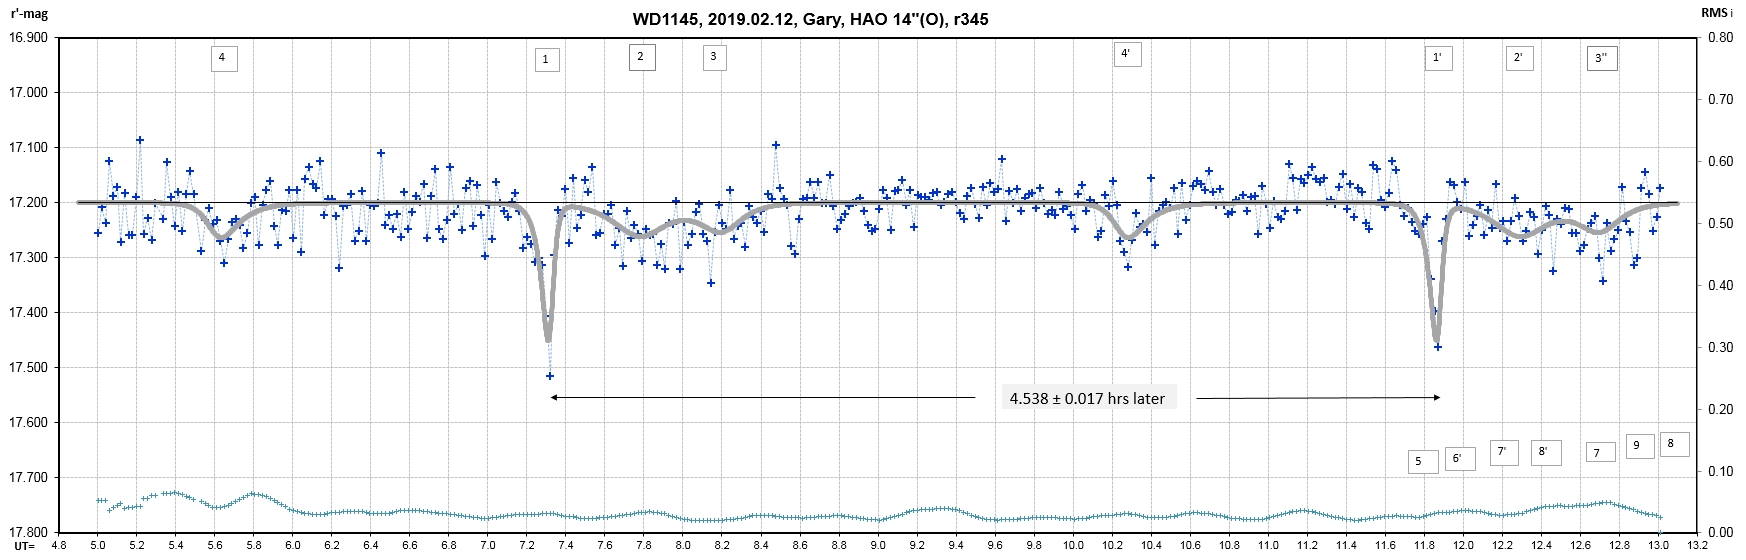
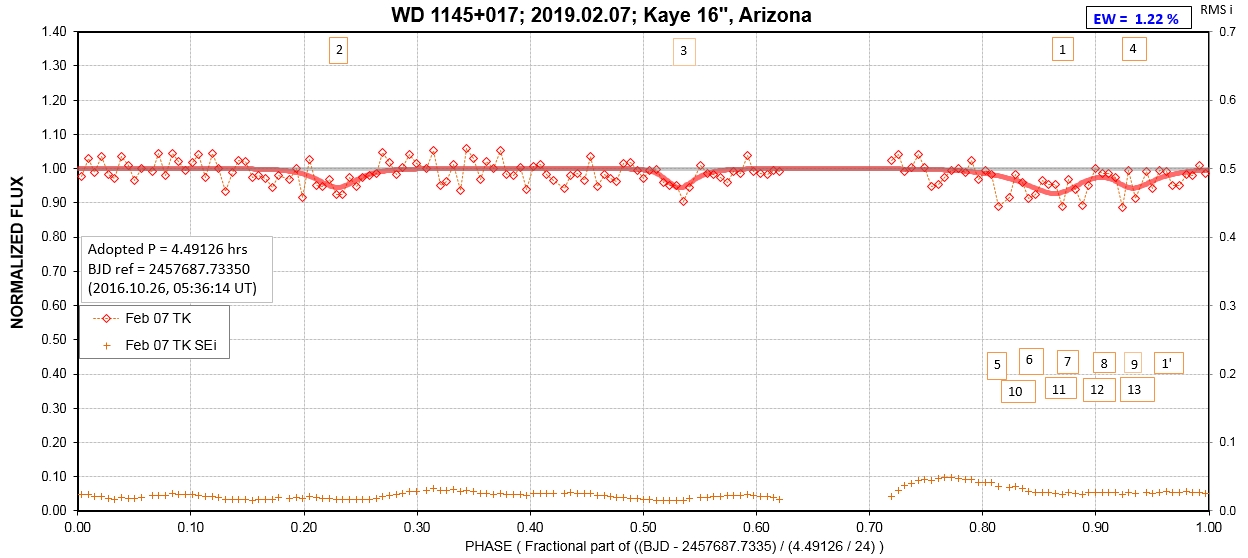
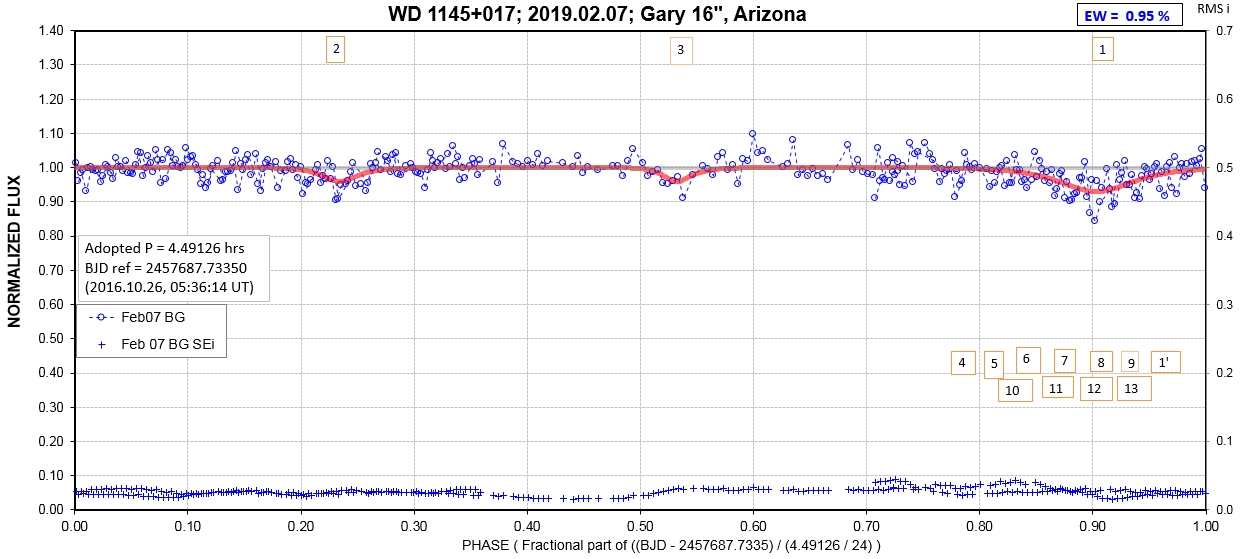
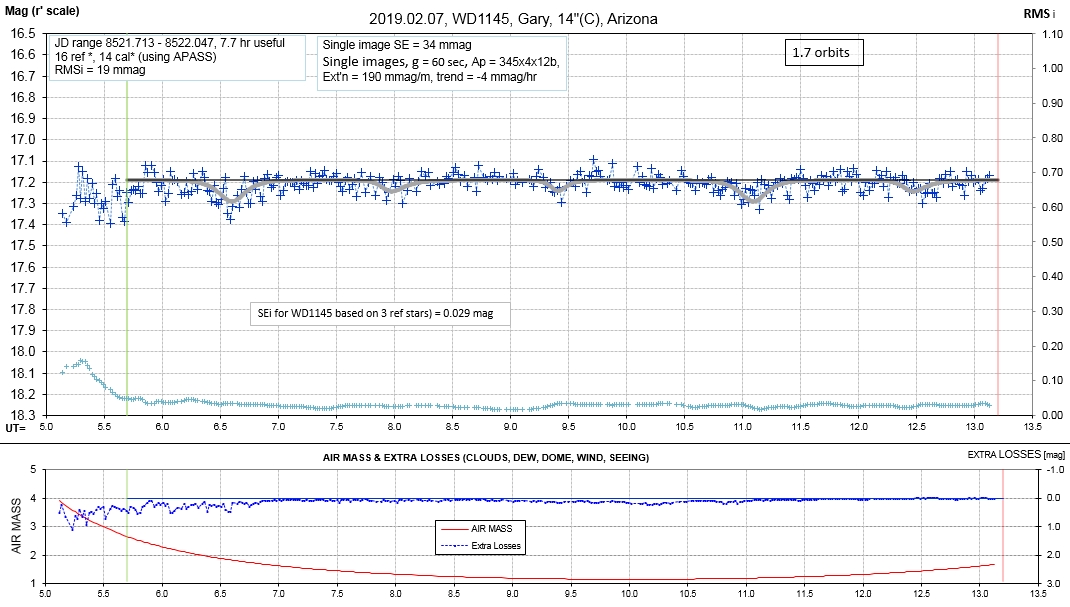
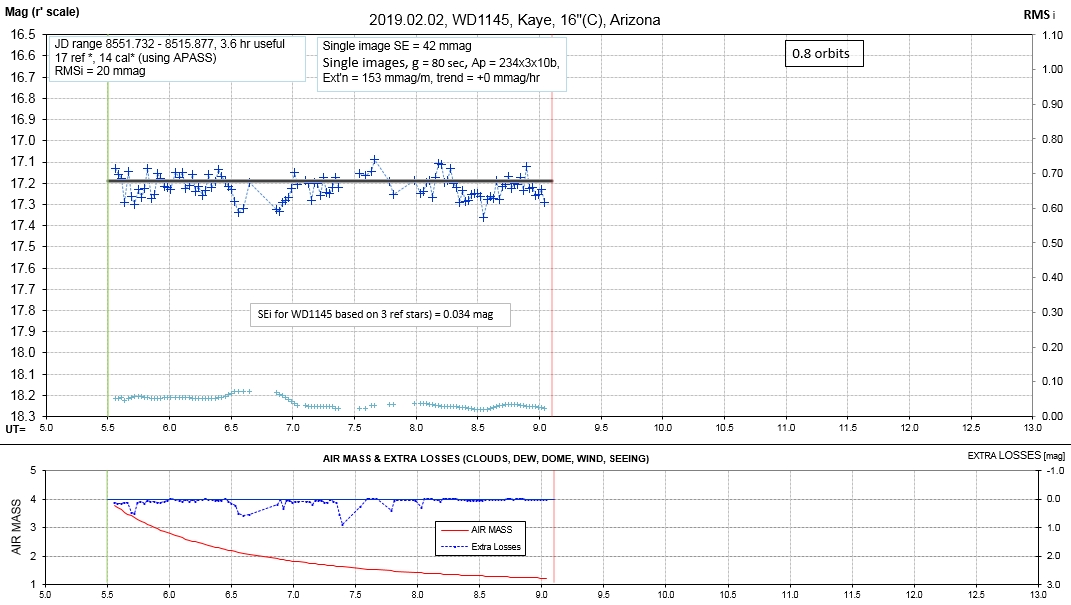
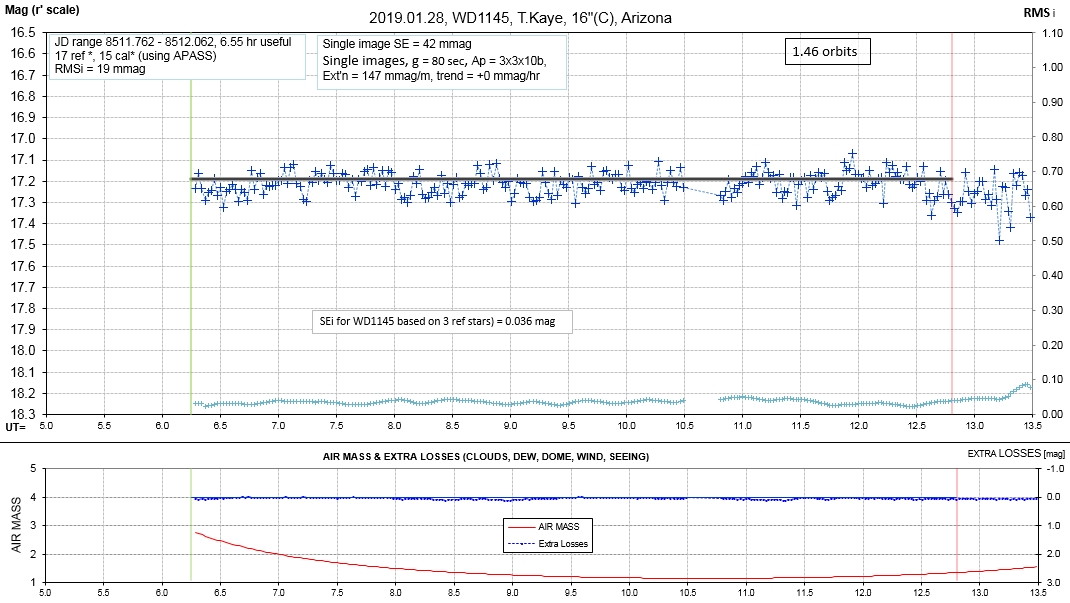
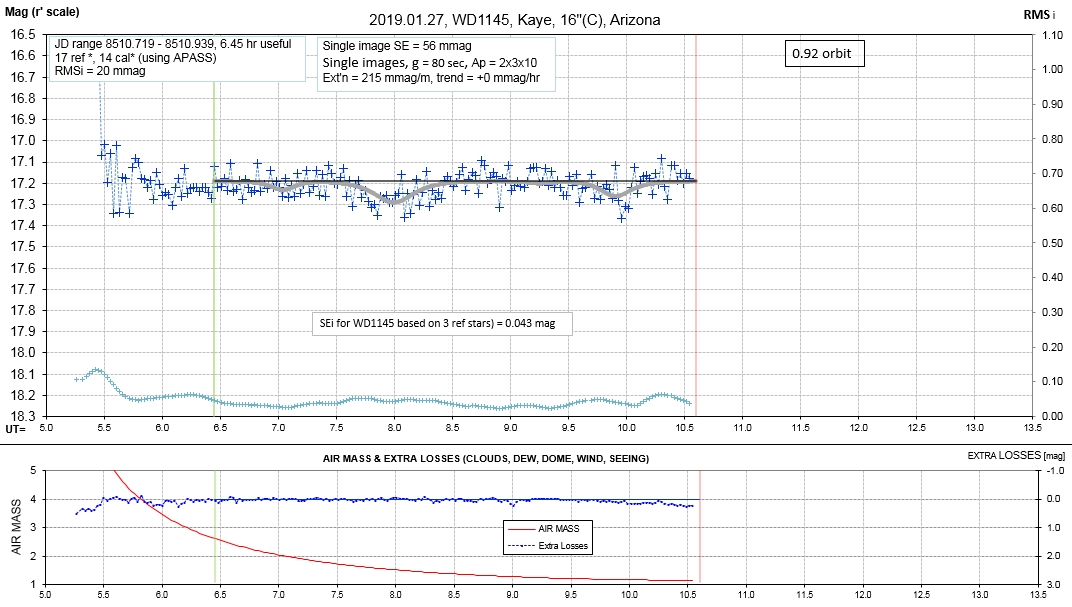
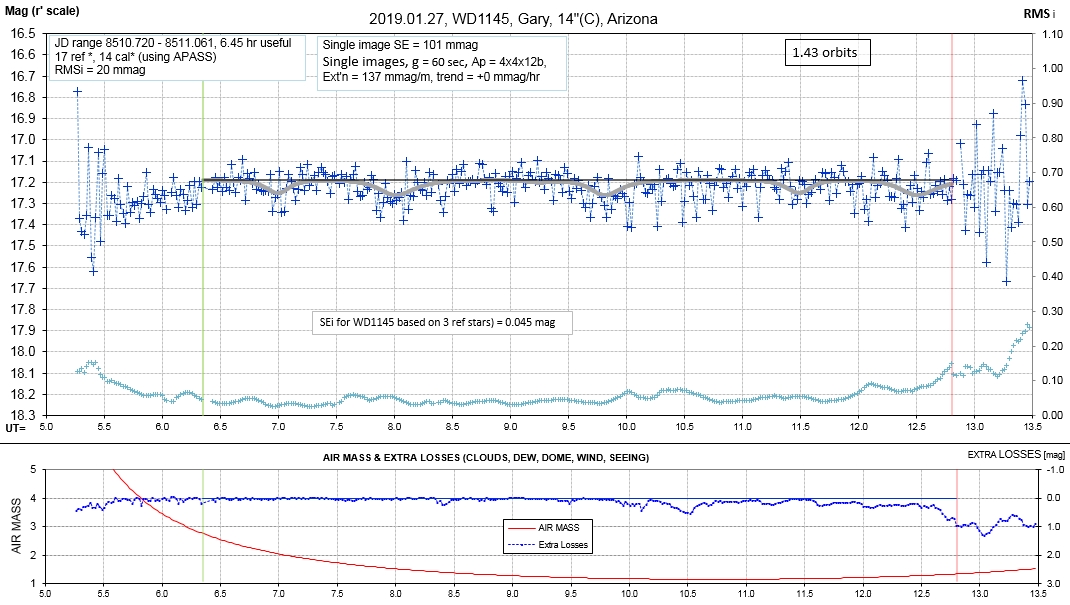
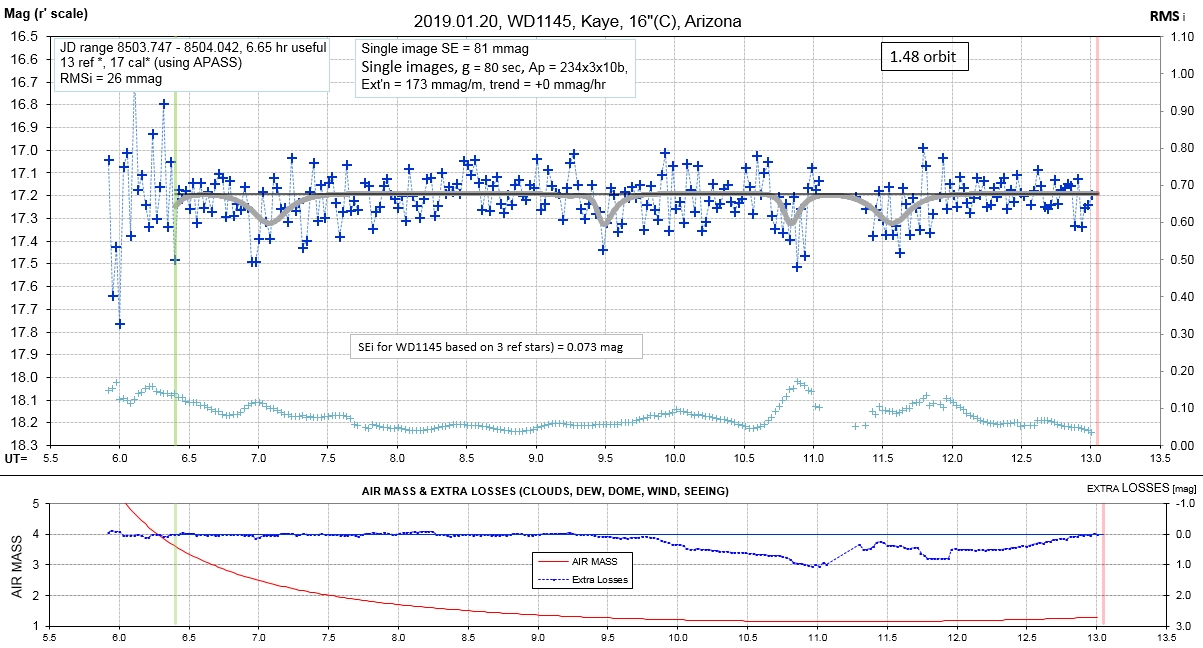
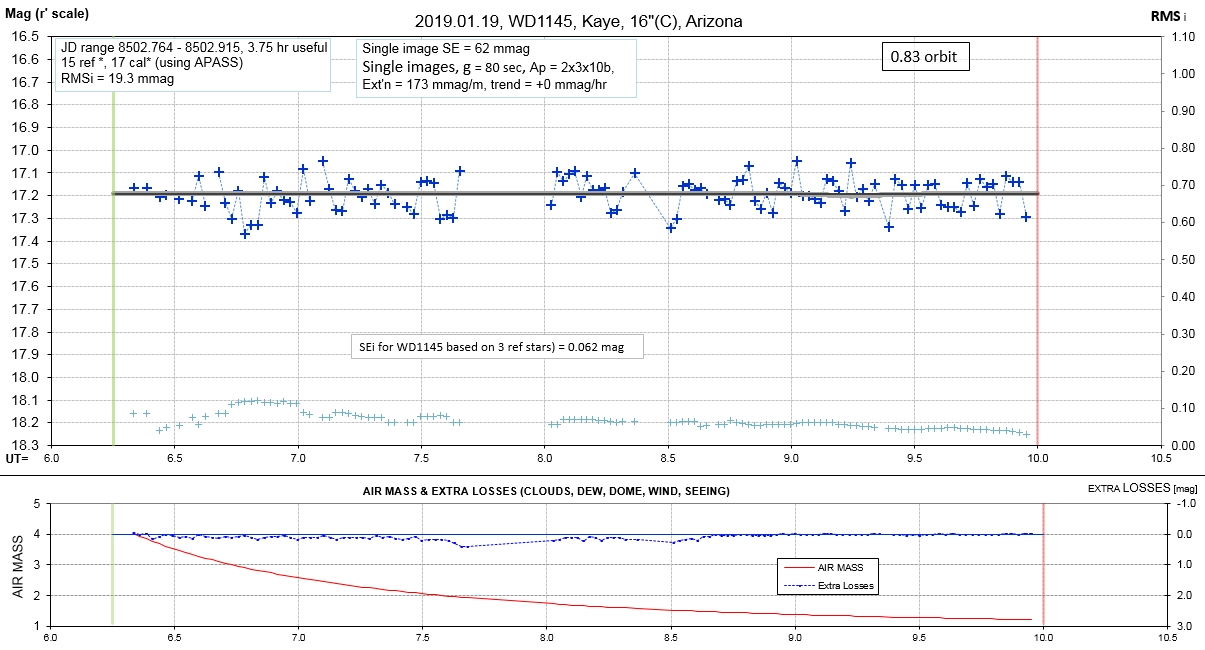
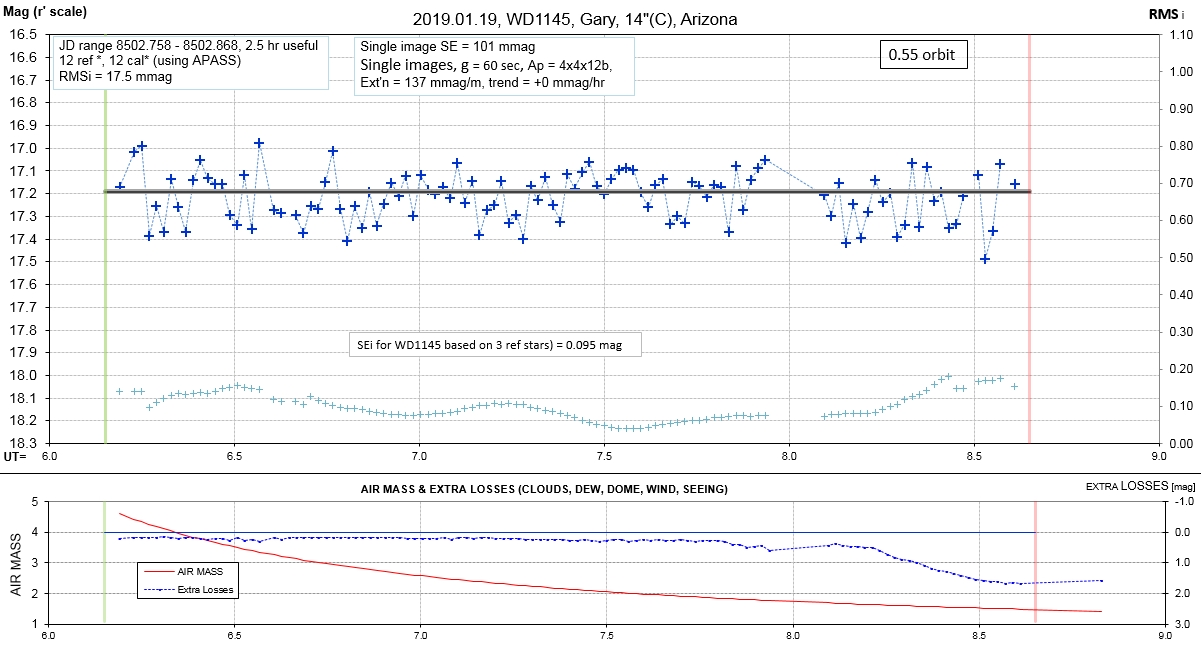
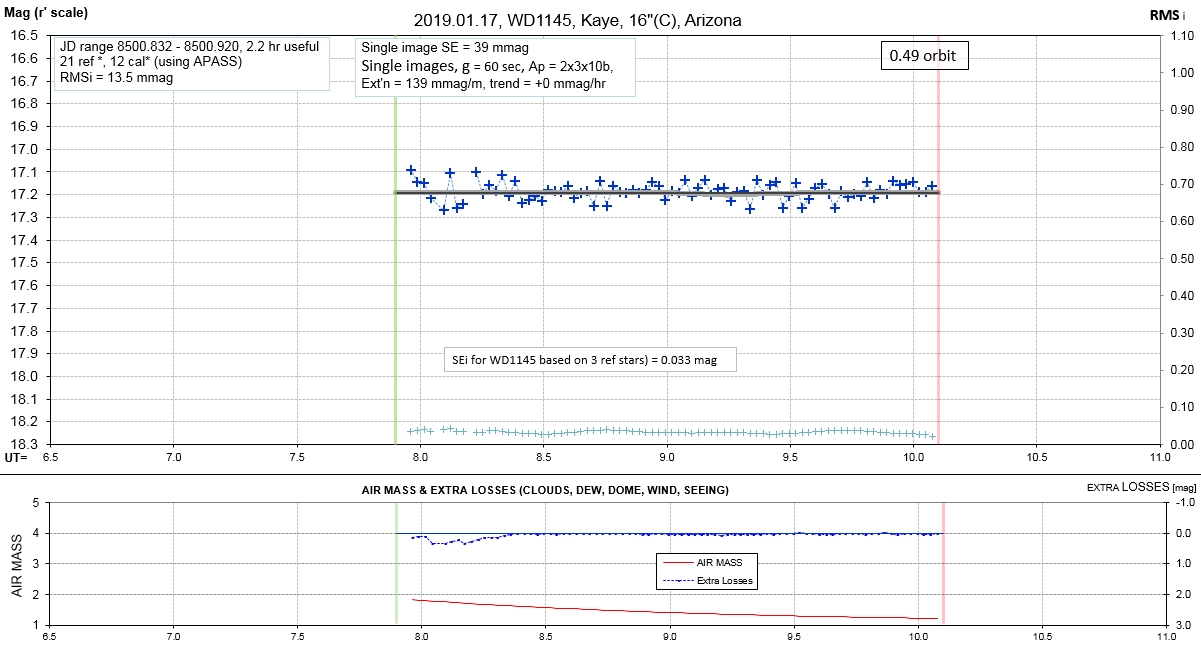
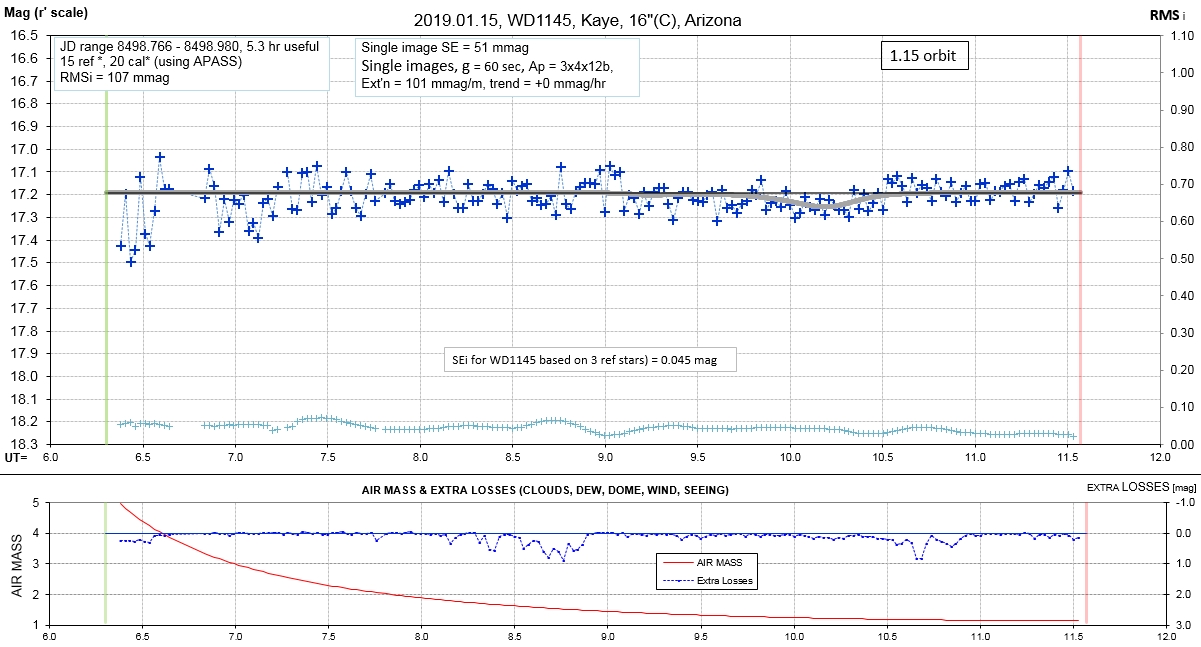
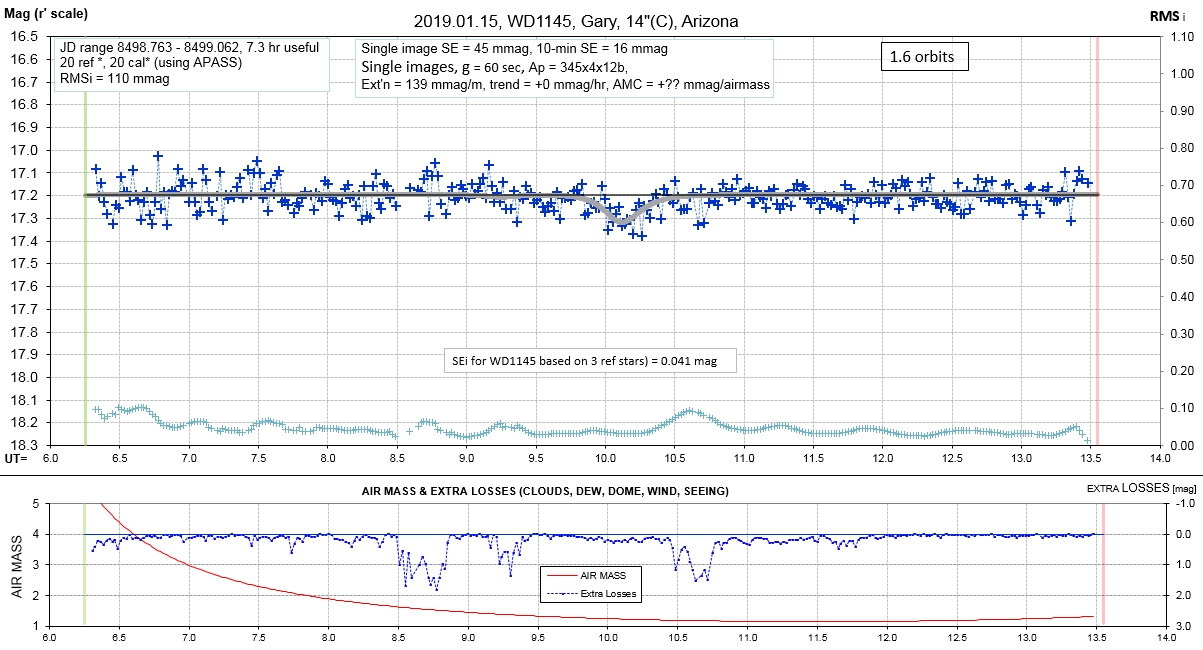
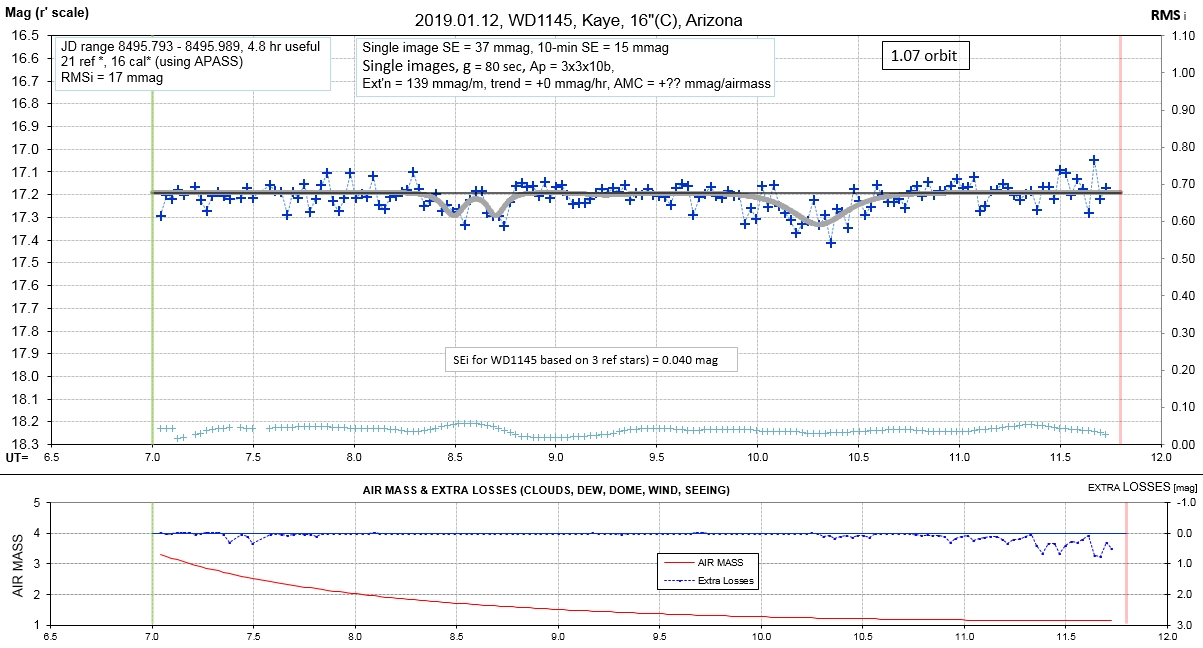
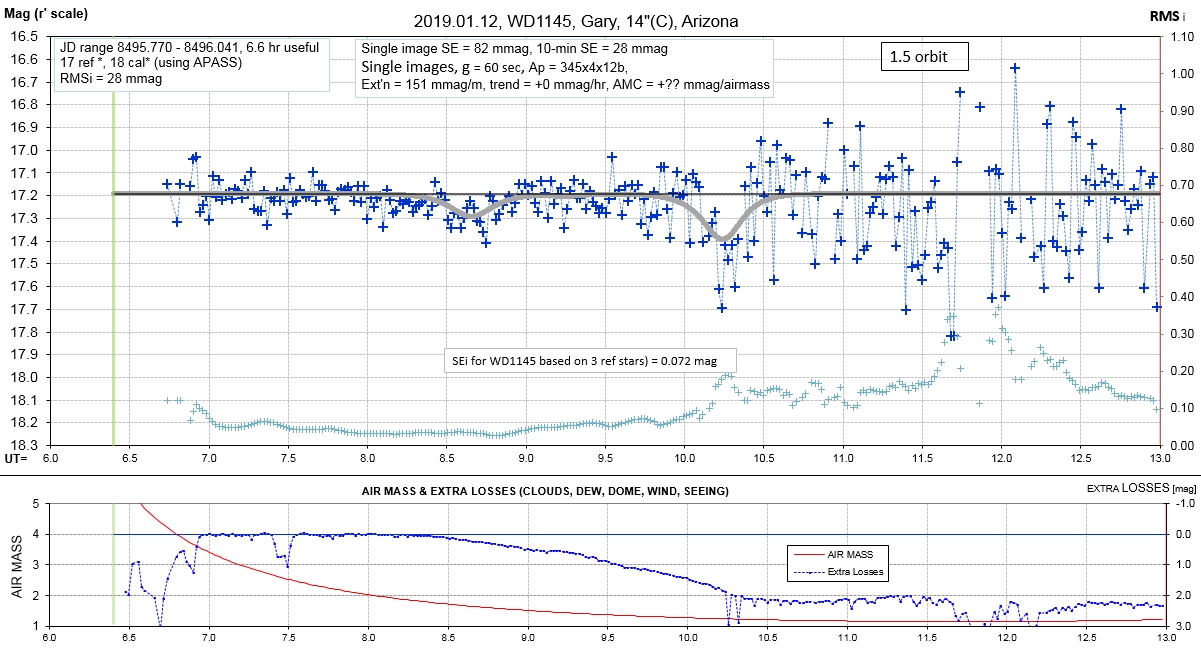
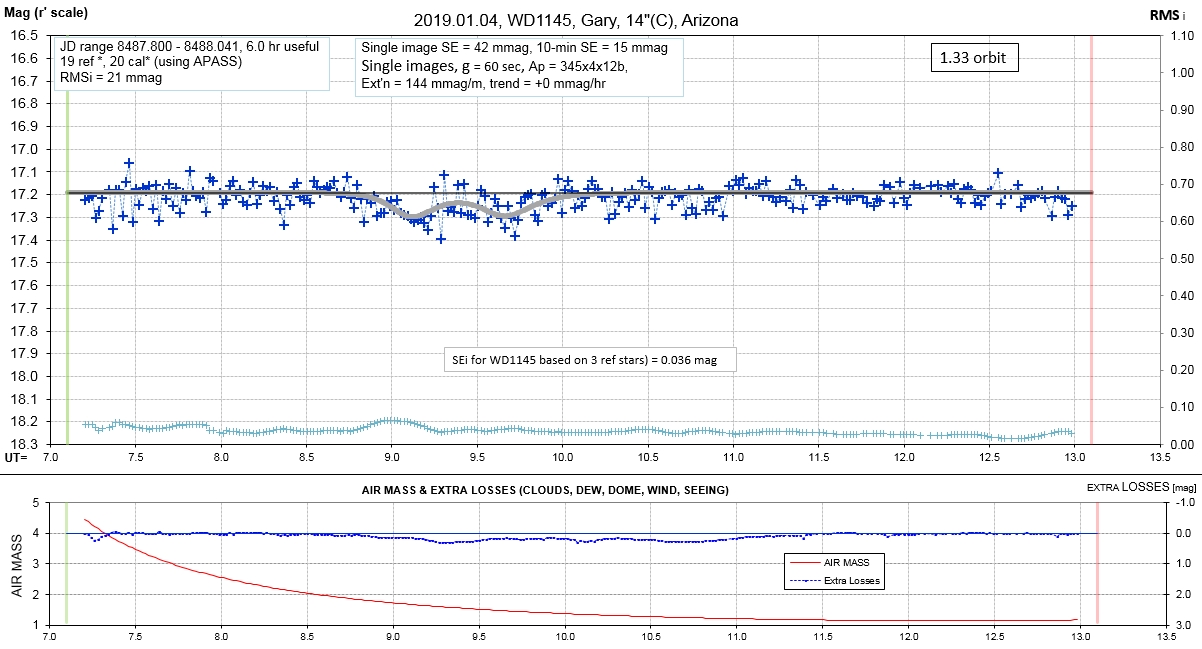
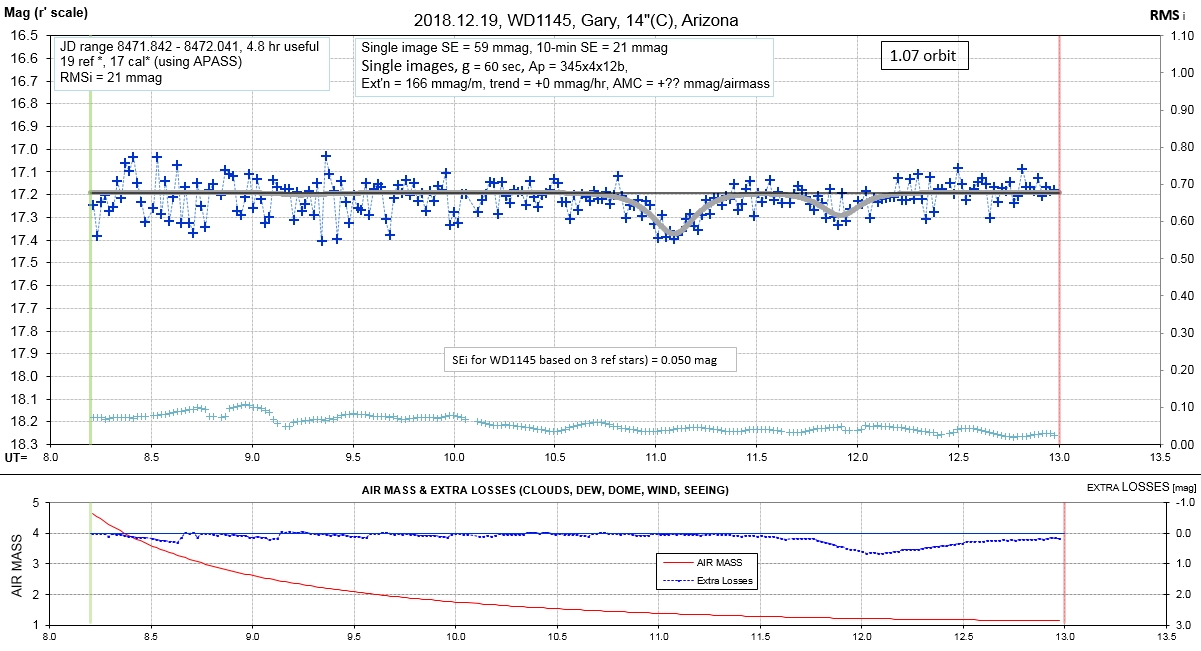
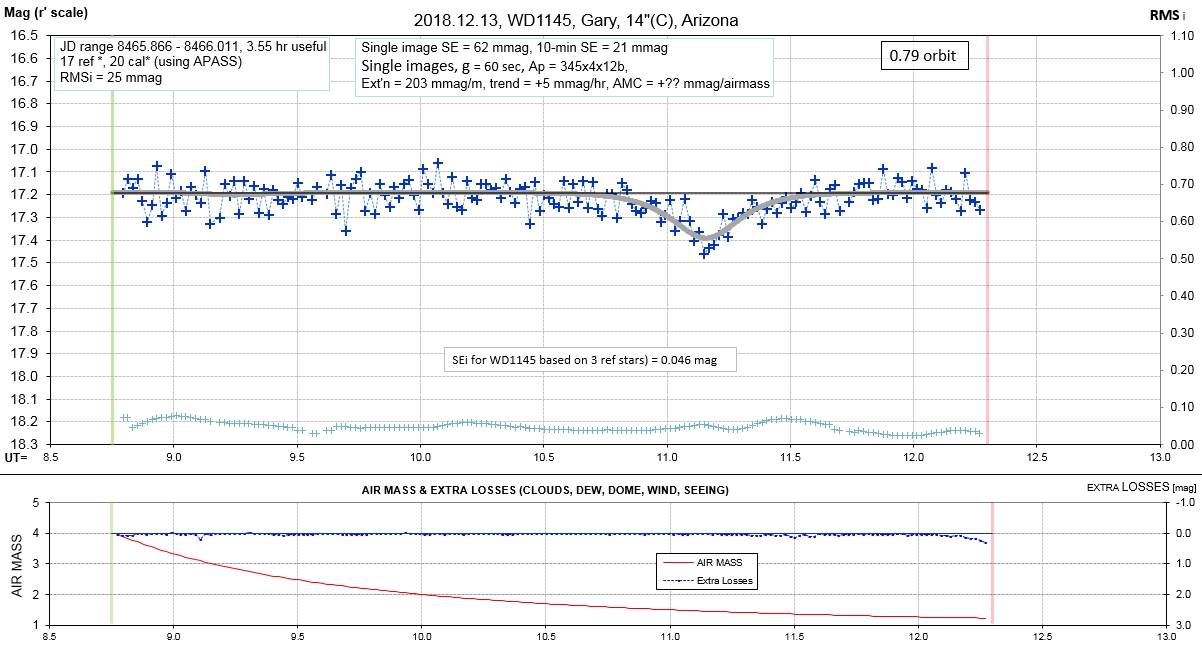
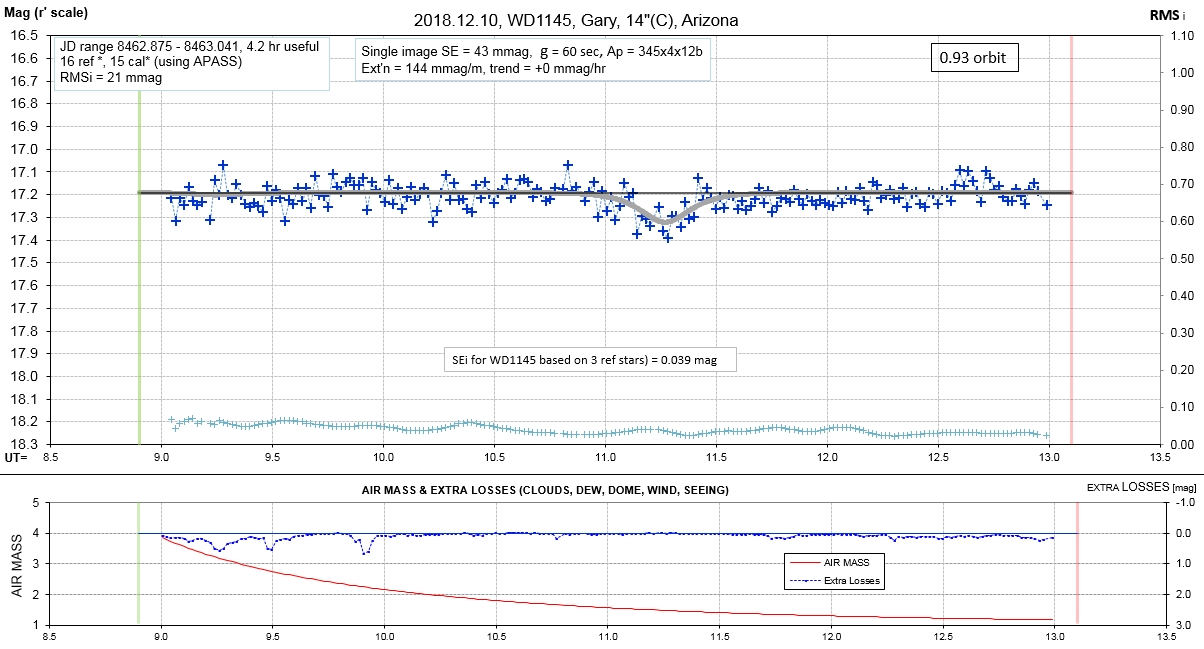
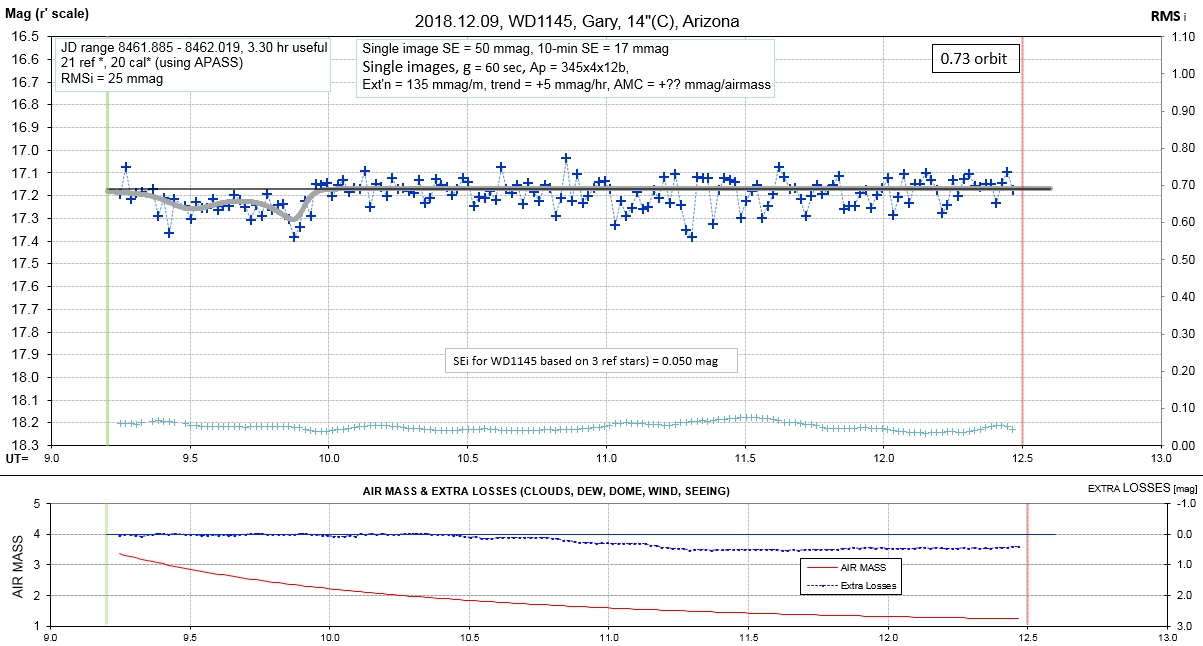
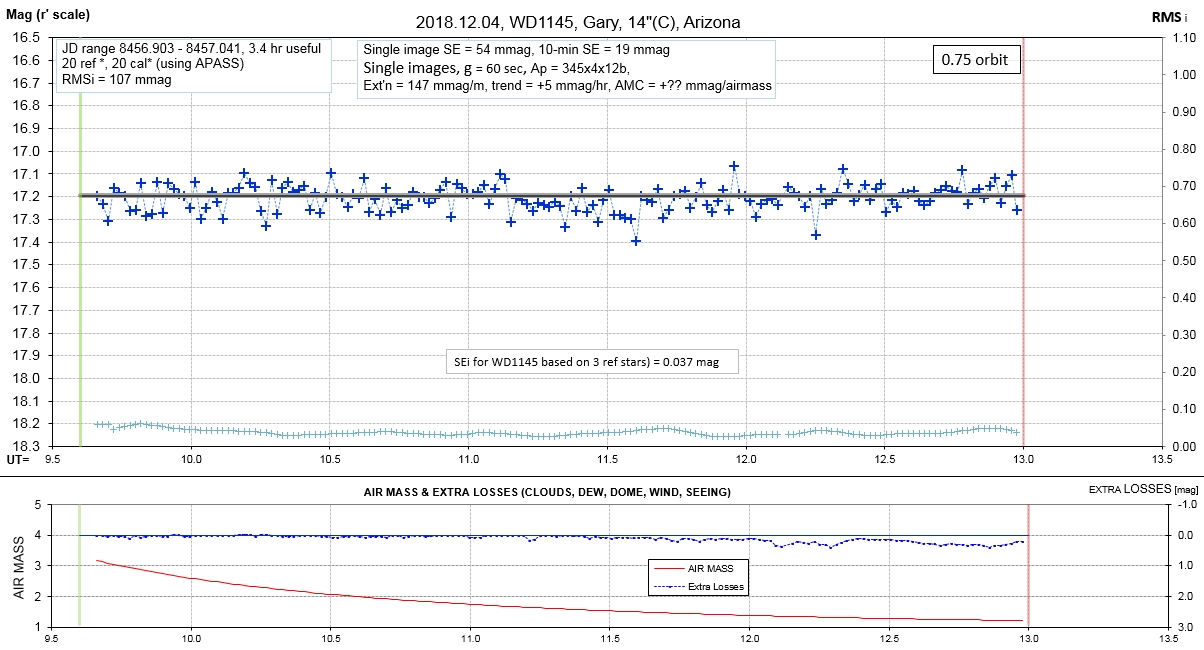
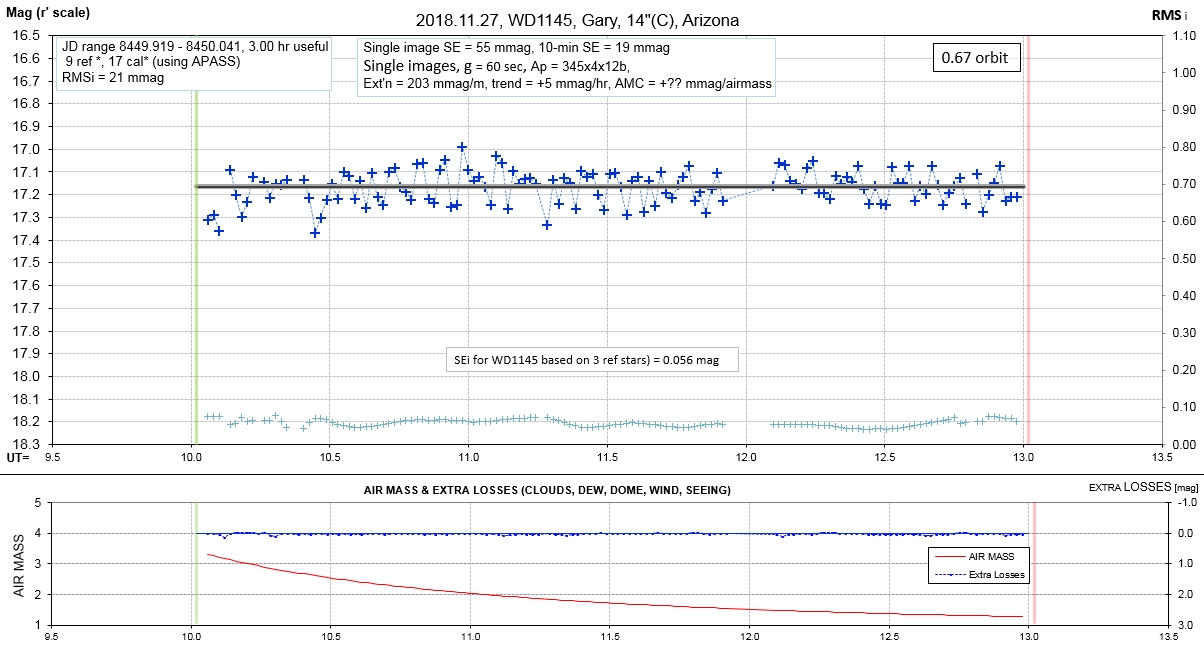
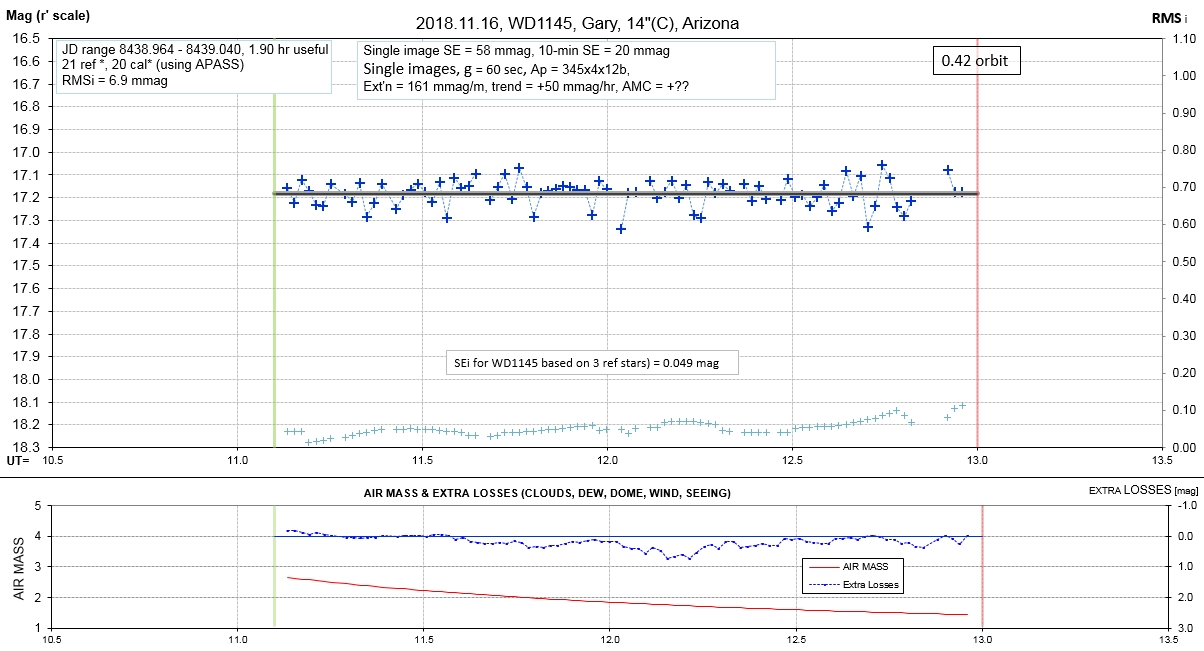
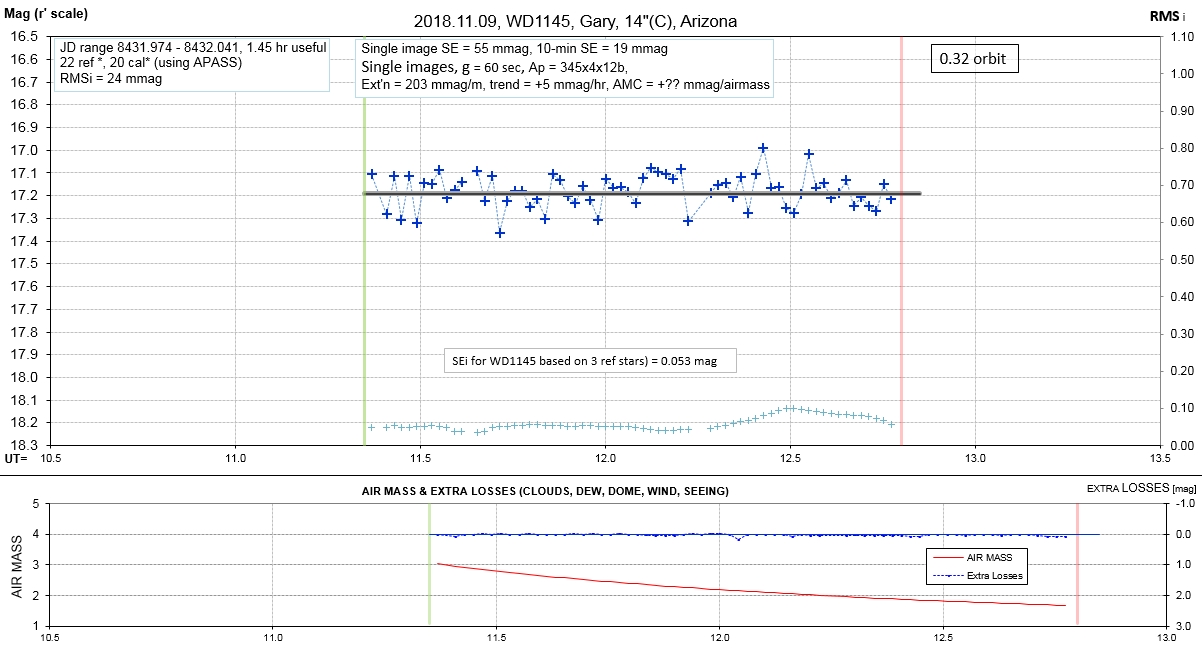
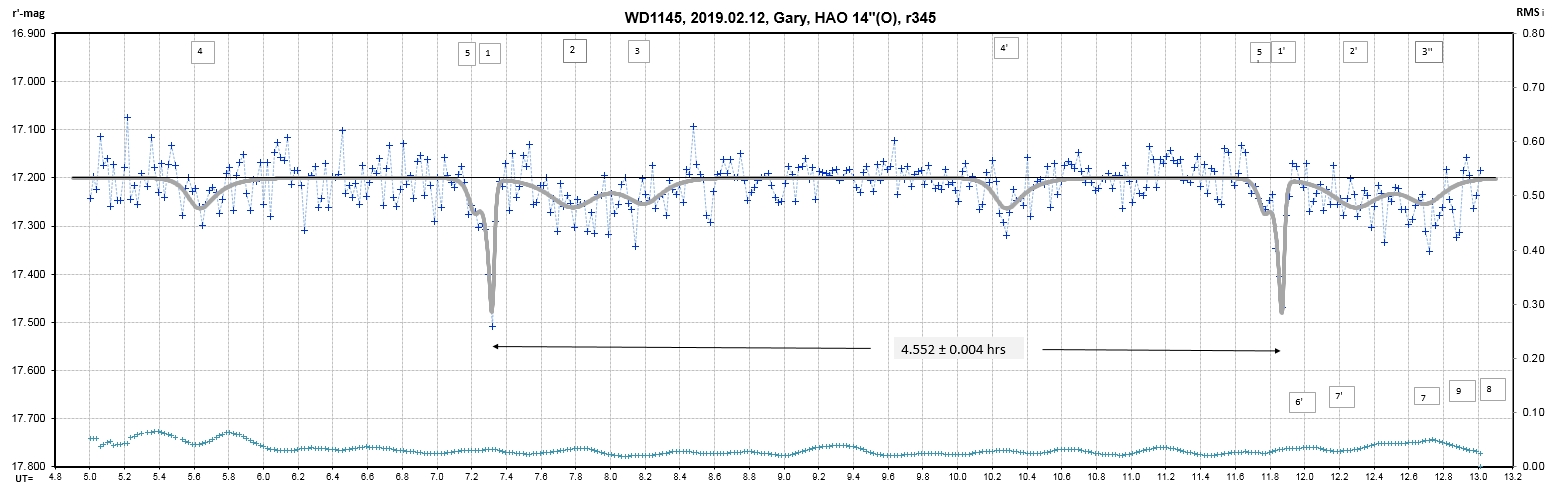
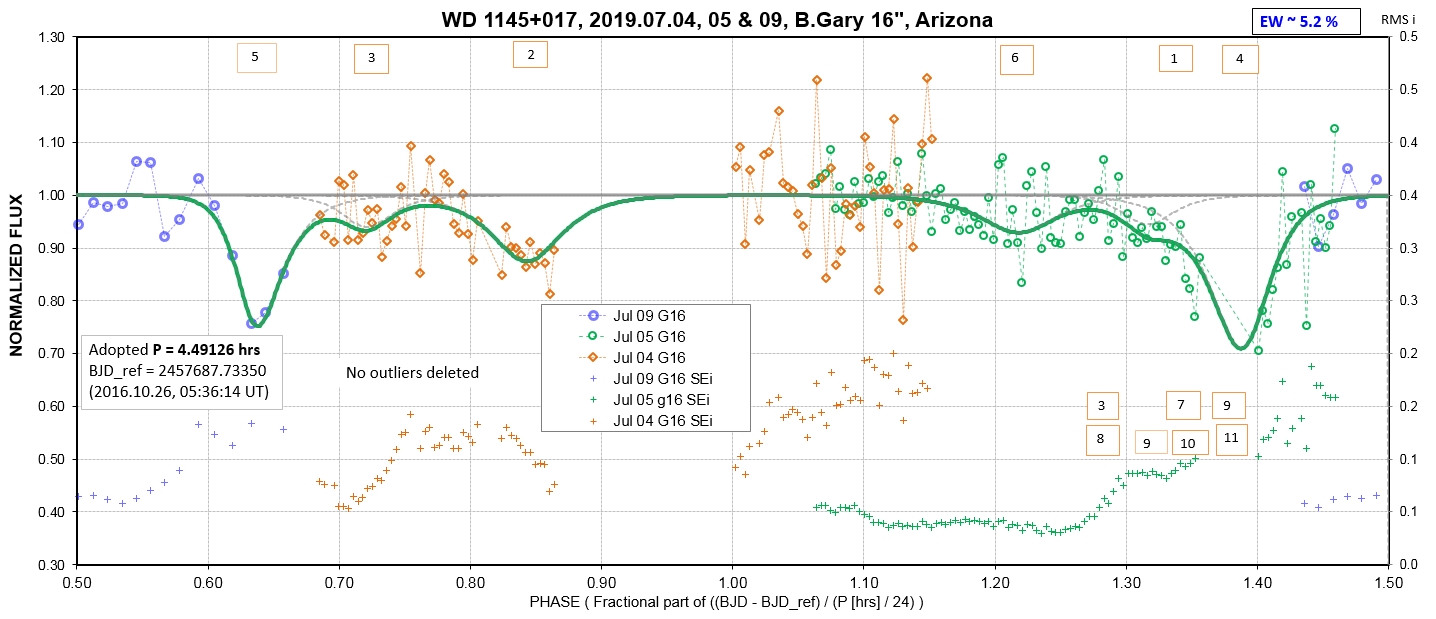
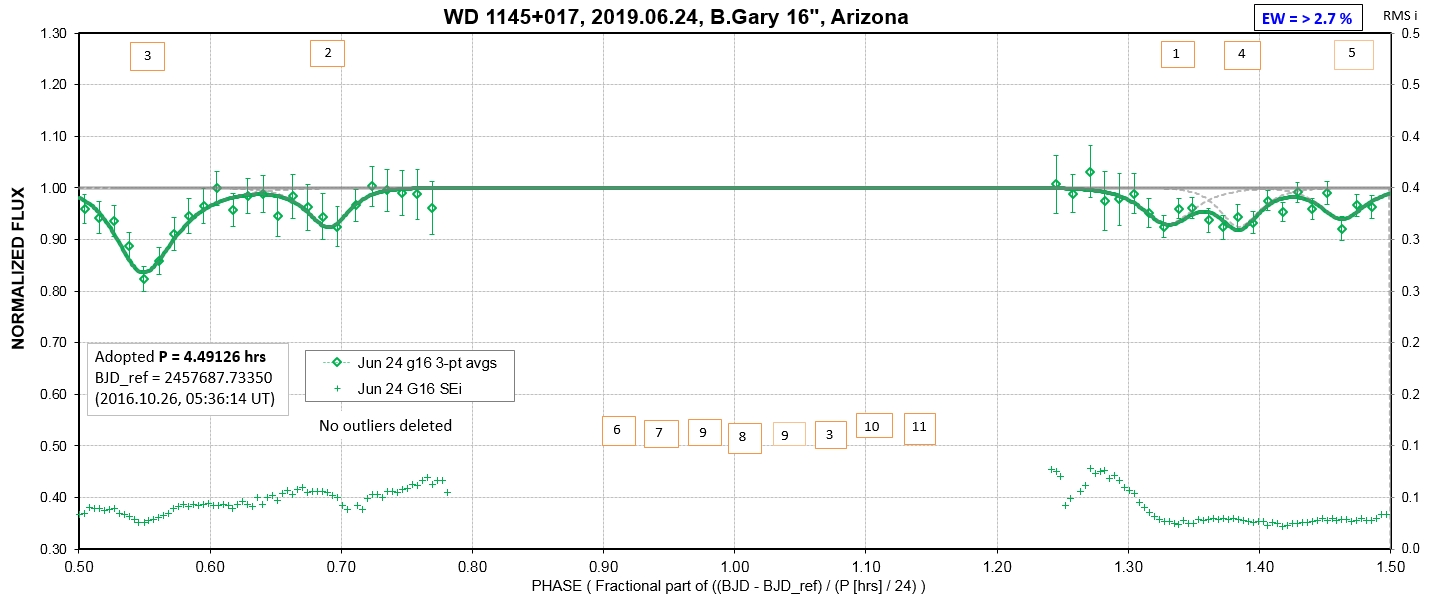
List of observing sessions
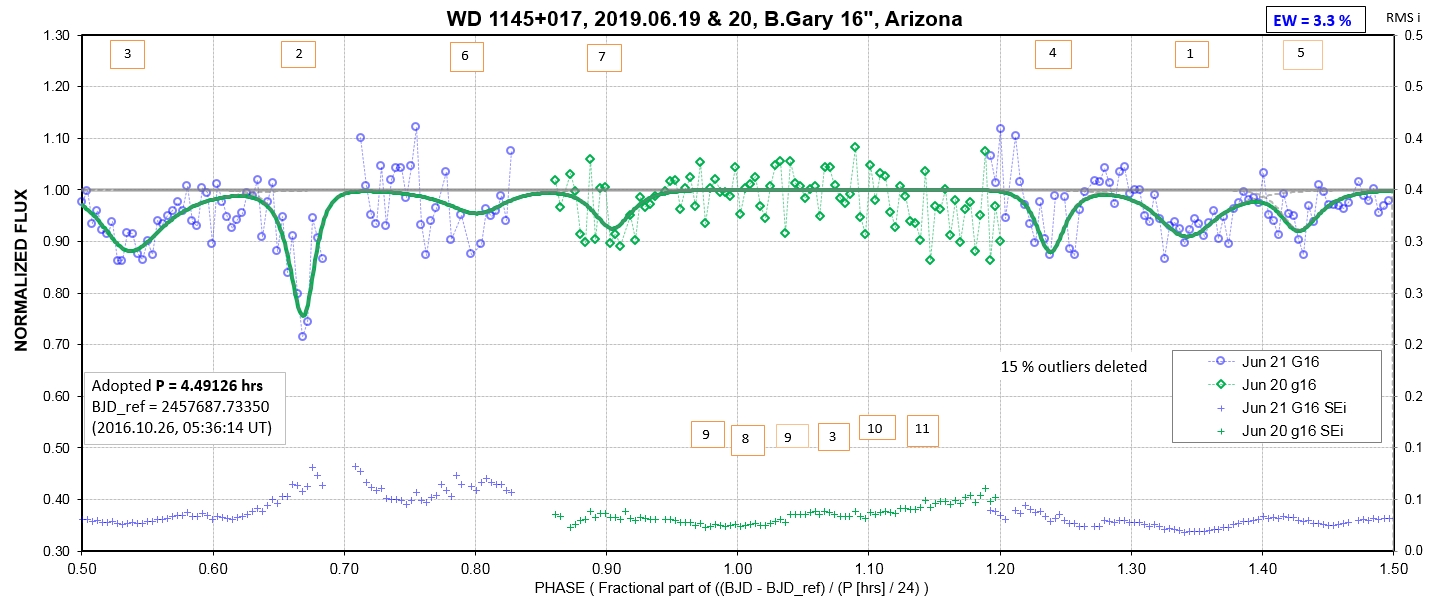
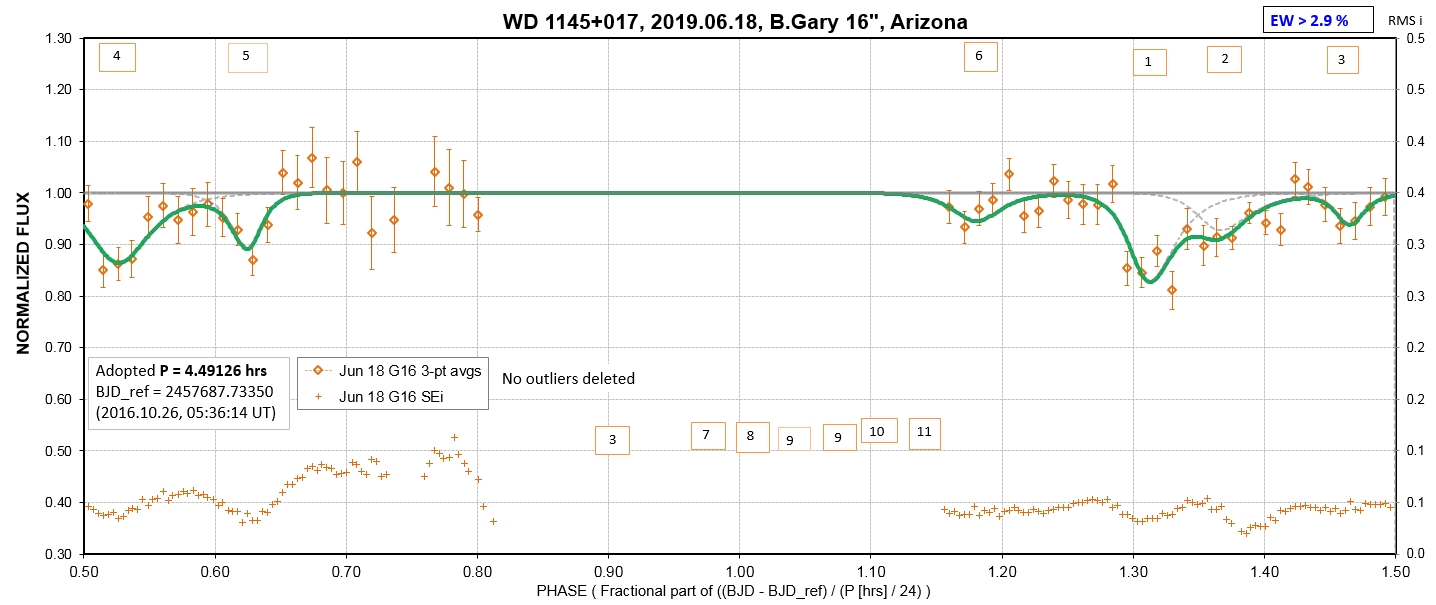
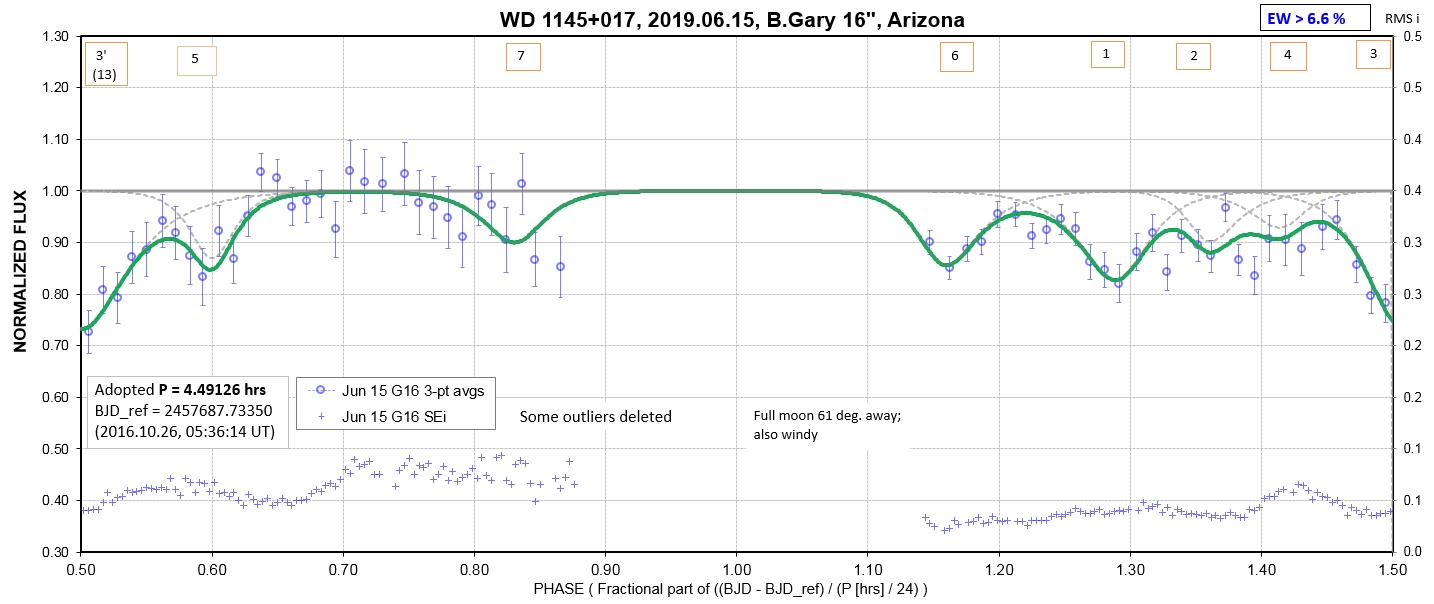
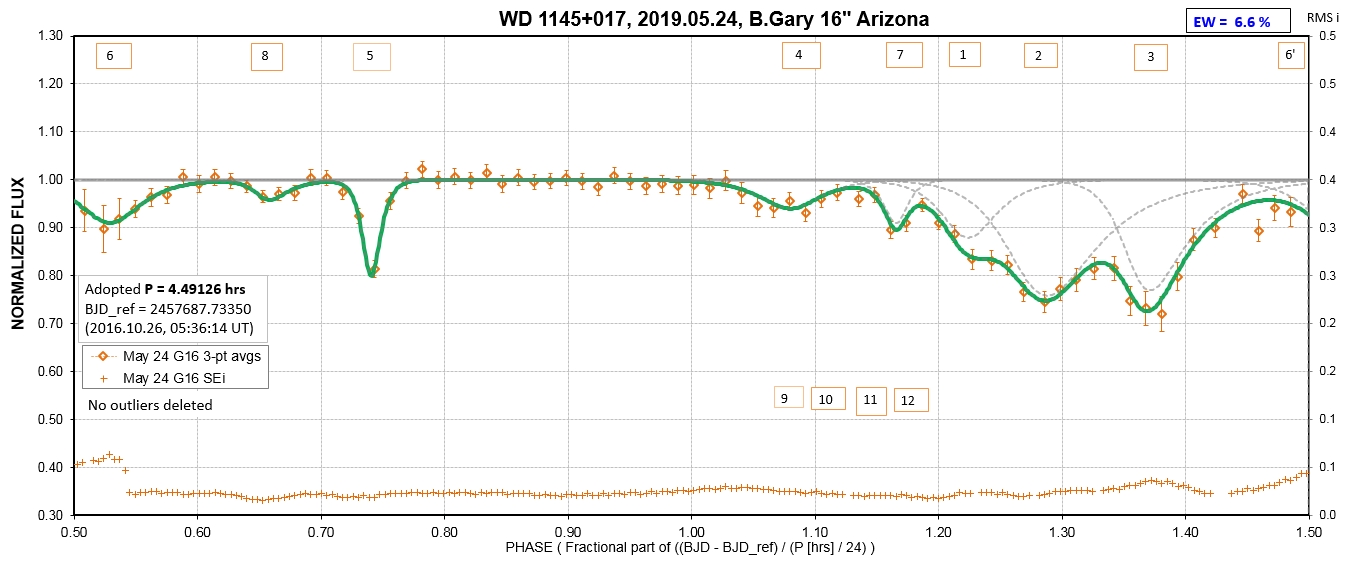
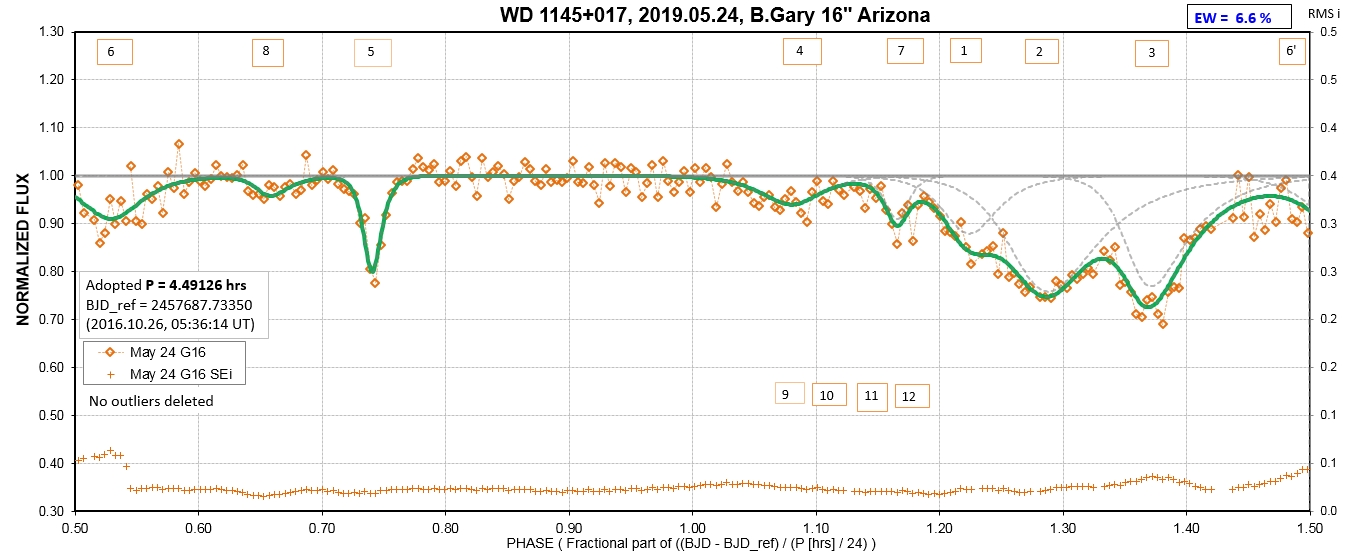
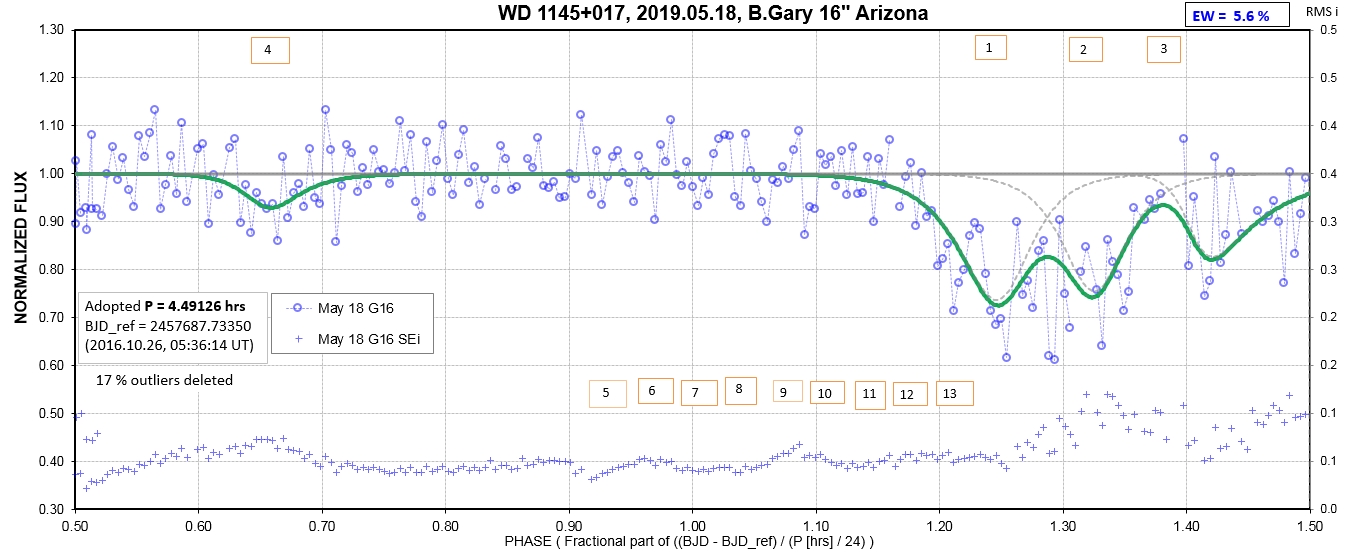
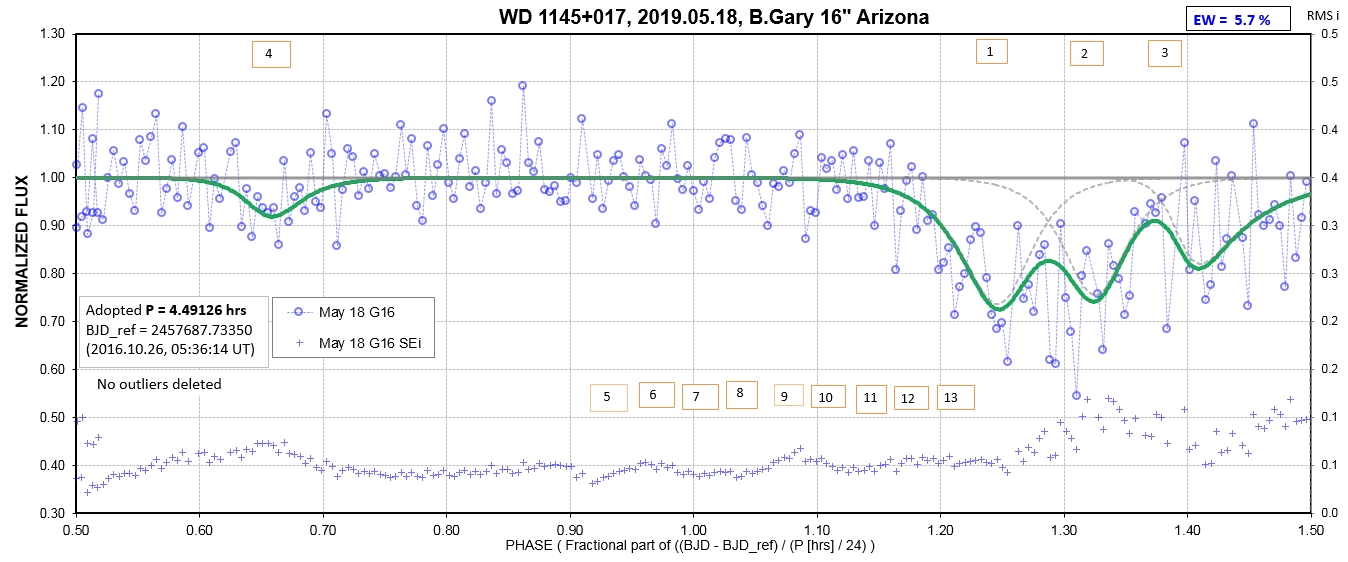
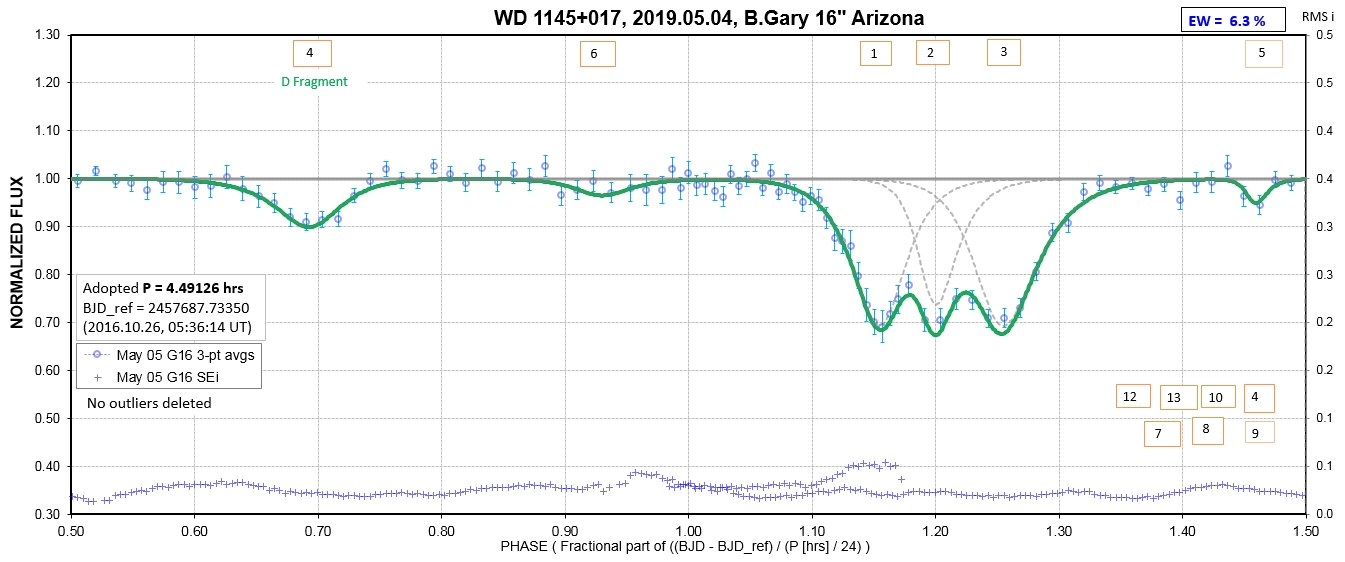
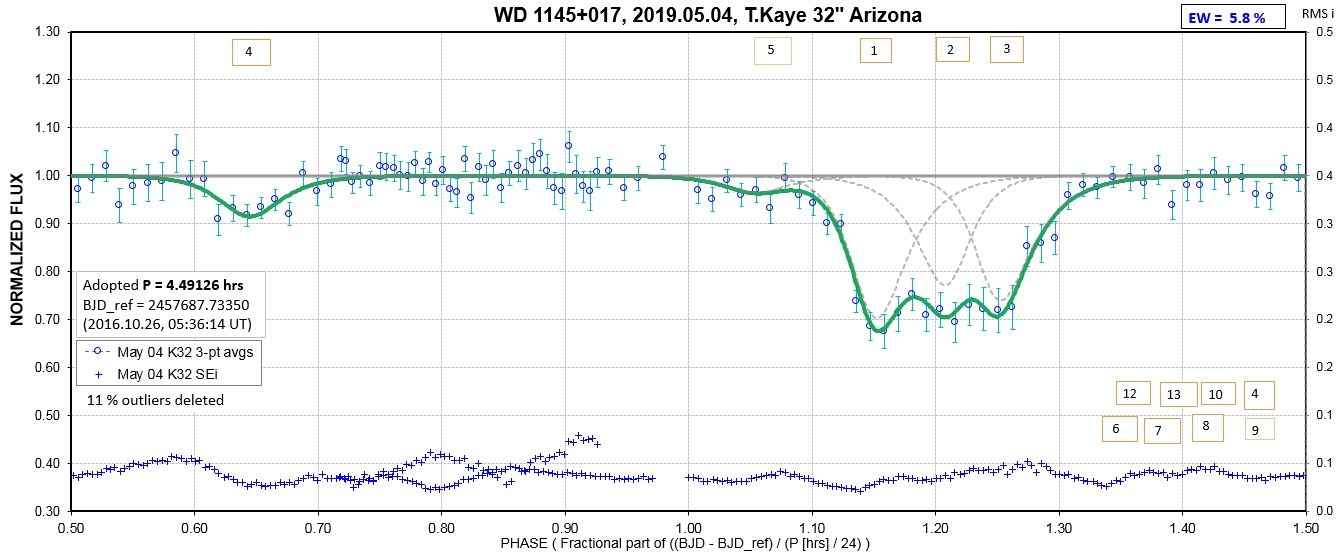
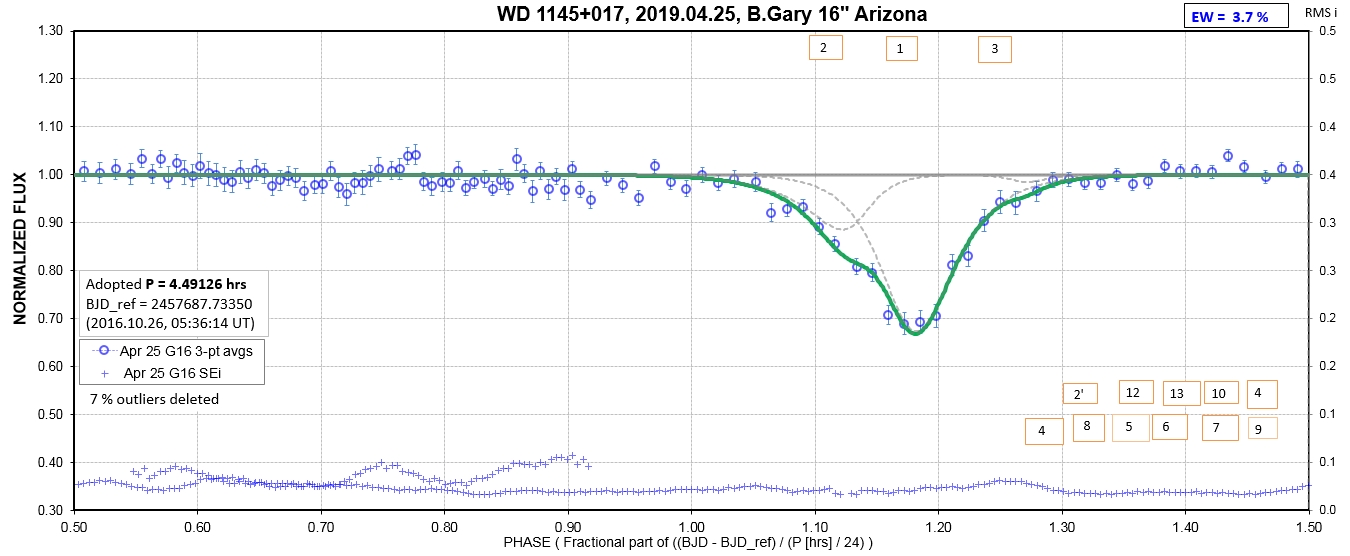
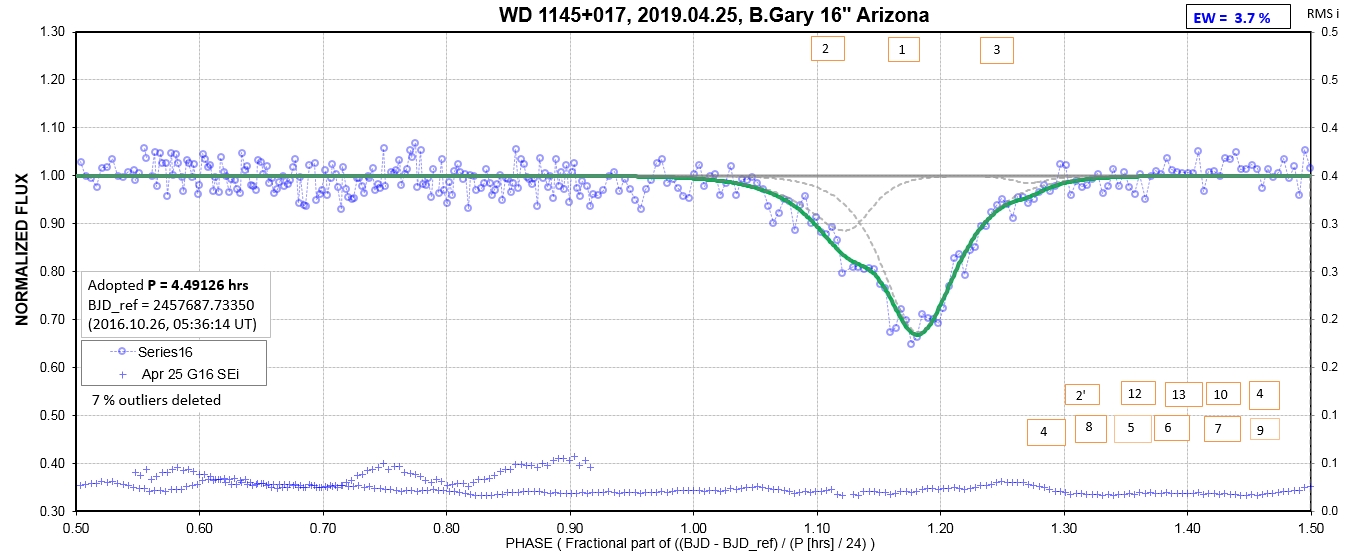
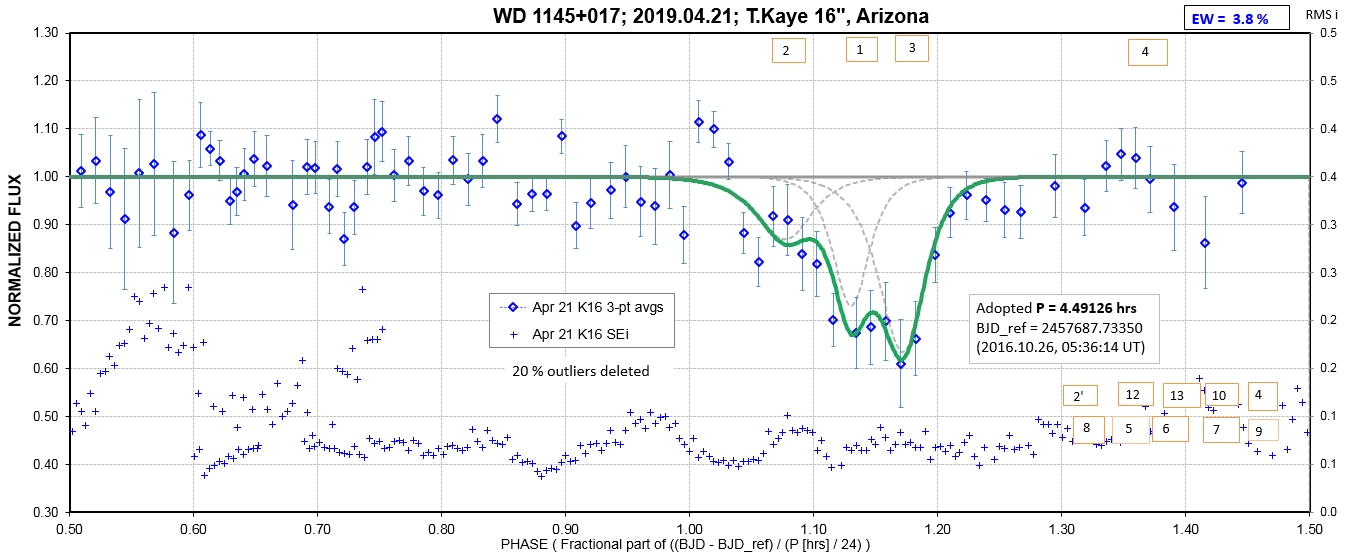
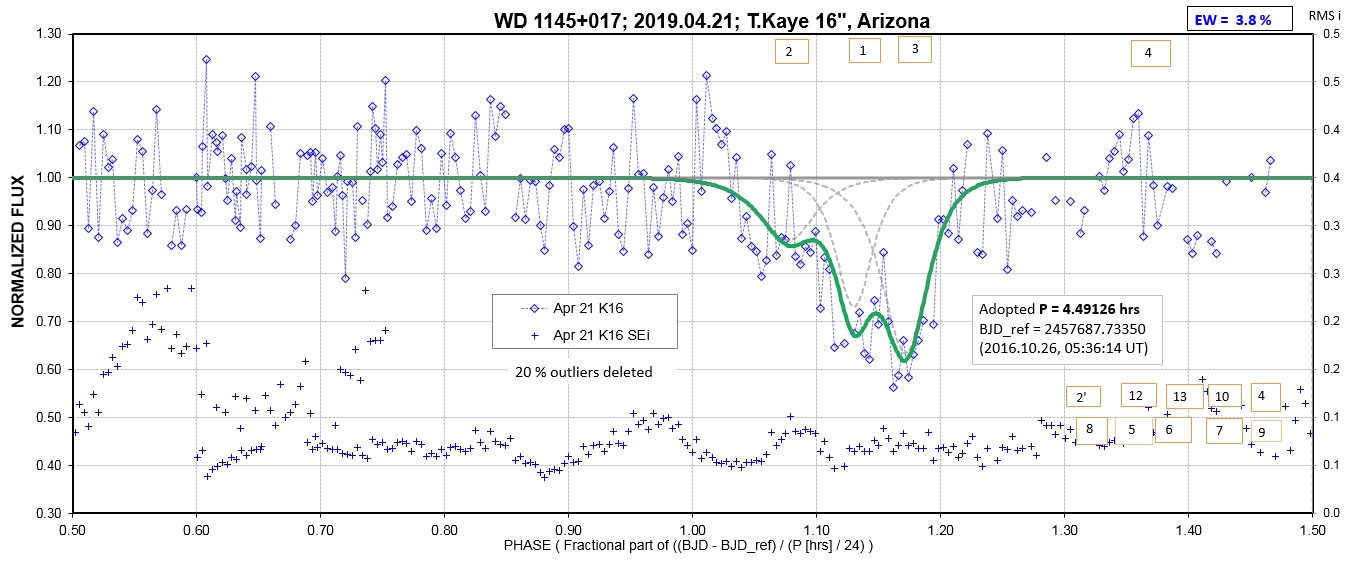
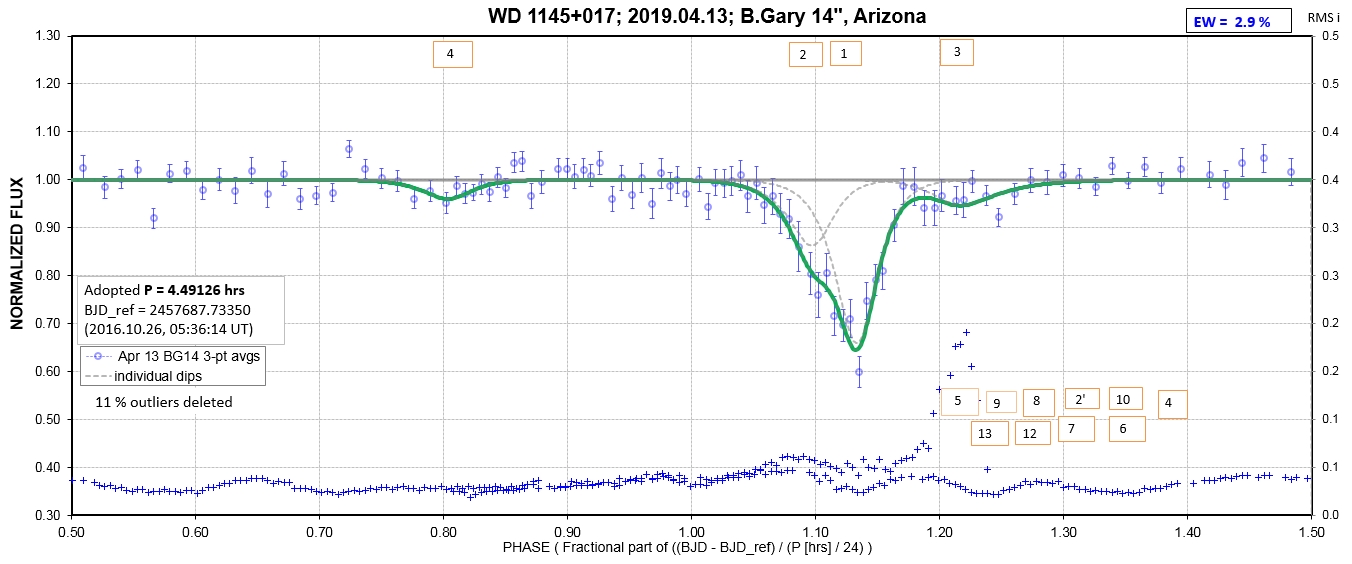
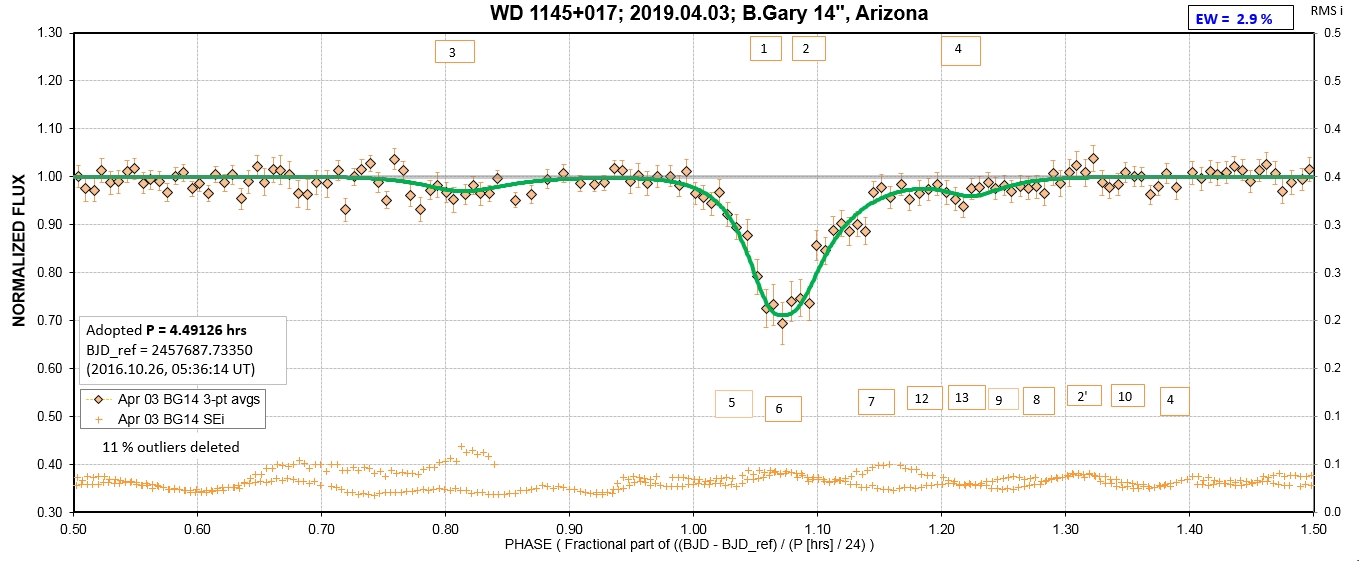
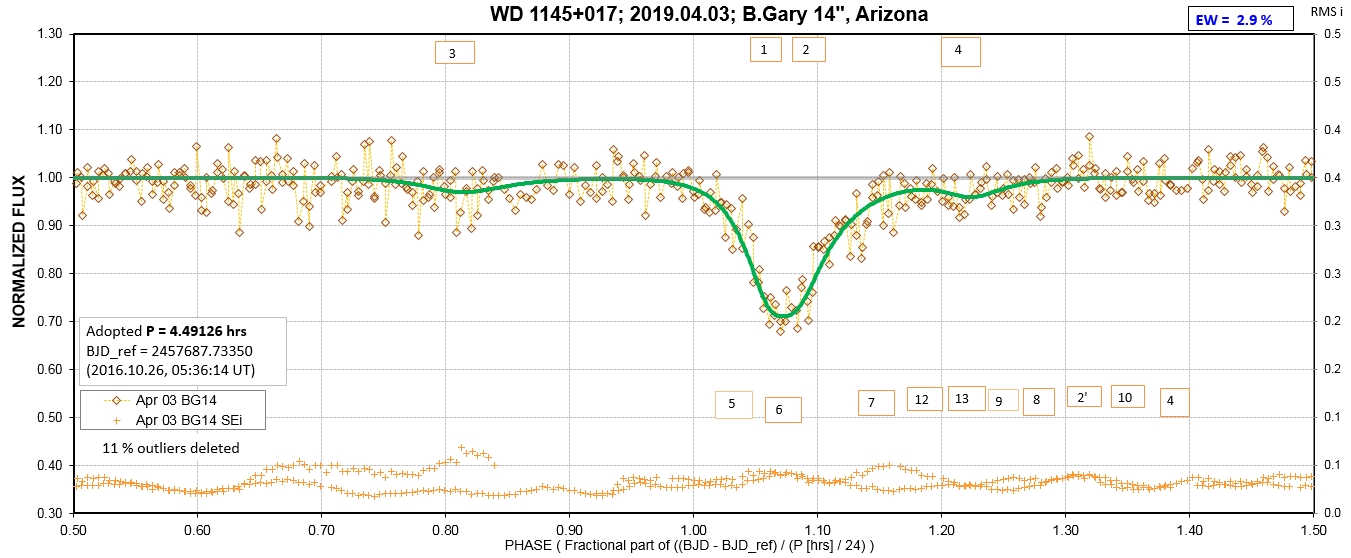
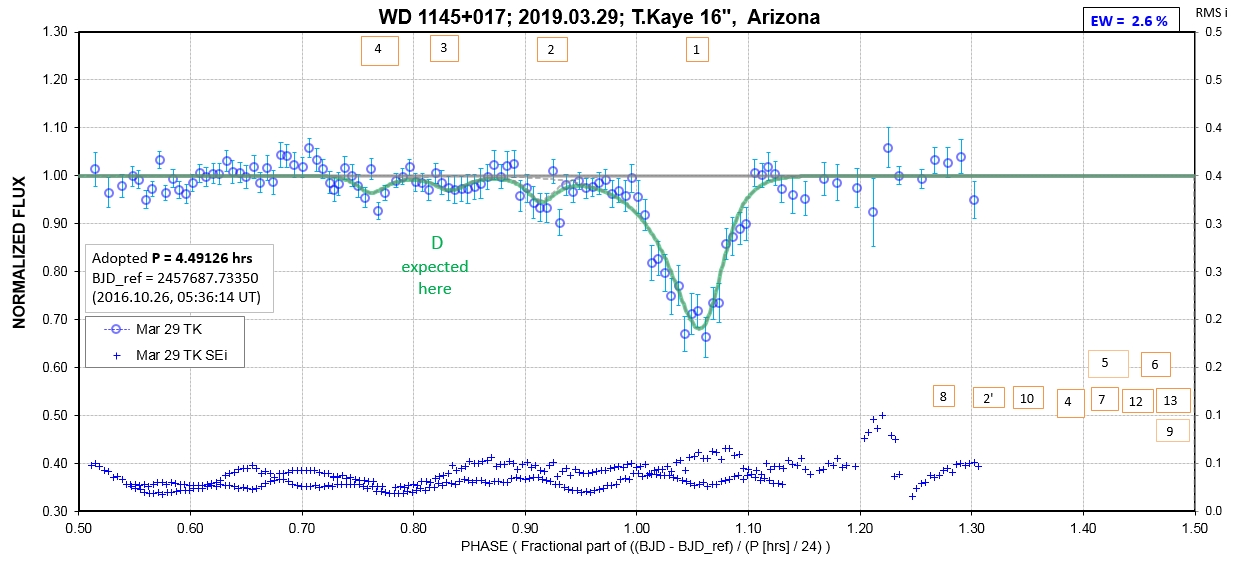
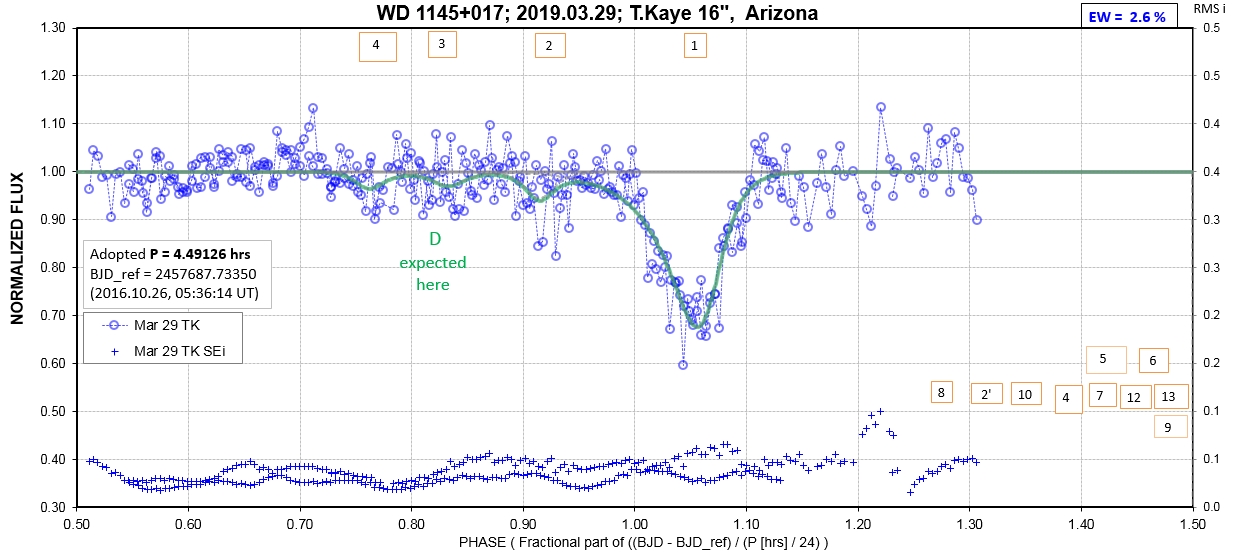
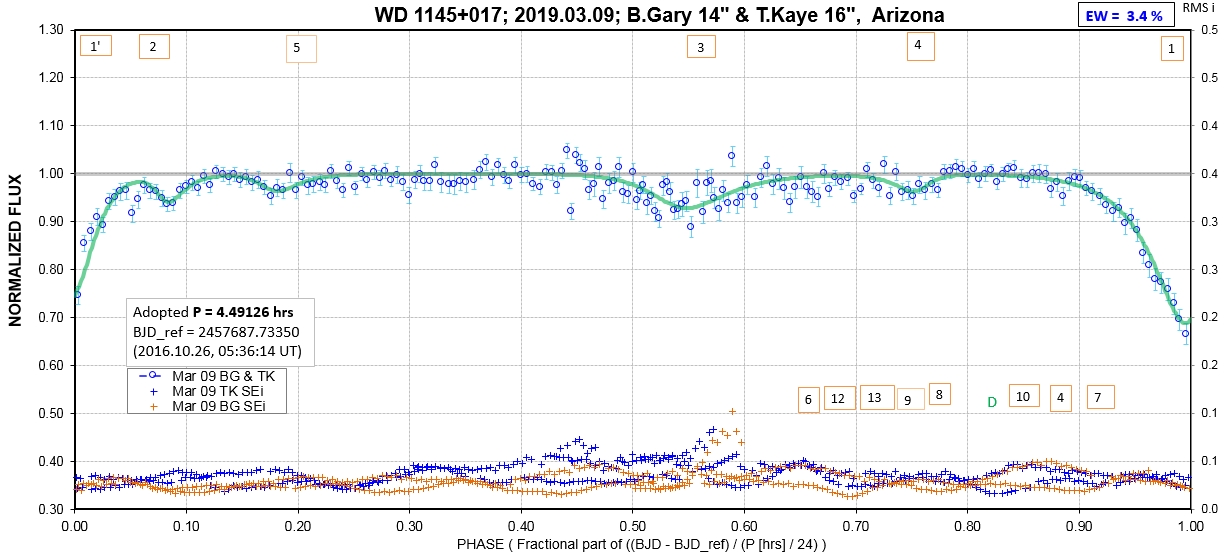
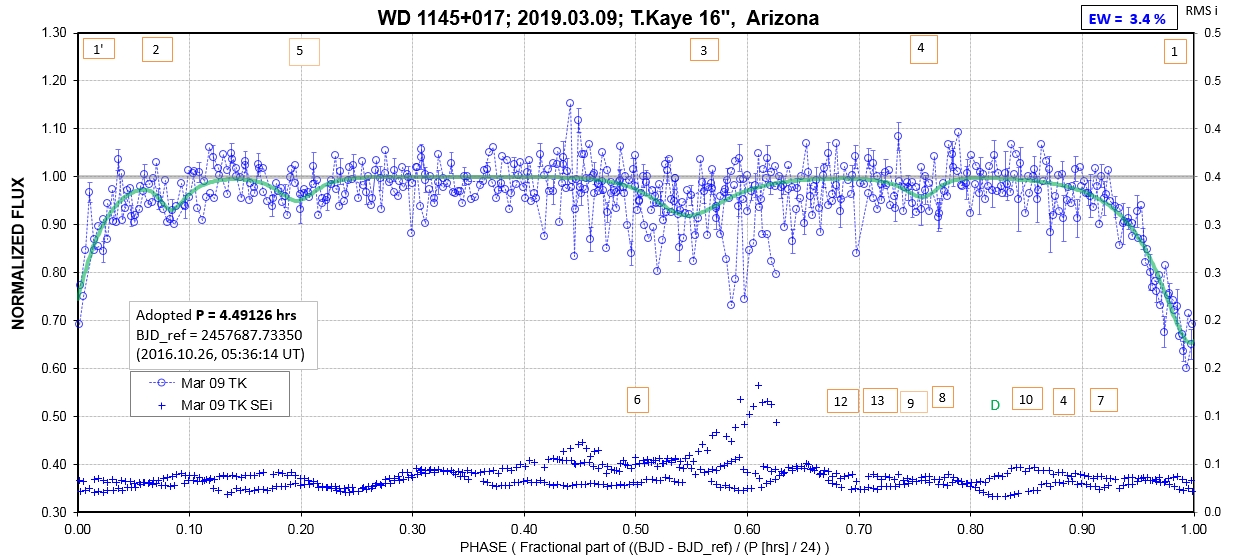
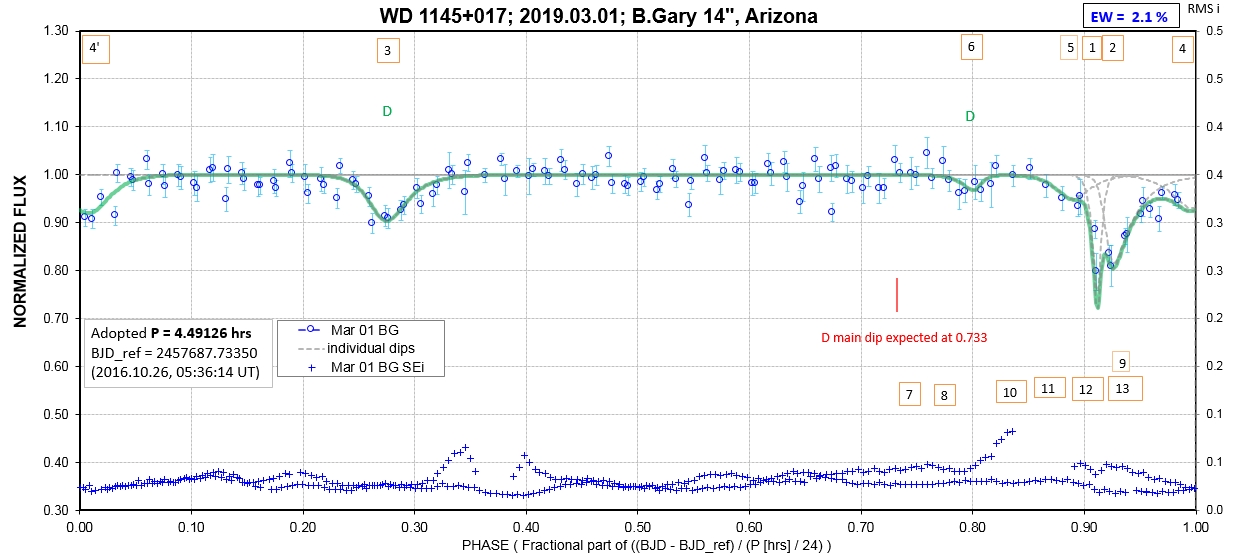
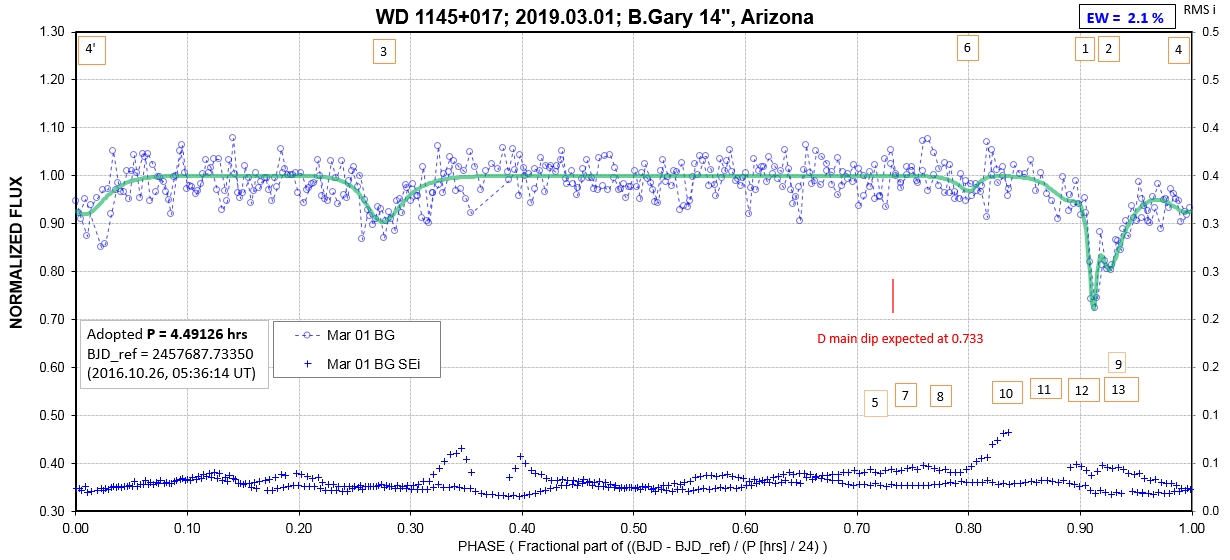
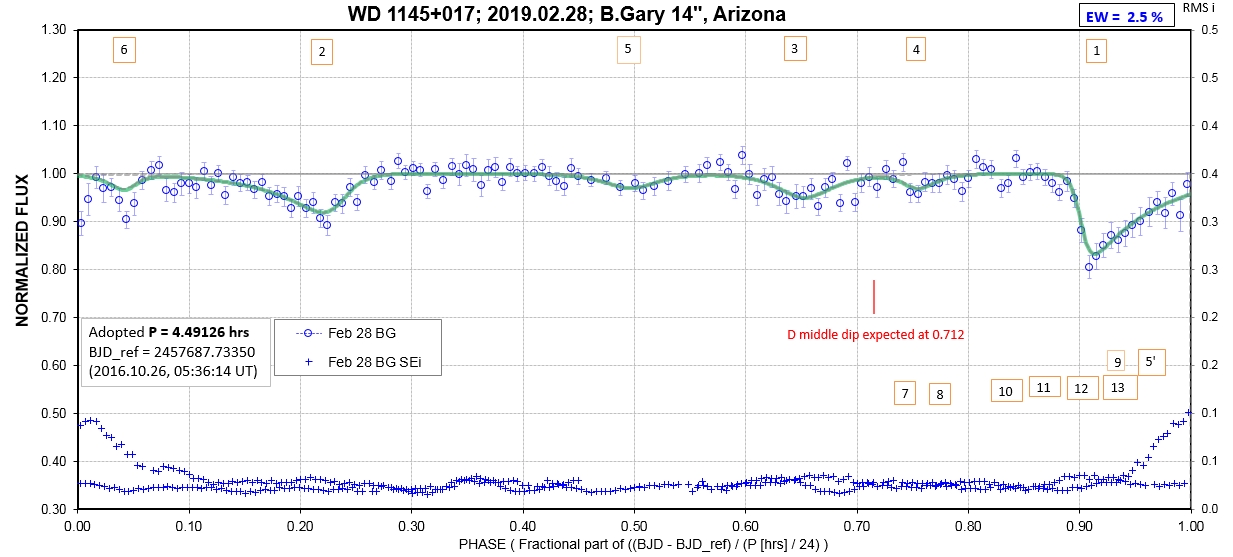
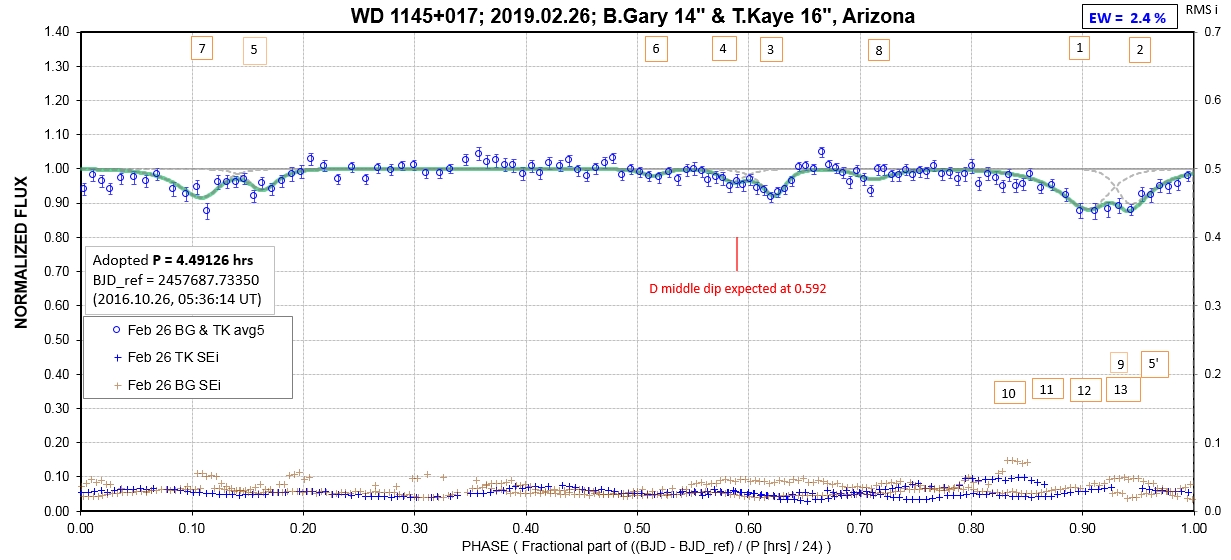
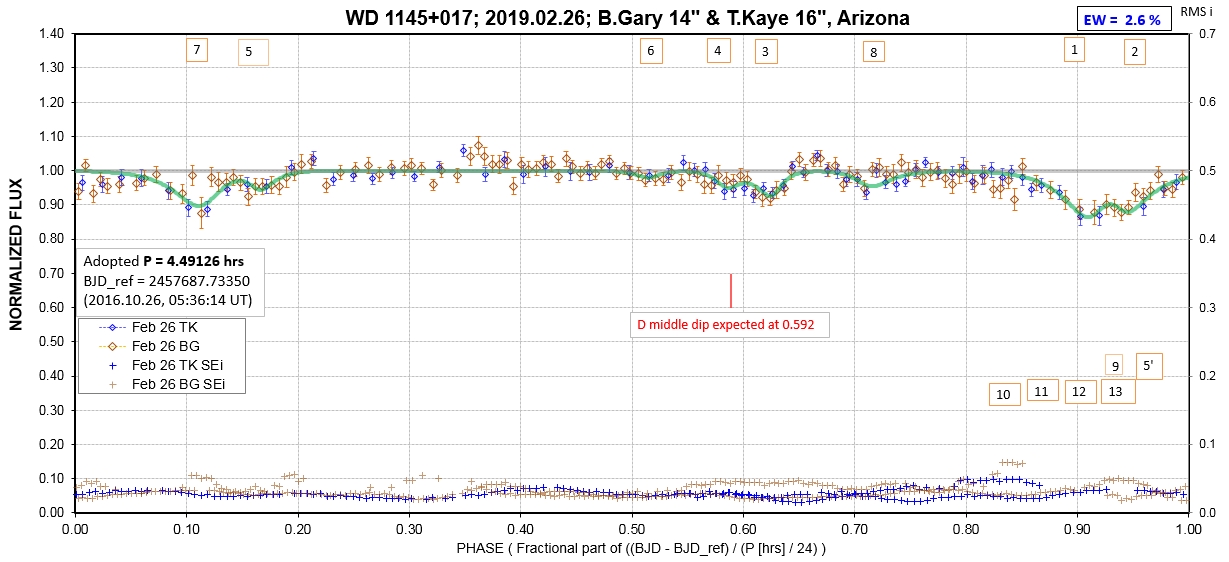
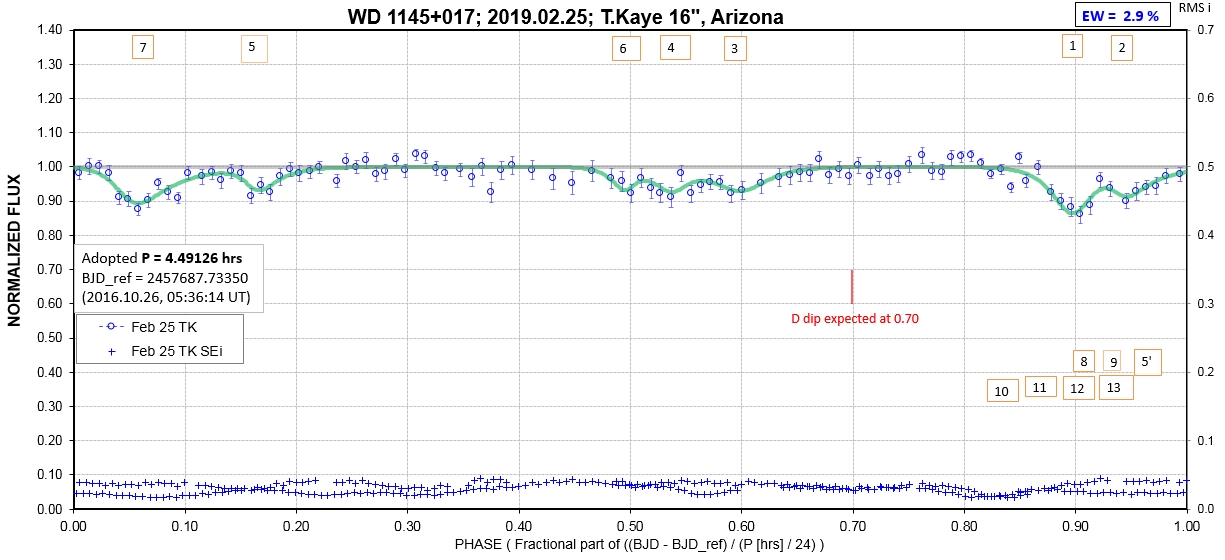
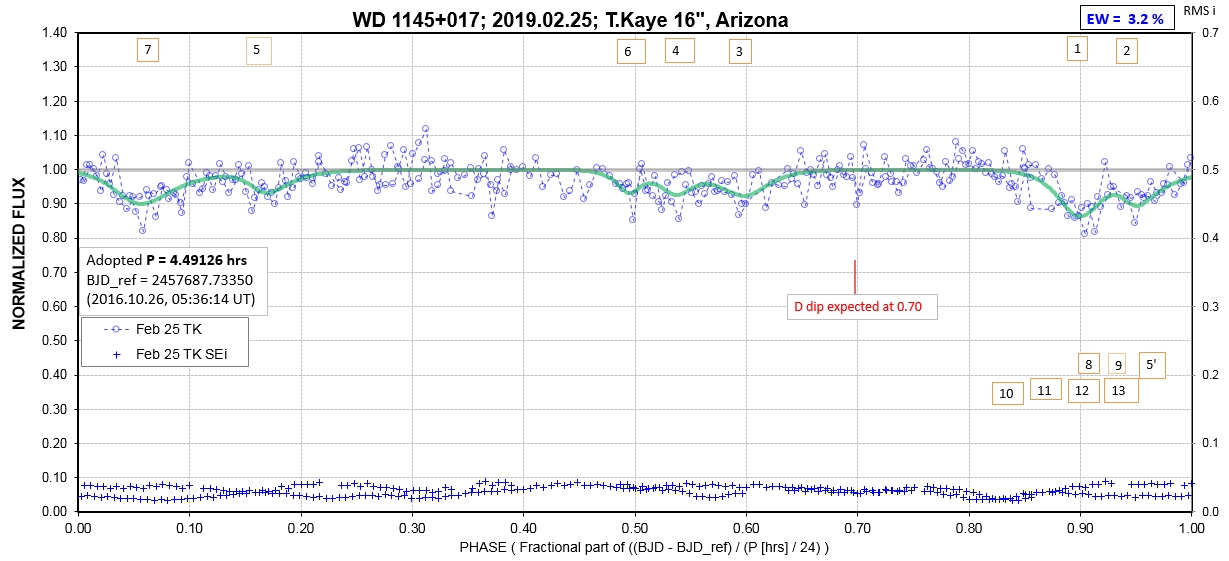
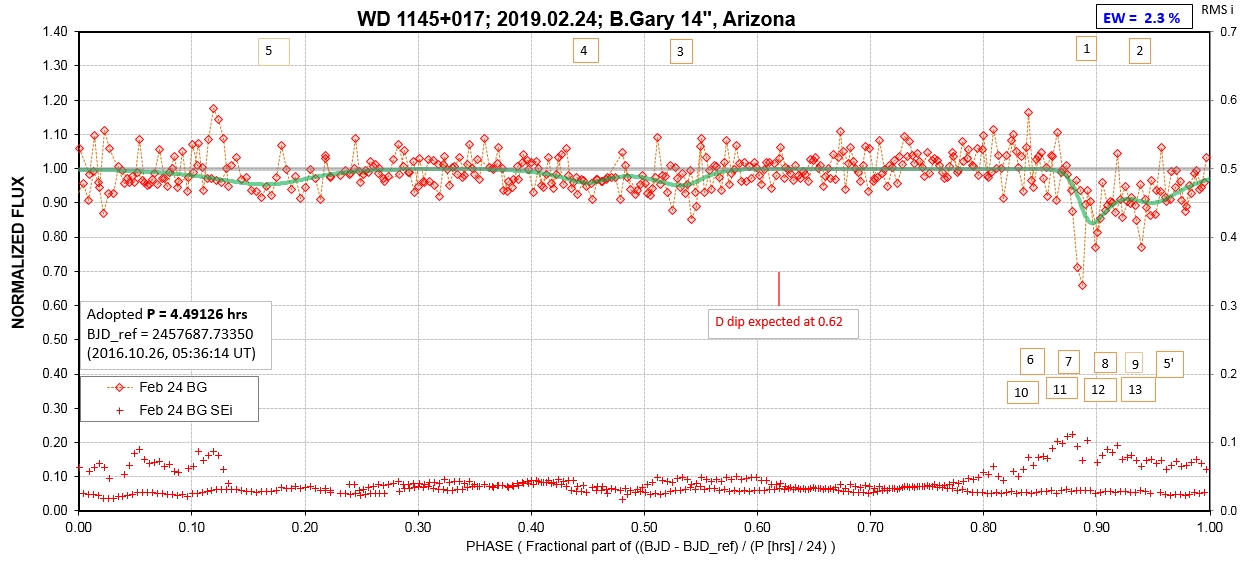
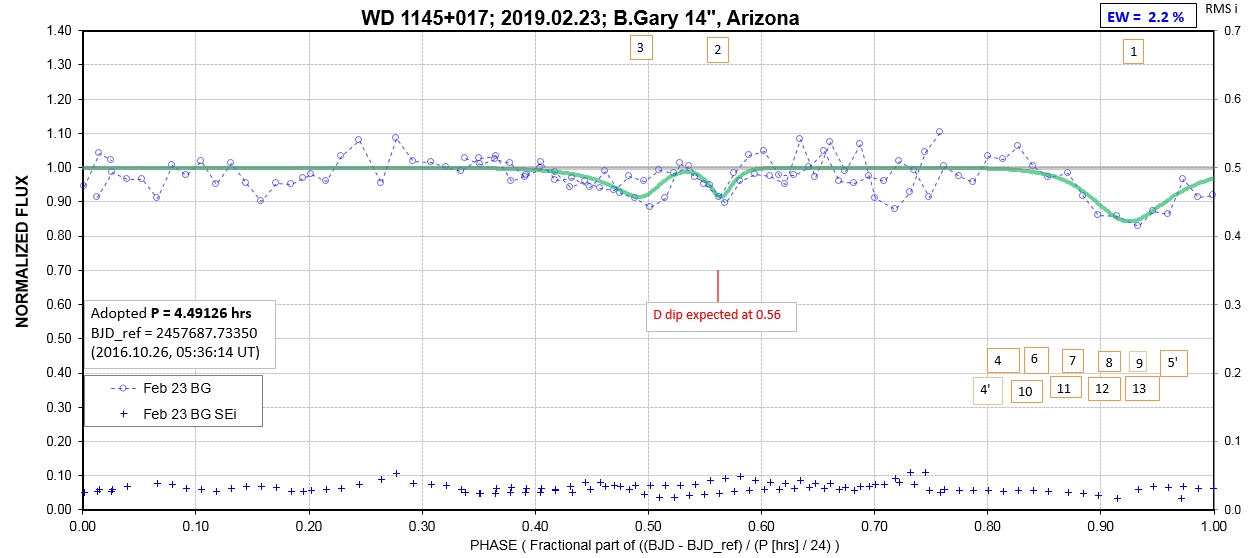
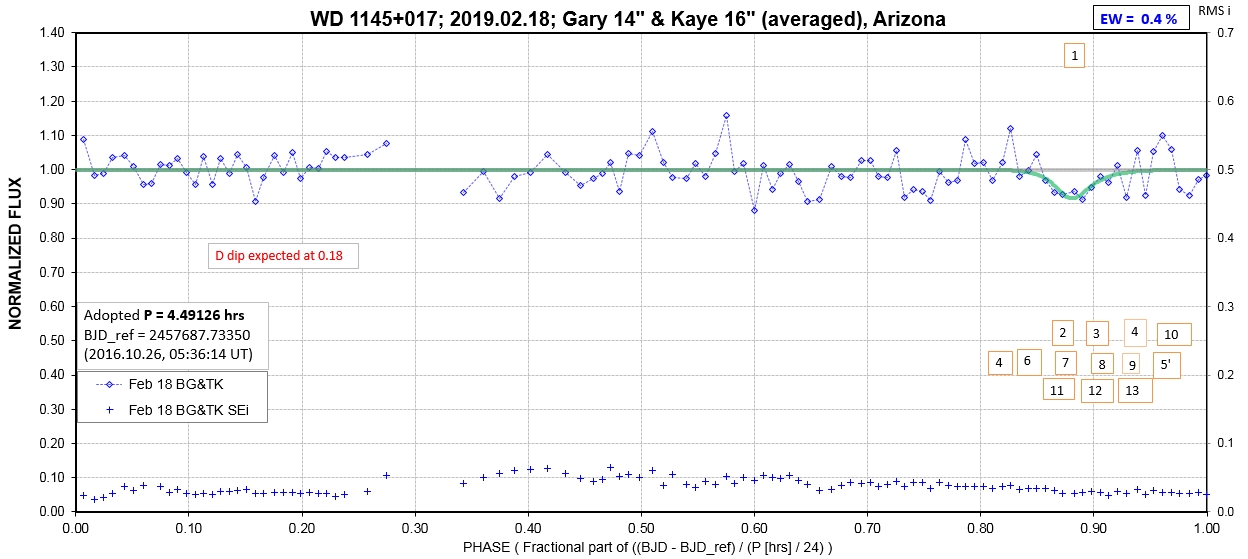
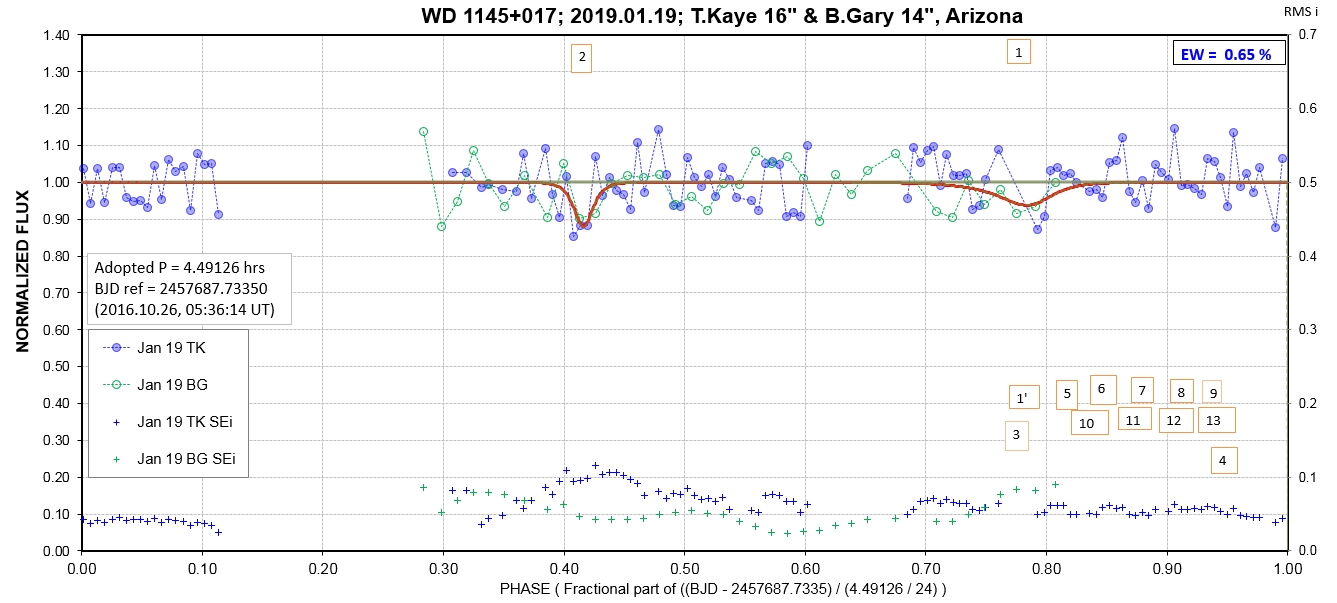
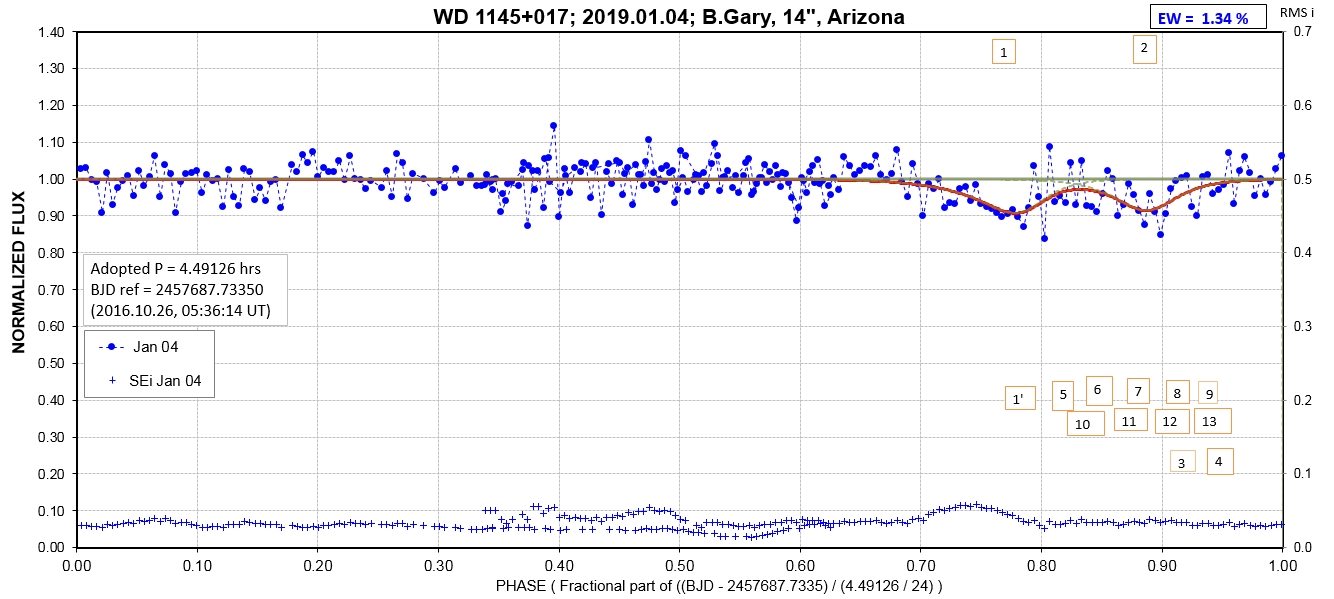
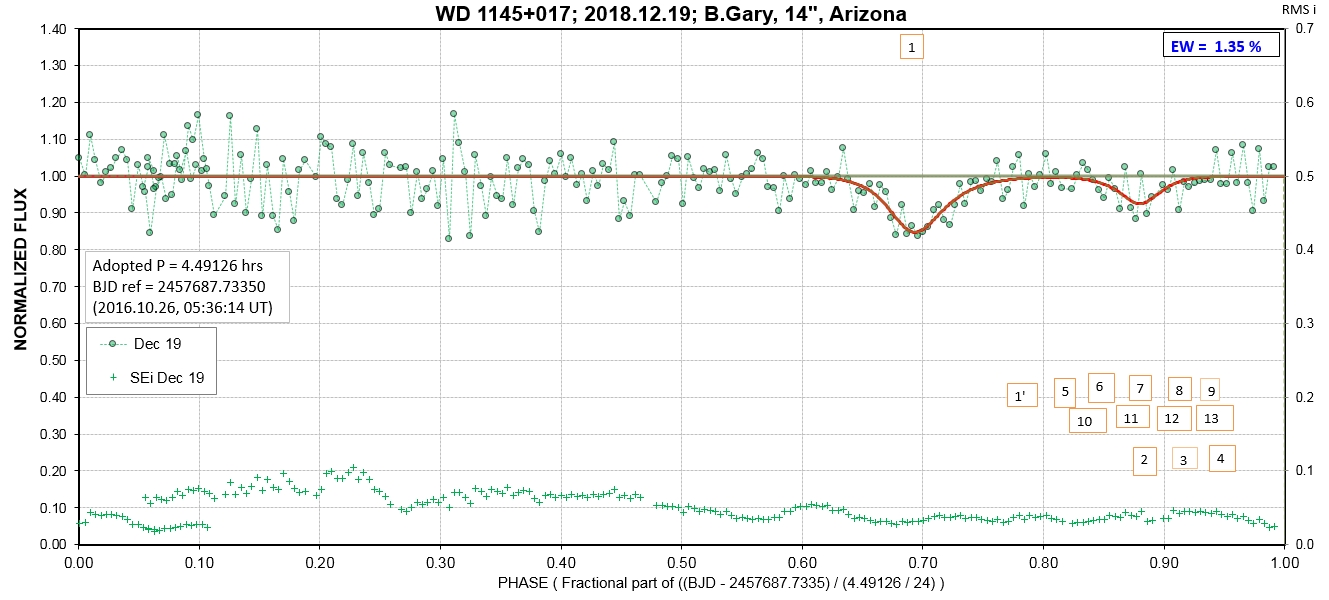
The following sequence of phase-folded light curves can be used to study the recent evolution of all dip activity.
The following 3 waterfall plots show dip phase using an ephemeris for the A-fragments.
The following 3 waterfall plots show dip phase using an ephemeris for the D-fragments.
The next 3 lots show dust production "activity" level vs. date.
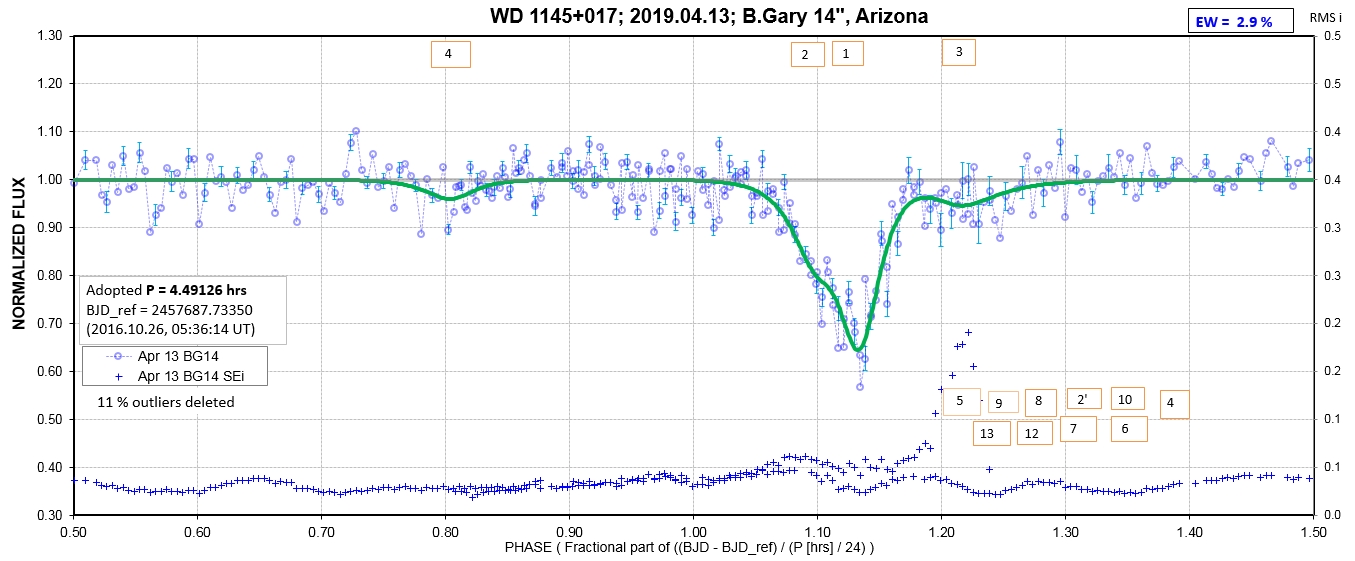
List of observing sessions