Bruce L. Gary, web page 3 of 4, 2016.12.20, 22 UT
2 of 4 - 2016.01.17 to 2016.07.13: LC Observations - 2nd of 2 sets of LCs for 2015/16 observing season
3 of 4 - 2015.11.01 to 2016.07.13: Overview, Results & Model Speculations (you are here) - based on all 158 LCs for 2015/16 observing season
4 of 4 - 2016.10.25 to 2017.01.31: LC Observations - 1st set of LCs for 2016/17 observing season
Easy-to-read document describing this amateur group's contribution to understanding white dwarf stars systems: PDF download MNRAS journal article version is at Abstract, PDF article, arXiv.
“…all the noonday brightness of human genius are destined to extinction in the vast death of the solar system, and that the whole temple of man's achievement must inevitably be buried beneath the debris of a universe in ruins.” Bertrand Russell, 1903, Independent Review, (also reprinted in Mysticism and Logic as Chapter 3, W. W. Norton and Company, New York, 1929)
Brief History of this amateur observing project
WD1145 basic info
Waterfall Overview
Details of gas disk model
Orbit diagrams
K2 Simulations
Traditional abstract and introduction
Summary of results (activity level vs. date, stacked light curves, waterfall plots, SED)
The Poet Within Me
Finder image
References
Related links (including a link to a very large web pages with many detailed light curves)
What's Going On? - A Layman's Overview
"...WD1145 is showing us what our solar system will be like for most of its existence!"
The WD1145 system consists of a typical size white dwarf (WD) that is orbited by several asteroid-size objects (possibly leftover planets). Dust is being produced by fragments (that have broken away from the asteroids) by one of several possible mechanisms. Some dust evaporates to its constituent atoms (sublimation), and they end up in an inner gas disk very close to the WD, which then ends up in the WD's atmosphere (causing the "metal" absorption lines). The dust that doesn't evaporate forms a "debris disk" that blocks star light. This disk will have the appearance of a ring system. We think it extends from the A-asteroid orbit, at 94 WD radii, to at least 110 radii, and maybe as far as 150 radii. Our simplest model interpretation has the several asteroid orbits and debris disk in the same orbit plane, inclined 89.5 degrees (i.e., tilted 0.5 degrees for edge-on). Here's a diagram illustrating that:
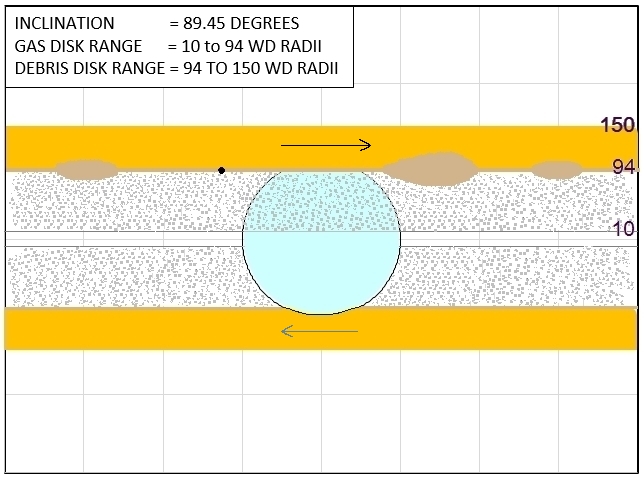
An artistic representation of how WD1145 would look from the Earth. The black dot represents the A-asteroid, moving to the right and about to produce a transit of 0.08% (too small for detection). The three brown ovals are dust clouds produced by fragments that have broken off the A-asteroid. Our light curves show fades (also called "dips") produced by dust clouds that expand and cover part of the WD disk. The middle dust cloud in this depiction is large enough to have produced a 4% dip (which is detectable using amateur telescopes). The dark tan bands are a debris disk, or ring system, consisting of spread-out dust clouds. The inner debris disk is opaque, and may become transparent in the outer region (due to low dust density). Small dust particles that migrate inward, toward the WD, and become so hot that the constituent atoms sublimate and never re-condense, form a disk of metal atoms (such as iron, calcium, aluminum, etc); it is referred to the inner gas disk. The metal atoms absorb light at only specific wavelengths, so most of the WD's light passes through the gas disk, and it is therefore essentially transparent. We believe that both disks have as their source dust from fragments that have broken off the A-asteroid (and 5 others, in slightly larger orbits in the debris disk). The numbers on the right edge show radial distance of edges of the ring system: the inner gas ring begins at 10 x WD radius, the A-asteroid and associated fragments are at 94 x WD radius, the inner edge of the debris disk is also at 94 x WD radius, and the outer edge of debris disk at ~ 150 x WD radius.
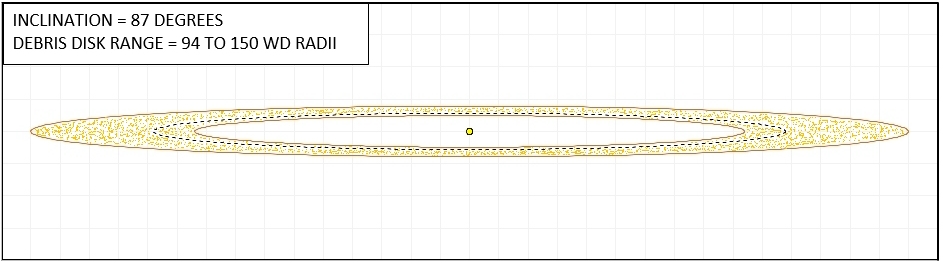
View of larger area for the purpose of showing the entire debris disk (gas disk not shown), using an exaggerated tilt of 87 degrees. The dashed line within the disk corresponds to an asteroid in the F-orbit, identified by Vanderburg et al (2015) with an orbit period of 4.858 hrs. For both panels the size of the WD star is "to scale." WD1145's debris disk "ring system" has to be "optically thick" in order to account for measurements of a "near IR excess" (i.e., measurements at 3.4 and 4.6 micron wavelength by the WISE spacecraft).
Asteroids and comets are thought to be in orbits that are shrinking (for reasons not yet established). As an asteroid migrates inward toward the WD the surface surrounding the asteroid defined by "equal gravity and centrifugal forces" also shrinks. An object located just outside this surface (also called a "Roche lobe boundary" and a "Hill sphere boundary") would drift away from the asteroid and begin to orbit the WD. When an asteroid has moved so close to the WD that the "Hill sphere boundary" reaches the asteroid end facing the WD, loose material (fragments) at that location are free to simply drift away from the asteroid and begin to orbit the WD. The fragment's orbit will be slightly smaller than the asteroid's orbit (closer to the white dwarf by ~ 4 times the long radius of the asteroid).
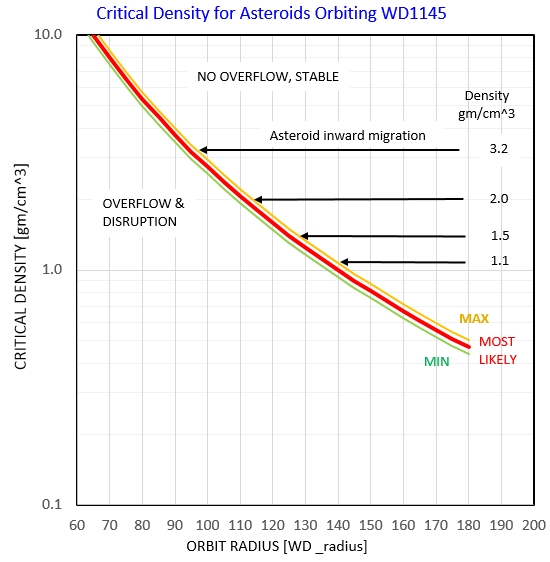
Inward migration track of 4 asteroids toward the white dwarf until the asteroid's Roche lobe boundary shrinks to the size of the asteroid, causing "overflow" at the end of the asteroid facing the white dwarf. The lowest density object (1.1 gm/cm2, a comet), begins an overflow when it reaches a distance of ~ 140 times the white dwarf radius. The densest asteroid (3.2 gm/cm3) begins an overflow when it reaches a distance of ~ 94 times the white dwarf radius. The overflow from all of these object produces the debris disk, extending from ~ 94 to 140 times the white dwarf radius. (The 3 curves correspond to uncertainties of the white dwarf's size and mass, as well as the uncertainty of the football-shaped object's volume when the Roche lobe surface shrinks to the size of the asteroid; adopted volume ratio = 52 ± 4 %.)
Assuming the A-asteroid has an elongated shape (like a football) the asteroid's size is estimated to be 540 ± 50 km (in long direction). This is based on the difference in orbital period between the A-asteroid and the fragments that have broken away and produce the dust clouds that transit the white dwarf. To understand why the dust-producing fragments are in slightly smaller orbits than the asteroid that they broke away from, it is necessary to refer to the "Hill sphere model" proposed by Dr. Saul Rappaport. In this model the asteroid orbits so close to the white dwarf star that the strength of the gravitational fields of the asteroid and star (adjusting for centrifugal force) are the same at the part of the asteroid's surface facing the star. Any loose fragment of the asteroid at this "L1 point" on the asteroid surface can just float away and orbit the star. The orbit will be at a distance from the star that is slightly smaller than the distance of the fragment when it floated away (the "slightly smaller" part is due to a gravity pull on the fragment as it floats away). The difference in average orbit distance (asteroid "mother-ship" versus fragment) will be ~ 4 times the size of the asteroid (radial distance from asteroid center to surface facing the white dwarf). Since orbital period is dictated by orbit size, we can use the difference in orbit period of the fragments with respect to the asteroid to determine the size of the asteroid. If this model is correct then the A-asteroid diameter (longest dimension of a football-shape) is ~ 60% that for Ceres, and the mass of the A-asteroid is ~ 1/10 of Ceres (taking into account that the volume of a football shape is ~ 50% of the volume of a sphere with radius of the longest dimension). This "Hill sphere model" is still just a suggestion, awaiting confirmation.
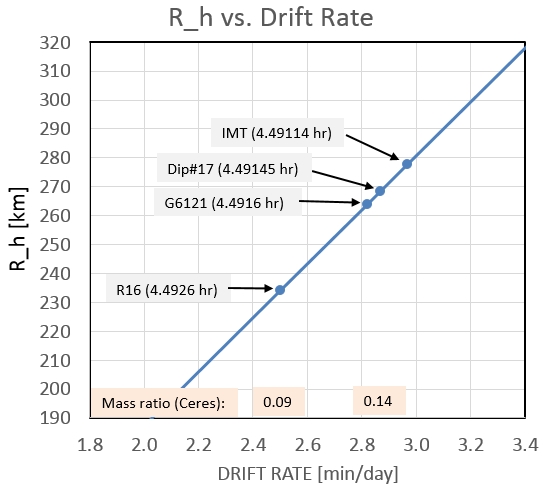
Relationship between fade feature drift rate with respect to the A-asteroid ephemeris and A-asteroid size. A consensus for measured drift rate is 2.85 minutes/day, corresponding to a radius of ~ 270 km (longest dimension of a football-shaped asteroid). The asteroid mass is estimated to be ~ 1/10th that of our solar system's asteroid Ceres.
The manner in which dust clouds migrate outward (by small distances) to form a debris disk of dust, and inward toward the WD to form a gas disk, are the subject of continued speculation and modeling analysis. The inward migration involves the breakup of dust particles to constituent atoms, which form an inner "circumstellar" disk of atoms (extending from 10 to 64 WD radii, as suggested by Redfield et al., 2016). This inner disk is a gas, not dust. Gas closer than some distance (such as 10 WD radii) may be captured by the star's magnetosphere and quickly brought to the star's surface (for more on this model, see link). The outer debris disk (pictured above, from 94 to ~ 150 WD radii) consists of dust particles (maybe some gas). Both the inner gas disk and the outer debris disk change slowly, whereas their source, the dust clouds at 94 WD radii (producing the light curve fade events that we observed during the past 8 months), can change abruptly due to either collisions between fragments or breakup without collision involvement.
Since dust clouds should disperse on timescales of a few days (due to orbit shearing) there must be a component of continual dust production. The mechanism for dust production is also the subject of much speculation, and will be the subject of future publications by modelers. I'm not a modeler, but I have suggested the following mechanisms:
1) Continual micro-meteoroid bombardment of the fragments by previously released and dispersed dust clouds.
2) Heating of fragment surfaces that are favorably oriented (facing the WD star for part of each orbit), causing surface temperature to rise to 1700 K (or ~ 1850 K within craterlet bottoms), causing melting of minerals.
3) Spinning of fragments that is fast enough for centrifugal forces to move molten material to the edges where it is thrown off to form a dust cloud.
4) Spinning of fragments that consist of rubble piles held together initially by inter-molecular forces, whose loss of cohesion is continual, leading to a continual ejection of dust with a size distribution of large range. The smallest particles should be pushed away from the WD by radiation pressure, causing them to be in larger orbits with longer periods, and this should produce a spreading of dip structure to larger phases (this spreading pattern is supported by the observations).
In addition to some mechanism for continual dust production, collisions (or nearby passes) of fragments with other fragments should produce sudden increases of dust cloud density and size. There may be thousands of fragments, and it's only after a collision (or near pass) between them that they "come alive" for a few days, weeks or months. The most interesting collision possibility is of a fragment with the asteroid! The dramatic increase in fade activity that occurred about a year ago (sometime between 2015 June and October) must have been produced by such a fragment/asteroid collision. Consider the following record of overall fade activity:
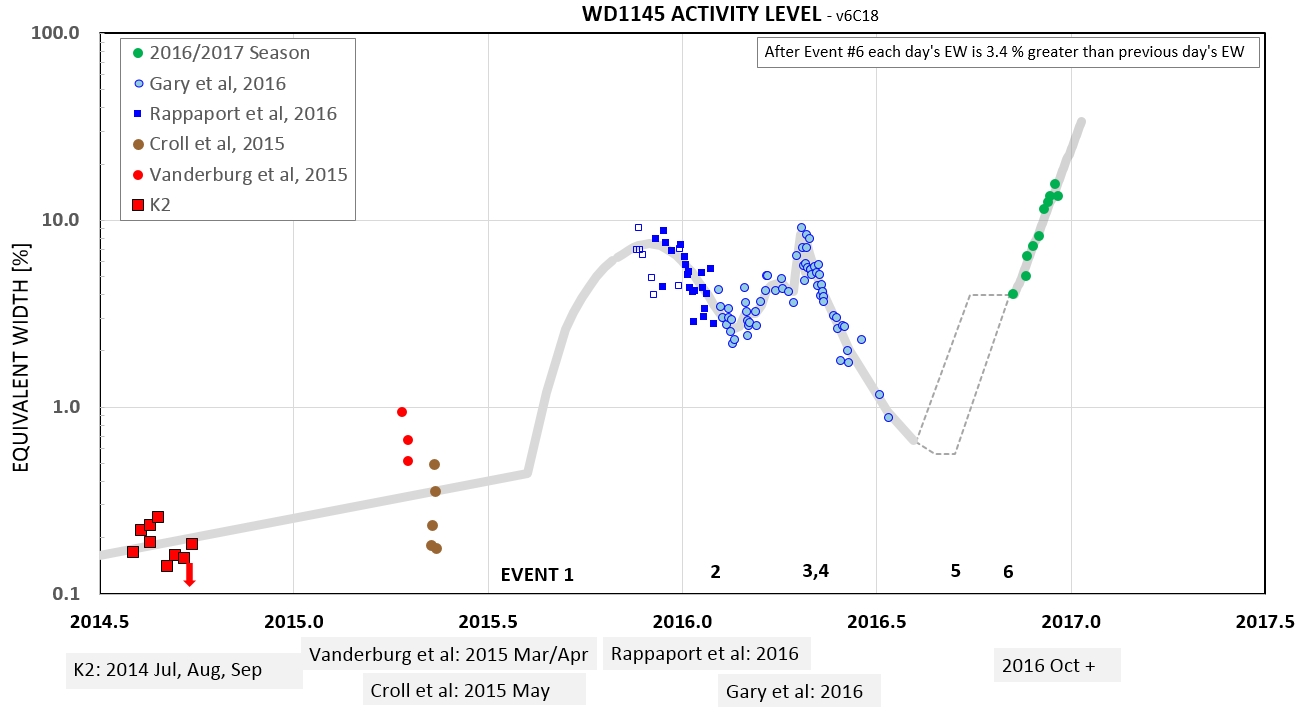
Activity level vs. date. Activity level is defined as the sum of "area under the curve" for all dips occurring during a 4.5-hour orbit. A 45-fold increase is apparent during parts of the 8 months of our amateur team observations compared with the Kepler K2 observations 2 years earlier, and it may have occurred after a hypothetical collision between a fragment and the "mother ship" asteroid in 2015 September (Event #1). Activity level declined steadily starting in 2016 April, and by the end of the first observing season (2015/16) activity had returned to a level almost as low as before the September 2015 event. However, the first few observations of the new observing season (starting 2016 Oct) shows an uptick of activity, with a 2-step pattern (Events #5 and 6), reaching ~ 75 times the K2 level of activity (as of 2016 Dec 15). If the rate of increase continues according to the fitted model (4 %/day) the star could be totally obscured, and invisible, sometime in 2017 February. A more likely limit to activity is 60% "equivalent width", given that individual dips have never exceeded this value, and this level of activity is projected to occur in 2017 January.
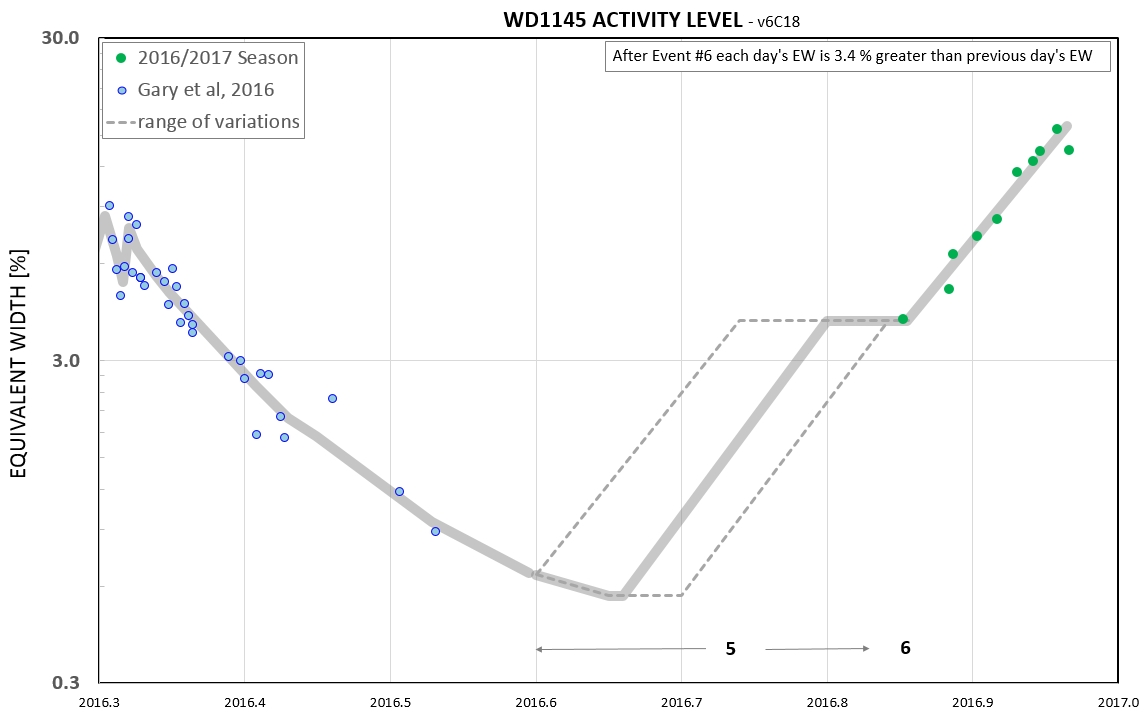
This detail of the gap between observing seasons is fitted with a two-step rise pattern, suggested by details of dip groups in light curves from 2016 November and December. The date for the first rise (Evvent #5) is uncertain, but its shown here to be late August. The second rise (Event #6, starting 2016 Nov 19) exhibits a uniform rate of increase of ~ 4% per day that has persisted for 5 weeks so far.
If only the pro's had asked for our help 1.5 years ago! We could have provided high density observations during 2015, like we did one observing season later. Apparently they didn't think we had the capability! Now they know, so maybe they'll welcome our help next year.
Some "new physics" is being stimulated by this star system. WD1145 may become the "Rosetta Stone" for understanding the relationship between white dwarfs and their left-over solar system. Here are some things about WD1145 that remain to be figured out: 1) How did planetesimals migrate to smaller orbits, 2) does the Hill sphere for the closest planetesimal play a role in forcing mass loss (fragment breakaways), 3) what mechanisms are responsible for quasi-continuous dust production (many possibilities), 4) what's the location and dimension of the debris disk, 5) is any of the debris disk optically thick, or is all of it optically thin, 6) was the 2015/16 25-fold rise in activity caused by a fragment colliding with the A-asteroid, 7) what is the mechanism for inward movement of some dust (larger size dust?) for infall to the WD atmosphere, 8) what is the mechanism for outward motion (if it exists) for populating the debris disk, 9) what's the explanation for the large (250 km/s) range of velocities in the line-of-sight for spectroscopic metal absorption lines, 10) what's the size distribution of dust particles (vs location) in the debris disk (are they all ~ 2 micron in radius?), 11) do the dust clouds never cause more than 60% loss of WD light because opaque region never covers > 60% of WD disk, or is it due to dust covering all of WD disk but has optical thickness of only ~ 0.8 tau, 12) what fraction of WDs are like WD1145 in having asteroids undergoing disintegration (we think it's the same as the 25% to 50% that have metal absorption line "pollution"), 13) what's the fraction of time that this WD (and those like it) are in the heightened activity state (due to collisions of the asteroid with one of its fragments), etc.
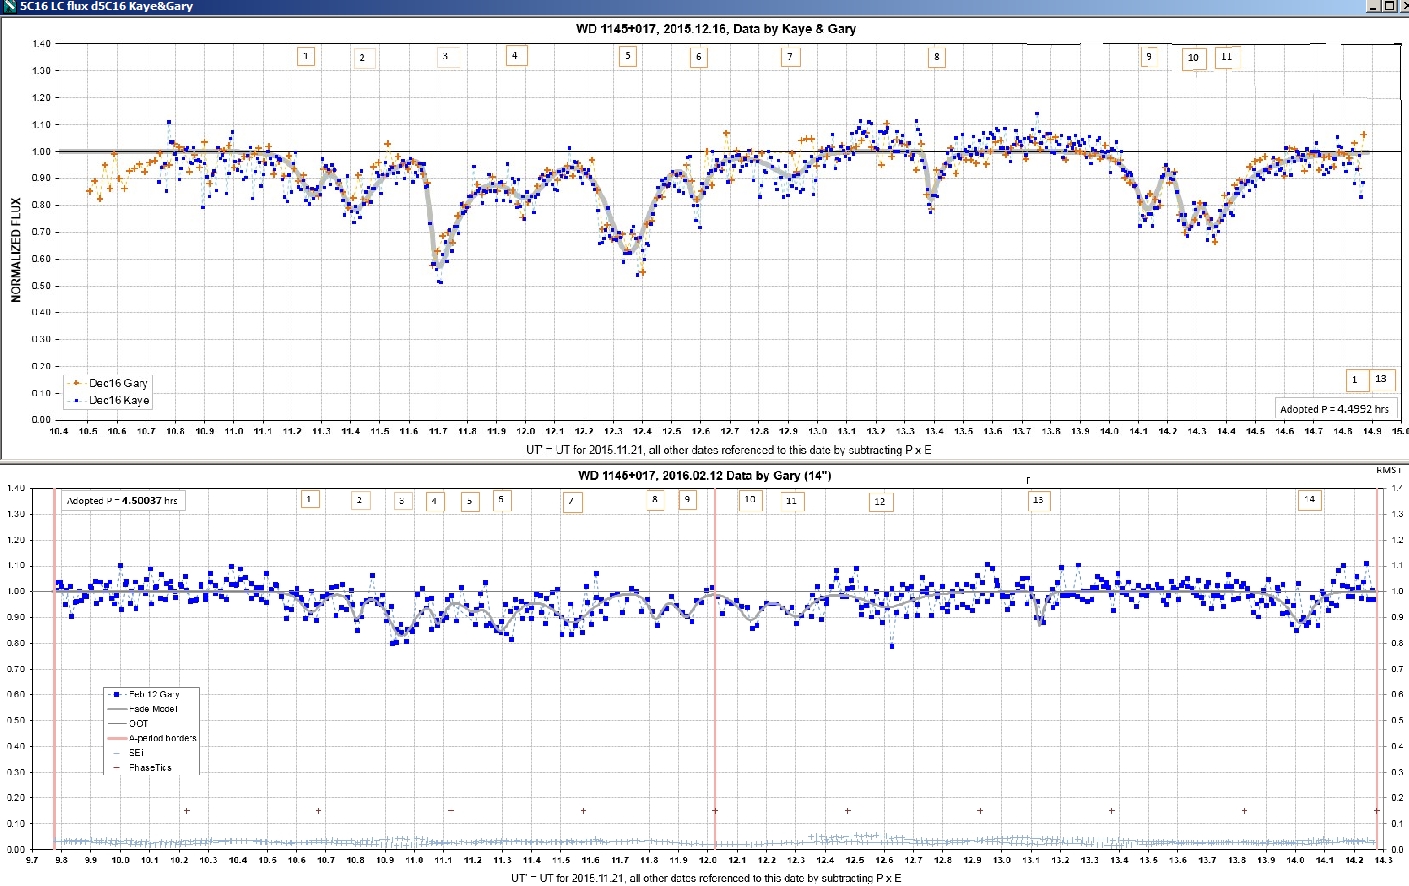
Here's an example of two amateur observers obtaining the same, identical light curve, illustrating the feasibility of a 14" telescope for this observing task:
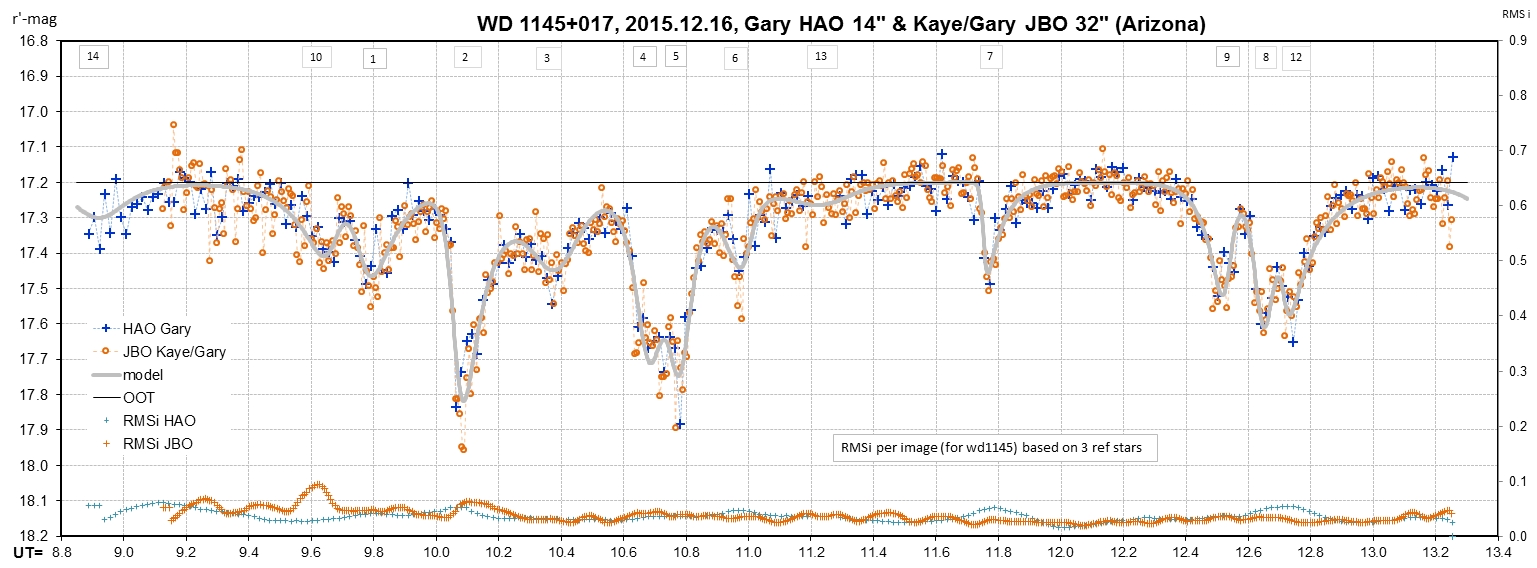
Light curves spanning a complete dust cloud orbit of 4.5 hours, that show the same 13 dip features. The noise levels are the same because the larger telescope used shorter exposures (15-sec v.s 60-sec).
The light curve, above, illustrates that during high activity WD1145 is undergoing dips fades most of the time; the fade level is "out-of-transit" for only 0.5 hour out of a 4.5 hour orbit.
Here's a sampling of light curves, one day apart, showing normalized flux vs. orbit phase (using the A-fragment ephemeris for computing phase):
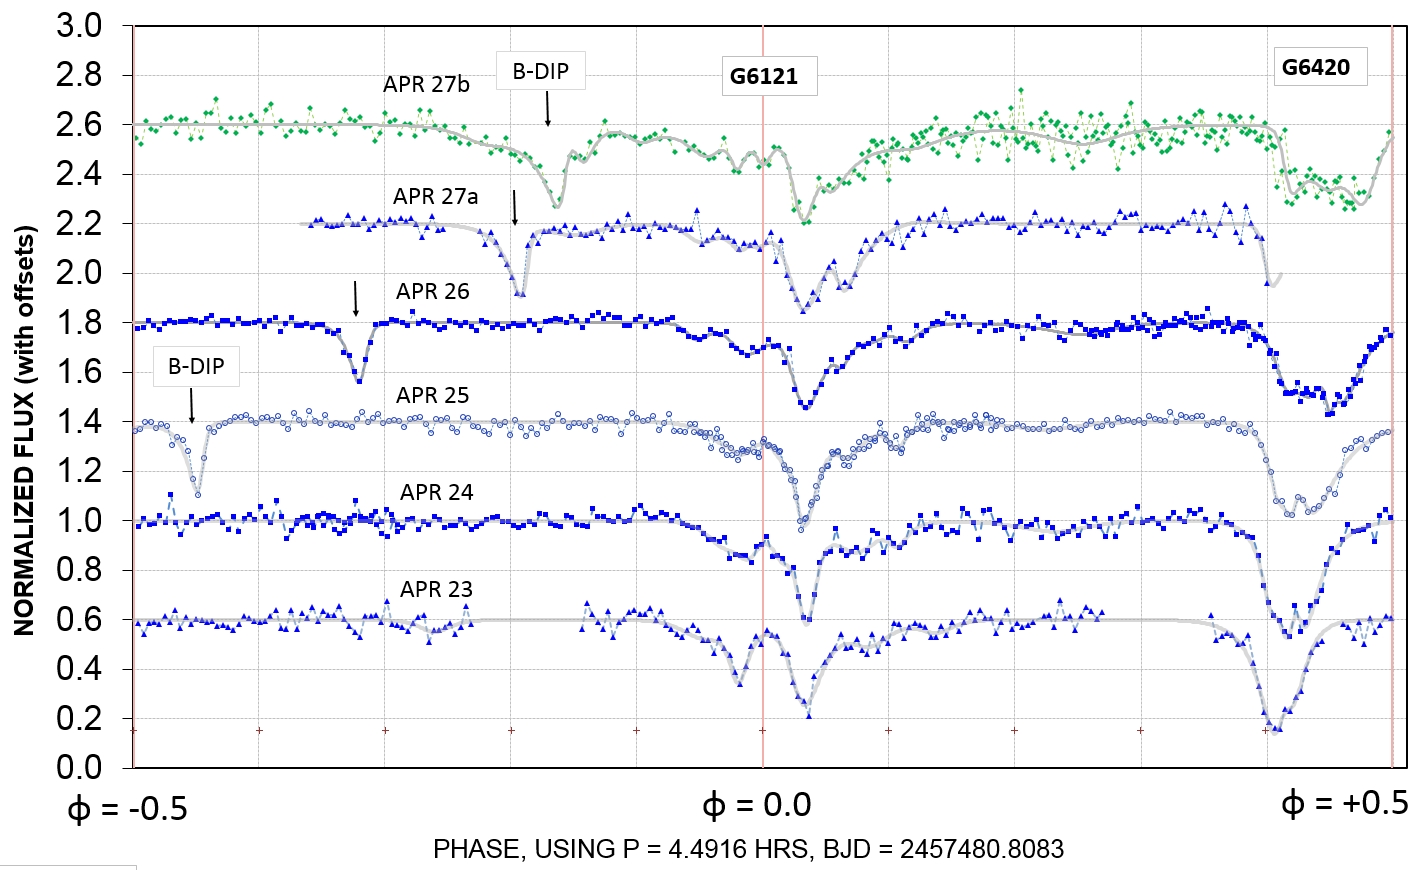
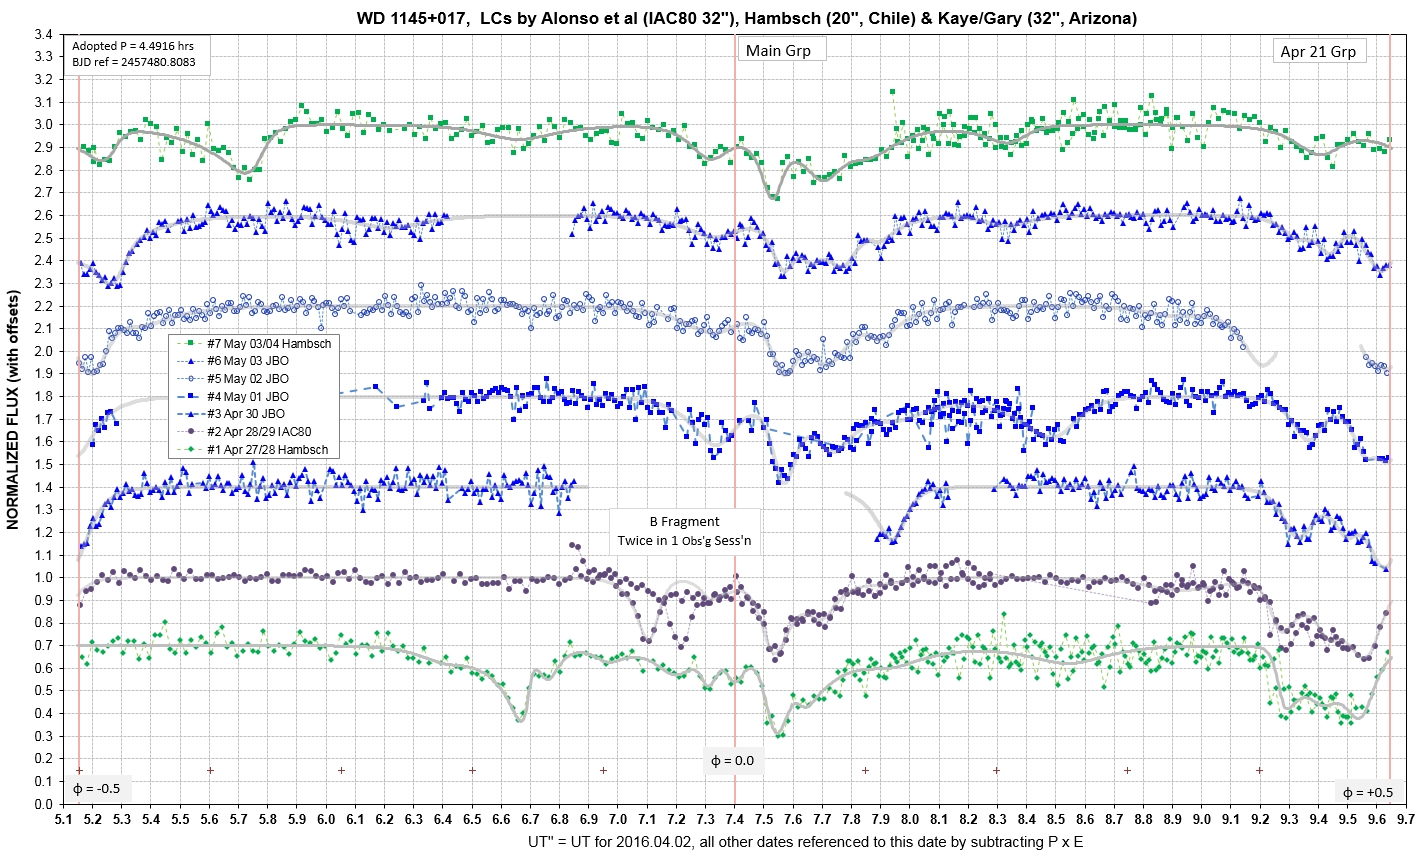
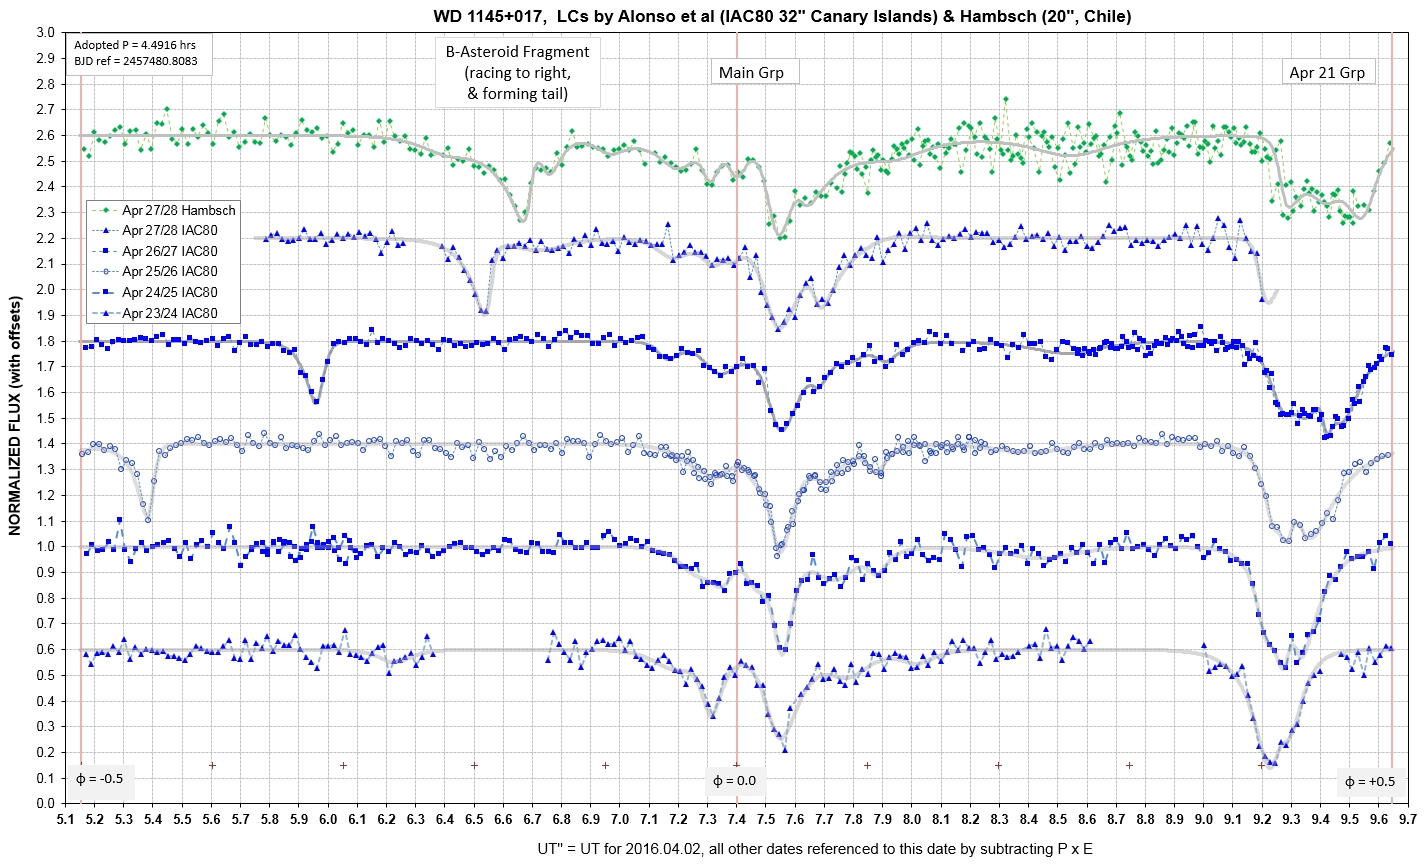
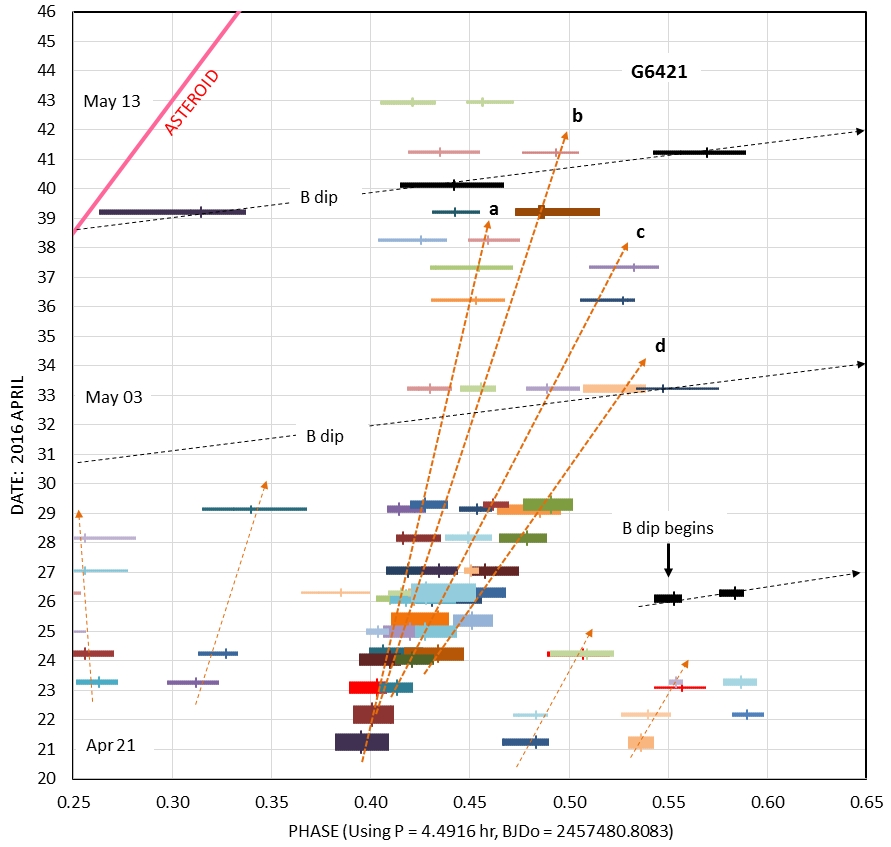
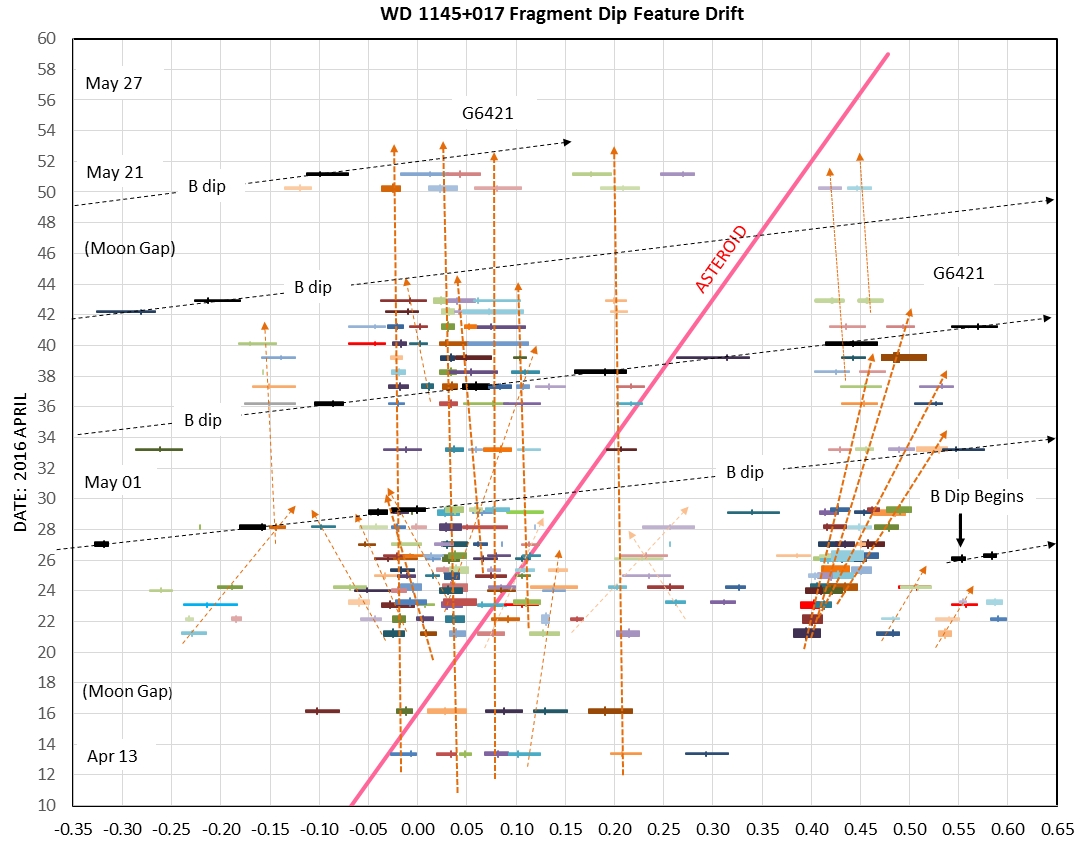
Day-to-day similarity, and slow evolution, of the fade features are apparent in this series of light curves spanning a 5-day interval in 2016 April. Phase is defined using an ephemeris that keeps fragments at the same phase. The group of fade features near zero phase first appeared on approximately 2016 Jan 21 (hence the name G6121); they change slightly on a daily basis. The group of fade features on the right first appeared on 2016 Apr 20 (hence their name G6420); they are shifting slowly to the right as they also change shape. The new feature called "B-dip" first appeared on 2016 Apr 25 (3rd light curve from the bottom), and it drifted fast to the right each day. It is associated with an asteroid in a larger orbit than the other fade features. (The first 5 light curves were made by professional observer Roi Alonso, using a 32" telescope on the Canary Islands, IAC80. The last light curve was made by amateur observer Josch Hambsch, using his remotely operated 20" telescope in Chile and controlled from Belgium.)
Here's a sampling of light curves, one per month (using the same ephemeris for computing phase):
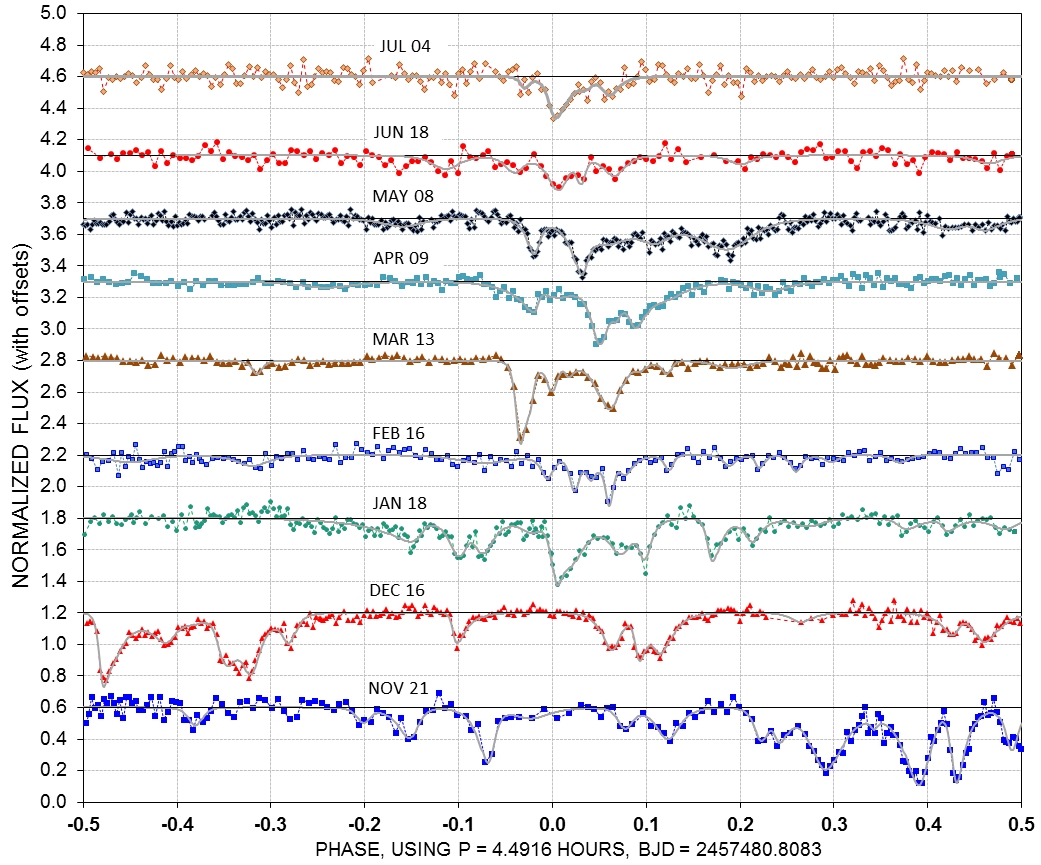
Monthly sample of phased light curves using the “A-fragment ephemeris.” All observations shown were made by amateurs using backyard observatories (six were made with my 14” Meade telescope, one is a combination of data from my 14” and a 16” telescope, and two are combined data from 14” and 32” telescopes). Notice that from month-to-month the light curves change so much that there's almost no resemblance; no individual fade retains it's phase location on month timescales.
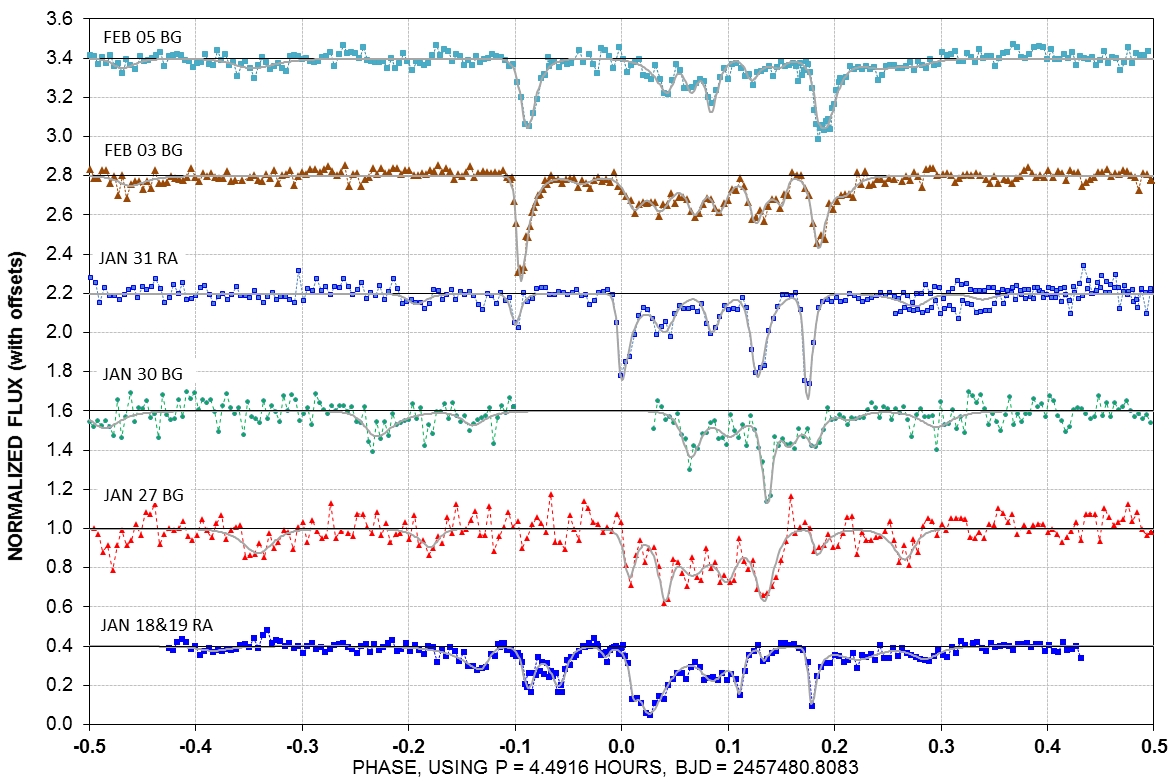
The first light curve of the 2015/16 observing season was made November 01, 2015. By mid-November it was apparent that dip activity was much higher than expected, based on Kepler K2 data, and follow-up ground-based observations conducted by professional astronomers up to June, 2015. Starting in January most dips are found at the same phase. Whereas the day-to-day light curve structures are similar, allowing identification of the same dip in each light curve (which enables drift direction and rate to be measured), on monthly timescales dip structure is poorly correlated because dust clouds evolve on a shorter timescales.
Take Home Messages
1) WD1145 has the farthest known asteroid to have been studied.
2) It is common for white dwarfs to be surrounded by hundreds, maybe thousands, of fragments that have broken away from planets and asteroids that are orbiting too close to the white dwarf. Whereas most fragments are inactive due to an infrequent collision rate, when a fragment does collide with another the pieces will have fresh surfaces for continuous dust production, causing dust clouds to be present for days, weeks or months. When a fragment collides with the "mother ship" asteroid, a dramatic increase in activity occurs, that may last an entire year.
3) About 1/3 of all white dwarfs show evidence for dust falling into their atmospheres. This can be interpreted in two extreme ways, with the truth falling somewhere in between: either 1/3 of white dwarfs spend all their time undergoing dust inflow, or all white dwarfs spend 1/3 of their time with dust inflow. Whichever, we are left with the inescapable finding that it may be common for white dwarfs to spend either some or all of their entire lifetimes with planets and asteroids orbiting so close that they are disintegrating and converting their mass to dust, some of which makes its way to the white dwarf. Our sun, like all stars of similar mass, will become a white dwarf ~ 5 billion years from now, and it will remain a white dwarf for tens of billions of years. This is equivalent to stating that most of our solar system's existence will be spent as a white dwarf that is pulling planetary bodies inward to orbits where they will disintegrate. In other words, WD1145 is showing us what our solar system will be like for most of its existence!
4) Our sun will become a white dwarf in ~ 5 billion years, and some of our solar system planets and asteroids will have orbits that shrink into close proximity to our white dwarf sun. Our solar system is destined to "turn to dust" during the ensuing billions of years, producing intermittent clouds of dust that block the light of our tiny blue sun, as seen by some imaginary, far-off observer using telescopes like those that this amateur observing group has used. Indeed, it is theoretically possible that the material of Earth, and the substance of our now living bodies, will contribute to those fades viewed from afar, in the distant future.
Do you want a longer, and more detailed explanation of my view of what's going on with WD1145? Try this PDF link.
About 600 years ago a white dwarf star, almost as massive as the sun and slightly larger than the Earth, succeeded in bringing a planet into an orbit close enough for the planet to begin to disintegrate. Some of the dust from that disintegration is ending up in the star’s atmosphere, which is why we call it a zombie star. The planet must be in a shrinking orbit, losing mass as it comes closer to the white dwarf. It is now smaller than our biggest asteroid, Ceres, so we refer to it as an asteroid. We think that fragments of the asteroid are breaking away and orbiting slightly inside the asteroid’s orbit, and that they are producing dust clouds whenever they bump into each other. When these dust clouds orbit in front of the star they obscure some of the light and we see a brightness fade lasting for tens of minutes, typically. The fade pattern repeats every 4.5 hours, with small changes, so this must be the orbit period for the fragment dust clouds. The light of this star is just now reaching Earth, so as far as we're concerned these mysterious events are happening right now - and we're witnessing the behavior of the farthest away asteroid ever studied.
Kepler K2 data revealed the unusual fades of the star 2 years ago (Vanderburg et al, 2015). As soon as it was announced to the public (October, 2015) I began observing it to see if I could detect those 1% to 2% Kepler fades. The star is faint, and very blue, and last November it could only be observed a couple hours before sunrise. But, yes, I observed it with my amateur 14” telescope, and I found those fade events caused by transiting dust clouds. Lots of transits, and deep ones. This was unexpected, because professionals had used big telescopes half a year earlier to see what was going on, and not much was. But as luck would have it this star system “came alive” after the pro's, just in time for me. What a lucky coincidence! That is what I now refer to as Surprise #1.
The transits I observed were ~ 25 times more "active" (defined below) than what the pro's observed. I recruited other amateurs to join in the fun; Jerry, Tom and Paul joined me in November. Professional astronomer Saul encouraged our observing, and by January we had sufficient new information about the high level of activity from just our amateur observations that we wrote a paper and submitted it to an astronomy journal, MNRAS (now available at arXiv: link). Saul had the clever idea that the asteroid was so close to the star that its "Hill sphere" had shrunk to the size of the asteroid, which "put the squeeze" on it, leading to mass loss (and a shrinkage in size as its orbit brought it closer to the WD star). The Hill sphere can be thought of approximately as the surface where gravity from the star is just as strong as from the asteroid. If the Hill sphere has become the size of the asteroid, according to our conjecture, a fragment on the asteroid surface could just float away and go into orbit around the star. What a wierd solar system! But for me the most compelling take-home message is that this solar system is a foretell of ours, because in 5 billion years our sun will become a white dwarf, and begin to devour our solar system of planets using the same physics that we're now trying to figure out for this white dwarf, WD1145.
A reviewer of our paper asked why one of our “waterfall plots” (fade event versus orbit phase, plotted versus date) showed a pattern of lines that drifted away from some earlier date. Tom suggested that this was because the date these lines converged to was the date of the big increase in activity. We both viewed that date as a collision between a fragment and the asteroid. We still believe that, and the date is sometime in early September, 2015.
After our paper was done, I intended to relax, and rest my weary heart that a cardiologist suggested needed rest. But I had to know what this fickle star system was doing, because it had a history of changing every day and producing surprises. So one beautiful, starry night I sneaked out to my backyard observatory, unlocked it, and quietly resumed observing – night after night. I had the thought that professionals might want to know what it was doing for their planning of expensive observations with professional telescopes. I created a web page with almost daily updates (link). My Arizona skies were clear almost every night, so I was producing updates almost daily.
By March I saw that a big change had happened in mid-January: lots of fragments had broken away from the asteroid on that date, and coincidentally there were no more single fragments breaking away. That was Surprise #2. Because of that surprise I again recruited more observers to join in the fun: Tom, Yenal, Paul, Josch and Roi (the only professional in our group). On April 21 a new big fade appeared, and a few days later it was apparent that this was a group of 3 or 4 fragments that had been created by a collision (between two fragments) on Apr 20, and the pieces were moving away from each other. That was Surprise #3, which supported our idea that backward projection of drift lines could be used to infer a collision date (like the more dramatic fragment/asteroid collision in September). A few days later, on Apr 26, I saw Surprise #4: a new fade appeared that was deep and only a few minutes in duration (I later learned that it actually showed up a few hours earlier in Roi's observations, using a telescope on the Canary Islands). The amazing thing about this fade is that it had a significantly longer orbit period than the others. In fact, it had a period that was exactly the same as the Kepler “B period.” The people analyzing Kepler data found 6 periodicities, which they named A through F. They weren’t completely convinced that these 6 periodicities were real, corresponding to 6 actual asteroids. So Surprise #4 was confirmation that B was real, which implied that the other asteroids are also real.
The "observing season" for this star has ended, so we wrote a second paper. Saul persuaded me to take the lead with this one, which made sense because essentially all the observations of the past 8 months were those that either I made or had arranged to be made by recruiting others. I also processed every observer’s data to a format for display in the same way (a phase-folded light curve), which made my further analysis easier. This second WD1145 paper was submitted to MNRAS (Jul 21) and is currently under review. It is available as an arXiv posting: link
For an easy-to-read description of what's going on with this star system go to the next section ("What's Going On?").
The manner in which dust clouds migrate outward (by small distances) to form a debris disk of dust, and inward toward the WD to form a gas disk, are the subject of continued speculation and modeling analysis. The inward migration involves the breakup of dust particles to constituent atoms, which form an inner "circumstellar" disk of atoms (extending from 10 to 64 WD radii, as suggested by Redfield et al., 2016). This inner disk is a gas, not dust. Gas closer than some distance (such as 10 WD radii) may be captured by the star's magnetosphere and brought to the star's surface. The outer debris disk (pictured above, from 94 to ~ 150 WD radii) consists of dust particles. Both the inner gas disk and the outer debris disk change slowly, whereas their source, dust clouds (at 94 WD radii), can change abruptly.
Since dust clouds should disperse on timescales of a few days there must be a component of continual dust production. The mechanism for dust production is also the subject of much speculation, and will be the subject of future publications by modelers. I'm not a modeler, but I have suggested the following mechanisms:
1) Continual micro-meteoroid bombardment of the fragments by previously released and dispersed dust clouds.
2) Heating of fragment surfaces that are favorably oriented (facing the WD star for part of each orbit), causing surface temperature to rise to 1700 K (or ~ 1850 K within craterlet bottoms), causing melting of minerals.
3) Spinning of fragments that is fast enough for centrifugal forces to move molten material to the edges where it is thrown off to form a dust cloud.
In addition to some mechanism for continual dust production, collisions of fragments with other fragments should produce sudden increases of dust cloud density and size. There may be hundreds, or even thousands of fragments, and it's only after a collision between them that they "come alive" for a few days, weeks or months. The most interesting collision possibility is of a fragment with the asteroid! The dramatic increase in fade activity that occurred about a year ago (sometime between 2015 June and October) must have been produced by such a fragment/asteroid collision.
WD 1145+017 Basic Info
RA/DE = 11:48:33.59 +01:28:59.3 (J2000)
Type: white dwarf, atmosphere mostly Helium (unionized He absorption lines, only a couple H lines), metal absorption lines present, Teff = 15,900 K
V-mag = 17.25, B-V = -0.08, r'-mag = 17.5
IR excess seen in WISE Ch#1 & 2 (3.4 and 4.6 micron wavelength): T_brightness = 1145 K, solid angle = 116 x WD disk
WD distance from Earth ~ 174 pc (570 lt. yrs)
WD star diameter ~ 1.34 × Earth. WD star mass ~ 0.6 × sun. WD star density ~ 4 x 10⁵ [gm/cm3]
WD asteroid A (and its fragments) orbit radius ~ 0.00541 a.u. (1.16 × our sun's radius, 94 × WD1145 radius). Apparent size of WD star as viewed from A-asteroid (& fragments) = 1.26 degrees (diameter).
A-asteroid orbital period = 4.500 hours, mass ~ 0.12 × Ceres mass; diameter ~ 450 to 600 km. Asteroid orbital velocity ~ 315 km/sec.
A-fragment diameter typically a few km, mass ~ 1021 to 1022 [gram]. Orbital period of fragments = 4.4912 hours (with some variation)
A-fragment dust cloud size large enough to cover ~ 60% of WD star; elongated (mostly in trailing direction), width perpendicular to orbit plane comparable to WD star diameter.
A-fragment dust production lifetime = from weeks to several months. Dust production is of two types: abrupt (collisions) and quasi-continuous (many theories).
Dust "loss" is due to "radial shear" due to dust distribution in different orbits. Dust migration is inward (to WD star) and outward (to debris disk) by mechanisms not yet understood.
Tilt of orbits of asteroids A through F (and their fragments) estimated to be 89.5 degrees, i.e., our view is only 0.5 degree from being edge-on.
Ephemeris for A-asteroid: Phase = Y - int(Y), where Y = (BJD - 2457347.99603) / (4.50037 / 24), as described in Rappaport et al 2016 (ref. at bottom of this page). This keeps the presumed A asteroid at phase ~ +0.12.
Ephemeris for A-fragments: Phase = Y - int(Y), where Y = (BJD - 2457480.8083) / (4.4916 / 24). This keeps the G6121 group of dips at close to phase zero.
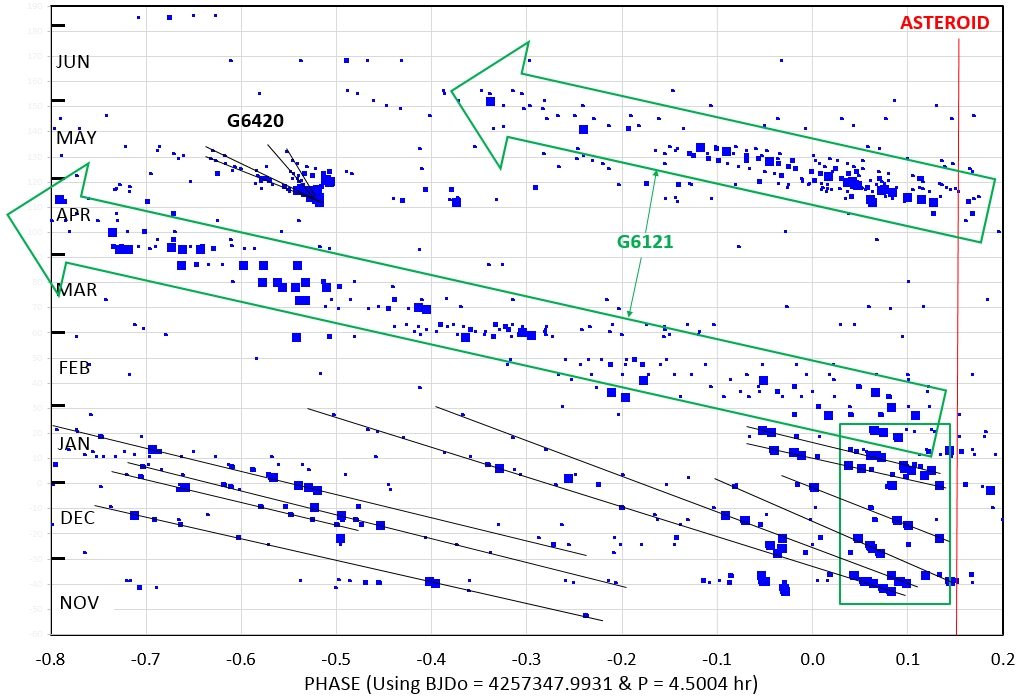
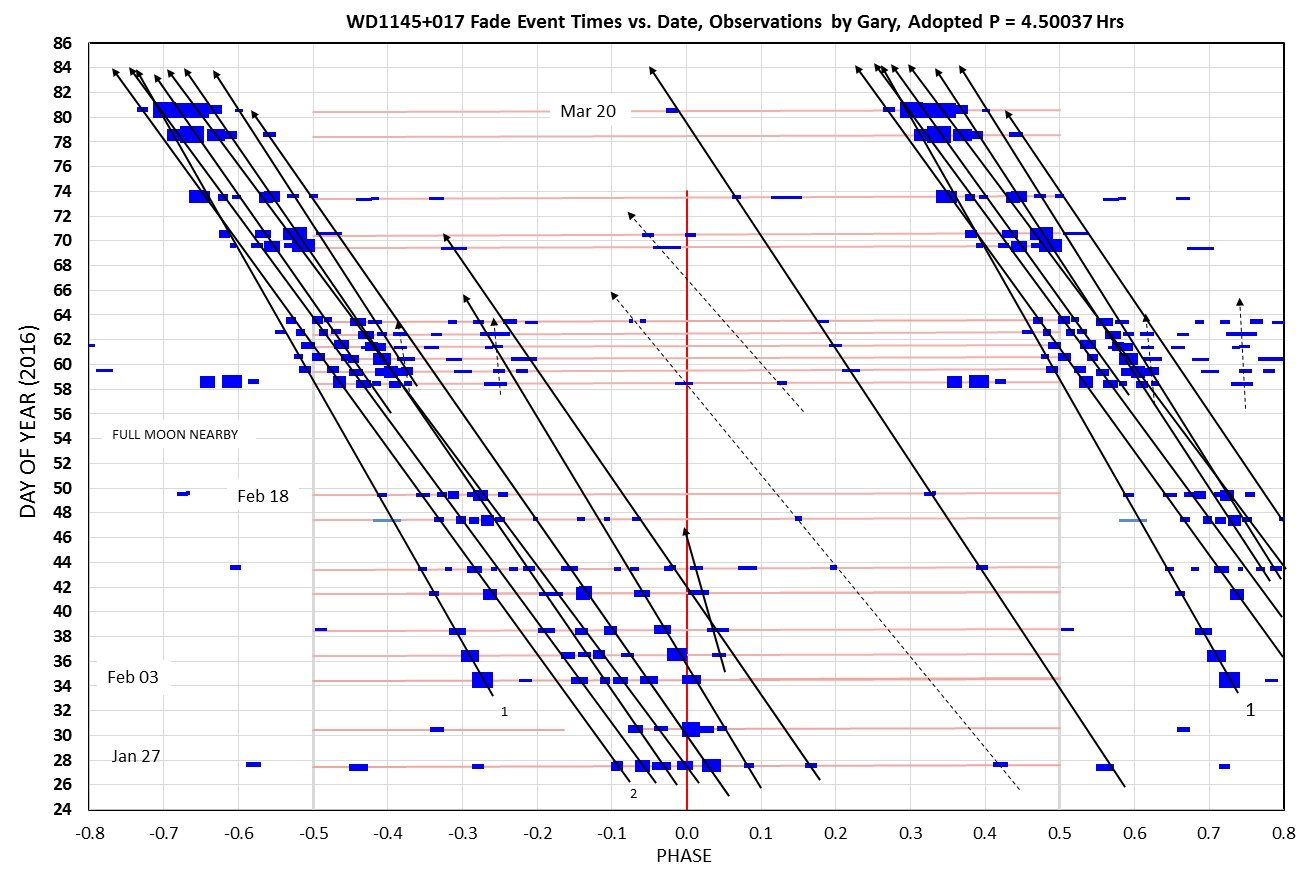
Waterfall Plot Overview
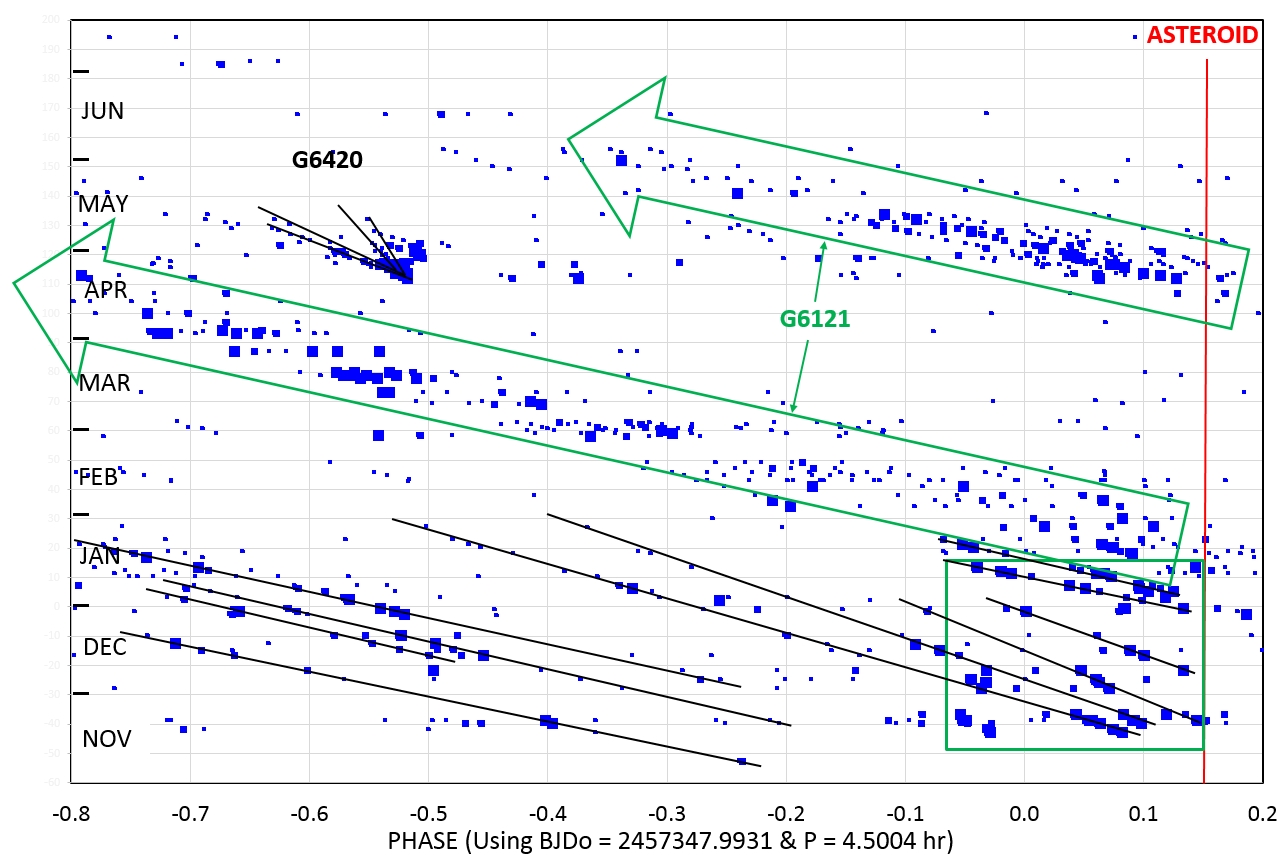
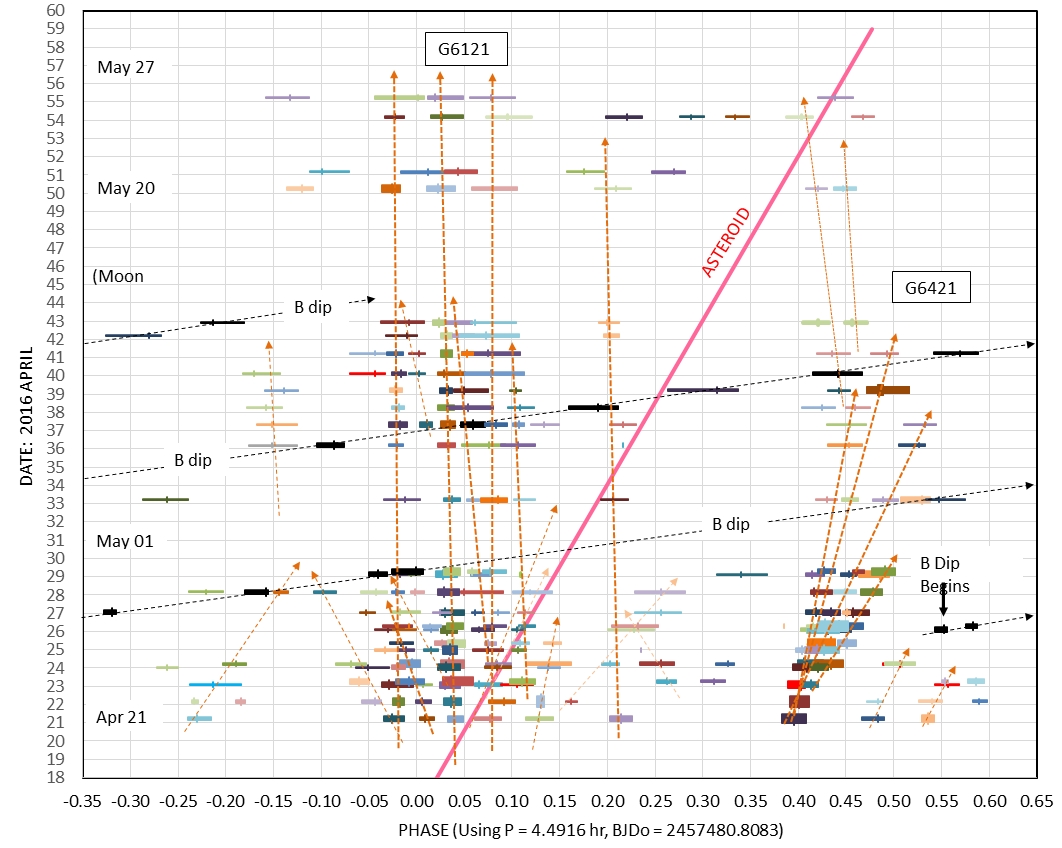
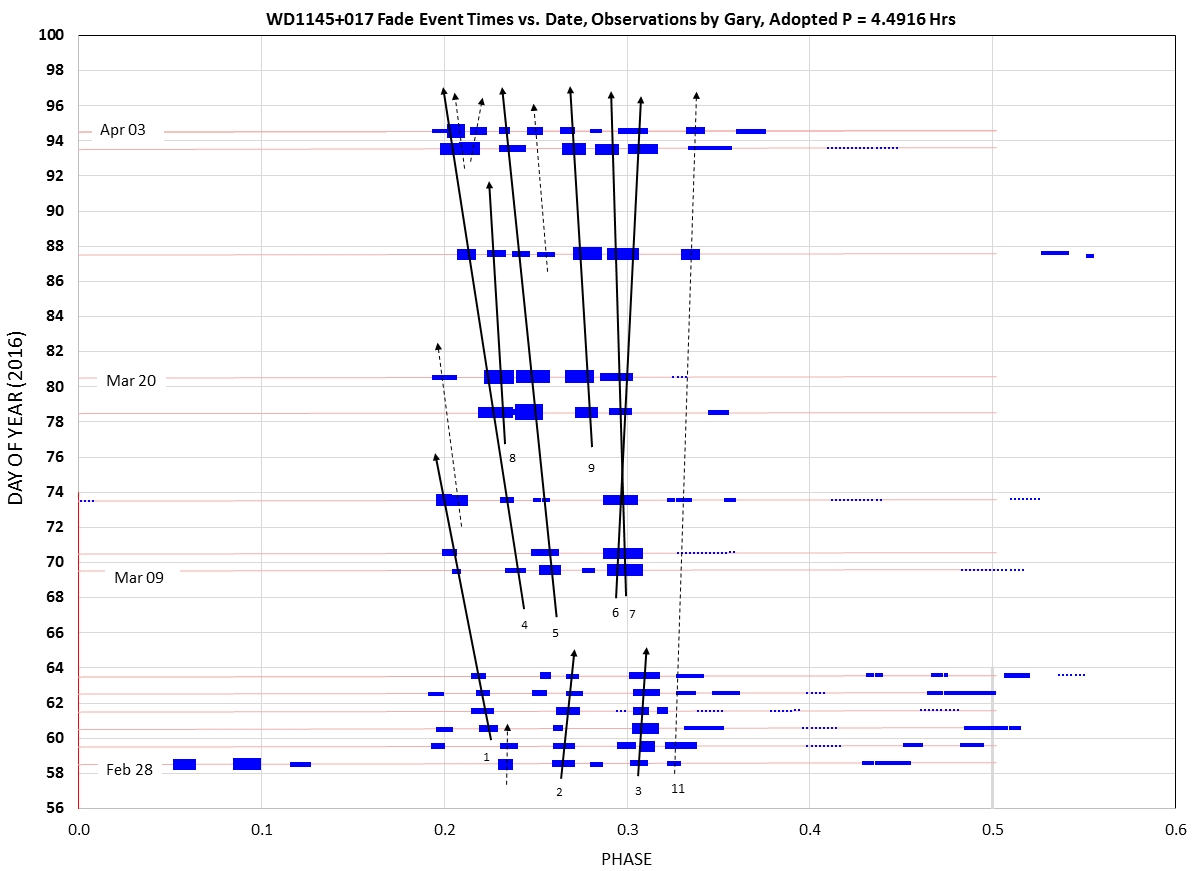
During November and December most dips occurred at a phase that we now assign to fragments that broke off the asteroid and were active in producing dust clouds for no more than about 2 or 3 weeks. During that time because they were in smaller orbits than the asteroid they drifted to earlier phases (i.e., they appeared earlier than on previous days). The phase shift during their 2 or 3 week of activity was limited to about 0.2 phase units (20% of the asteroid's orbit). This is shown by the green box adjoining the red asteroid crossing time line. A few fragments were long-lived in their activity, as seen on the left (during November and December). In late January, something dramatic changed: a large group of fragments broke away and began a long-lived drift to the upper-left along a "corridor," and fragment creation abruptly stopped. The corridor group (labeled "G6121") lasted for about 4 months, and starting in late May the fragment dust clouds began a slow decline. By mid-July they had all essentially disappeared.
Do the dips within the G6121 corridor consist of long-lived drift lines? To answer this we need to change the waterfall plot in a way that shows drift lines better, and for the first two months of the corridor.
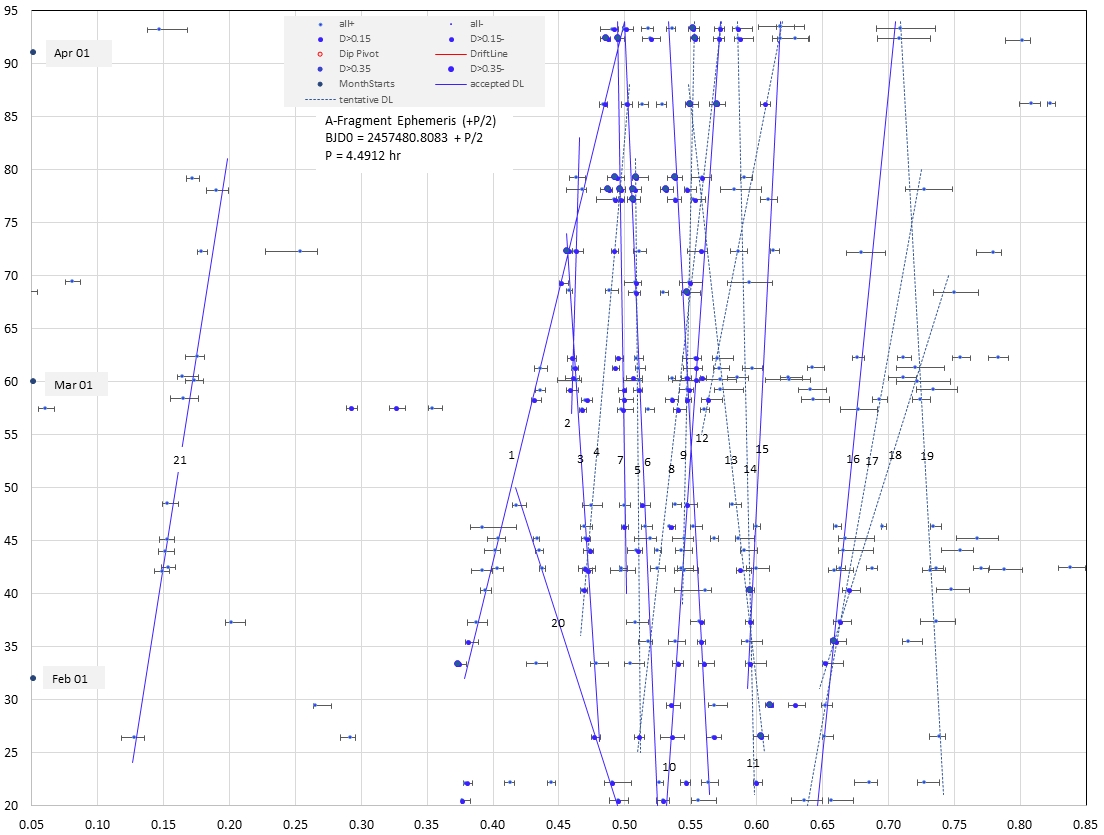
This is a detailed waterfall plot using an ephemeris with the fragment period. It's like rotating the previous waterfall clockwise until drift lines are vertical. The date coverage is only a couple months, and it starts from the transition date in late January. The Y-axis is labeled in "day of year," beginning (at the bottom) with January 20, and ending (at the top) with April 02. The phase coverage is for the most active 80% of an orbit. The symbols with bars depict dip features. The bars indicate ingress and egress times (actually ~ 1/2 the length of those times). There are 21 "drift lines" that are either solid (believable) or dotted (suggestive). Some dips last the entire 2.4-month interval shown, and others last only 2 or 3 weeks. Dip depth varies with date for each drift line, and sometimes dip duration (ingress plus egress times) also varies. Studies of dip property versus time are just beginning.
Orbit Diagrams
Diagrams of fragment and A-asteroid location in their orbits were being produced on an almost daily basis during some of the 8 months of observing by our team. We were hoping to see changes in "drift lines" as fragments passed (i.e., lapped) their "mother ship" asteroid. Such changes may have been seen, but the light curves produced from our telescopes didn't have sufficient SNR to be sure of these drift line changes. This should be a goal for future observing seasons.
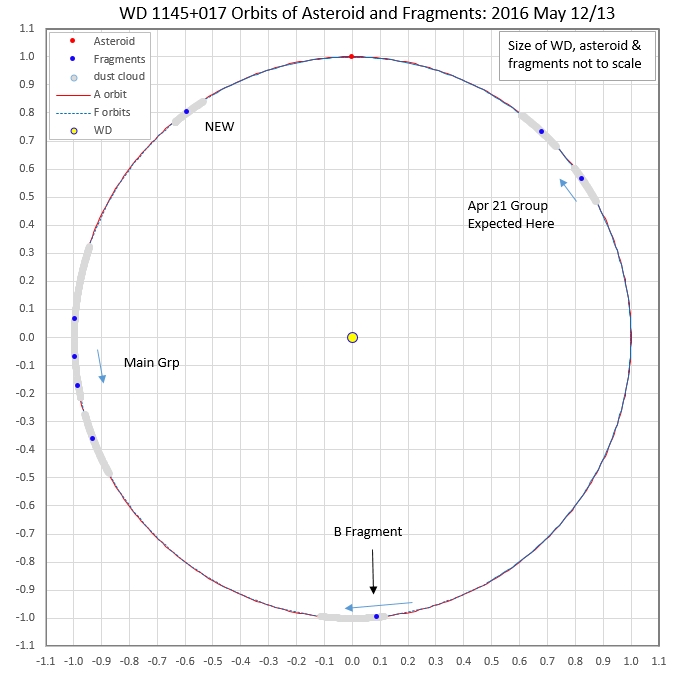
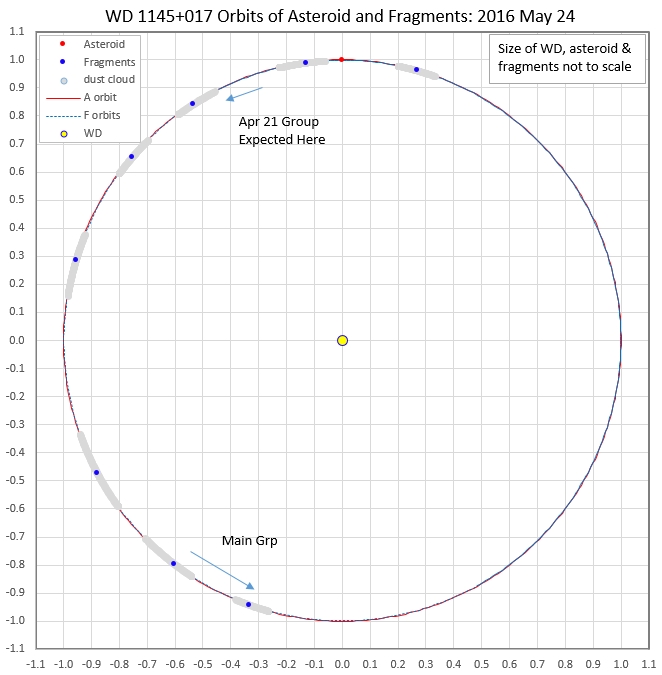
Illustration of a group of fragments (blue symbols) that are actively producing dust clouds (gray bands), that have caught up and overtaken (i.e.,"lapped") their source, the asteroid (red symbol). The two panels are 12 days apart (based on actual observations). Since this coordinate system is rotationally fixed to the asteroid the Earth can be imagined being at the end of a line that rotates clockwise. The size of the white dwarf is actually ~ 1/2 of that shown (i.e., WD diameter ~ 1% of the asteroid orbit diameter).
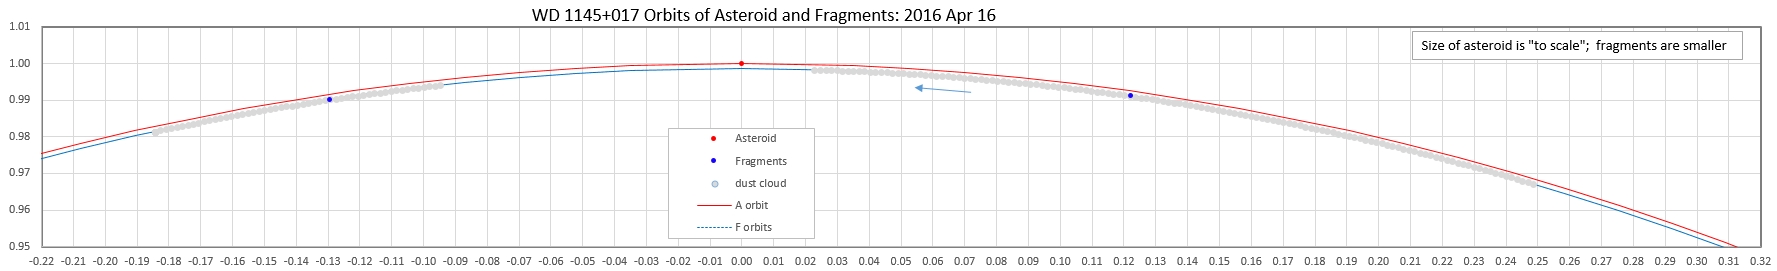
This is an attempt to show the actual distance separating the asteroid orbit from the orbits of the fragments. The diameter of the asteroid is "to scale", or 1/2 the average separation of the orbits.
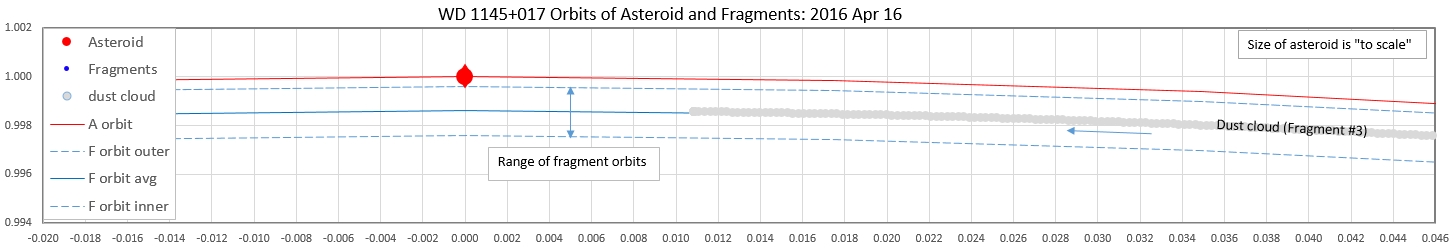
Larger zoom, showing the asteroid (true to scale) in relation to the range of fragment orbits. We expect a uniform distribution of orbit distances within the "range of fragment orbits." Approximately 25% of them will be close enough to the asteroid to produce noticeable orbit changes (Petit & Henon, 1986 and Rappaport, private communication). The closest approaches will produce an exchange of energy from the asteroid to the fragment, thus slowing the asteroid by a small amount (decreasing its orbit size slightly) but speeding up the fragment by a significant amount (and increasing its orbit size). An estimated 10% of fragment orbit sizes will be increased to larger than the asteroid's orbit, leading to a "horseshoe" shape in the asteroid-fixed coordinate system. All of the 25% of fragment orbit changes should be detectable from the abrupt change in drift rate. Such encounters, repeated many times, will cause the asteroid's orbit to shrink over time. This will lead to a smaller Hill sphere, which will increase the gravitational gradient squeeze on the asteroid, and produce a new episode of fragment creation. Another cause for renewed fragment creation will be due to the asteroid's shrinking orbit, where it will encounter old (dead) fragments that will impact the asteroid and start a new phase of fresh fragment activity. In this manner the asteroid will eventually undergo complete disintegration.
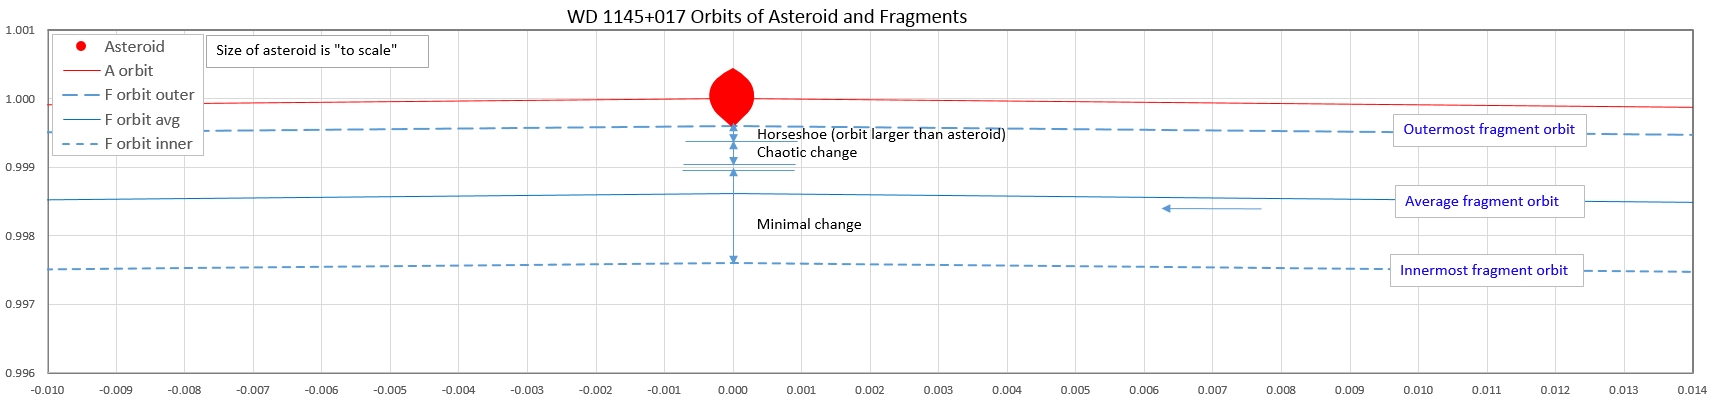
Detail of fragment orbit regions in relation to their closest approach to asteroid. Three basic regions are described by Petit & Henan (1986), based on closest approach distance, d: 1) Rh < d < 1.7 Rh, where fragment ends up in orbit larger than the asteroid's orbit ("horseshoe"), 2) 1.7 Rh < d < 2.6 Rh, chaotic orbits (some leading to impact with asteroid), and 3) 2.9 Rh < d < 7 Rh, minimal change in orbit. The "horseshoe" orbit gets its name from the path of the fragment in asteroid rotation fixed coordinates; in non-rotating coordinates the changed orbit is simply an ellipse with periastron at the closest approach location and apoastron at a distance farther from the WD than the asteroid. The way such an orbit change occurs is simply understood in terms of how much time the fragment spends approaching the asteroid at one speed versus how much time it spends receding from the asteroid at a greater speed. Since the latter is shorter, there's a net increase in speed due to the approach. In other words, the fragment gains energy as the asteroid loses the same amount of energy. The fragment's change is observational noticeable after one pass, whereas the asteroid's tiny orbit shrinkage is not noticeable until after many such fragment passes.
_________________________________________________________________________________________________________________________________________________
The rest of this web page is leftover from the role it played in keeping the observing team informed of what our observations were showing. Casual raders may disregard it.
K2 Simulated LCs
This is a sampling of graphs showing our ground-based light curves smoothed with a 30-minute box function that results in a simulation of what the Kepler spacecraft would have observed in its 30-minute cadence observing mode.
Traditional Abstract
WD 1145+017 (hereafter WD1145) is going to be the prototype for a new category of variable star. These will be white dwarf stars with asteroid-size planetesimals orbiting so close to the star that the strong gravitational gradient is "putting the squeeze" on the asteroid (i.e., with the asteroid's "Hill sphere" shrinking to the size of the asteroid). WD1145 is a white dwarf star about the size of Earth, with a mass of 0.6 times the sun, being orbited by an asteroid every 4.5 hours with an orbit radius of 0.0054 a.u.. This is close enough for fragments to break off the side facing the star (the L1 point), and enter orbits slightly smaller than the asteroid. These fragments then produce dust clouds that obscure the star when they orbit in front of it, causing brief star fades similar to exoplanet transits. Since last November WD1145 has had at least a dozen such fragments with a variable production/destruction of dust such that during each 4.5-hour orbit there are about a dozen fade events that are deep enough for amateur observers to measure (i.e., up to 60% fade, or ~ 1 mag). These fade events last ~5 minutes, typically, and their depth and shape change slightly with each orbit.
In addition to these daily dynamics there are
month timescale changes, and also year timescale
ones. For example, Kepler's mid-2014 discovery
observations occurred during a "quiet phase," and
ground-based follow-up observations by professional
astronomers 8 months later showed that the quiet
phase consisted of brief fade events that could be
as deep as 40%. Later, in the summer of 2015, a
collision must have occurred that caused many new
fragments to break off the asteroid and enter
slightly smaller orbits (via the L1 path), and these
caused an increase in fade activity (as I discovered
last November). The fade activity reached a peak in
2015 December, being ~ 15 times greater than during
the Kepler K2 discovery observations. Our amateur
observations have shown that we are now in a
decreasing activity phase, perhaps leading to the
same quiet phase that existed during the K2
observations 1.7 years ago.
Another collision could produce a new outburst of
active fades, and this could happen at any time;
sampling theory suggests that such activity
outbursts could occur at several-year intervals. To
monitor this using professional telescopes would be
prohibitively expensive, and since it is easily
monitored with amateur telescopes I urge all
amateurs (with exoplanet transit experience), and
with telescopes at least as large as 11" aperture,
to consider monitoring this star on a regular basis
(similar to the way AAVSO observers are monitoring
KIC 8462852 in hopes of discovering another big fade
event). AAVSO expressed interest in accepting light
curve data submissions for WD1145, but so far there
is no provision for this. The ETD is already ready
to accept submissions, but their new set of web
pages have not yet provided full support for
English-speaking observers. I am attempting to form
a group for semi-global coverage; I need volunteers
from longitudes in Asia. Not only will WD1145 be an
interesting star to monitor and study for many
years, it will be known as the founder star, a
prototype, for a new variable star category: "white
dwarfs with dusty transits." Large professional
survey telescopes will surely reveal the presence of
more of these stars. They will be attractive to
amateur observers and professionals alike, not only
for their daily and yearly changes, but because they
offer a glimpse of what our solar system will be
like in a few billion years. Indeed, when our sun
becomes a white dwarf it may become a WD1145 type
system with the Earth becoming an analog to the
WD1145 "asteroid." Imagine, the atoms in our bodies
may some day contribute to dusty clouds that produce
fades seen by alien observers like you and me in
that distant future time.
This web page is devoted to a photometric
monitoring of WD 1145+017 by observer Bruce L.
Gary, starting 2016.01.27 (i.e., after submission
of a paper based on earlier amateur observations).
Starting in 2016 April I recruited a few other
amateurs (the "longitude team") to contribute, so
those LCs are presented here. Another web page
with those earlier observations, from 2015.11.01
to 2016.01.21 by a team of 4 amateur observers
that I coordinated, will be converted to public
domain status after publication of our article in
MNRAS (soon). In the meantime you can view our
arXiv article here: link.
Traditional Introduction
This white dwarf star was discovered to exhibit
transit behavior, as described by Vanderburg et al
(2015) using Kepler K2 data during 2014 Jul/Aug/Sep.
K2 was limited by exposure times of 30 minutes, so
shorter fade events were greatly smoothed and it was
not known if the changing light curve amplitudes
(within the range 0 to 2%) were due to long transits
that changed depth or shorter ones that were more or
less numerous, or some combination of both. At least
the K2 observations showed a clear Lomb-Scargle
periodogram signal with a period of 4.4989(1) hours.
An attempt was made to clarify the situation using
follow-up ground-based observations with professional
telescopes during 2015 Mar/Apr/May. The results of
these ground-based observations were included in the
Vanderburg et al (2015) paper, where it was speculated
that at least one planetesimal was disintegrating and
producing thick dust clouds that transited the white
dwarf (WD). Croll et al (2015) also arranged
for ground-based follow-up observations with
professional telescopes during 2015 May. Both of these
ground-based observing projects found isolated fade
events that were short, and much deeper in depth than
seen by K2, but many basic questions remained about
what model could account for disappearing and
reappearing fades (at different times than expected
from the K2 A period). The mysterious nature of
WD1145 was made public in late 2015 October by
simultaneous postings of the two above-cited articles
at the arXiv web site. This created an opportunity for
amateurs to begin observing WD1145.
Amateurs Join the Fun
The best observing season for WD1145 is centered on
mid-March, when in 2015 the two groups of professional
astronomers used professional telescopes for follow-up
observations. In early November, when I began
observations, WD1145 could only be observed for ~ 1.5
hours and always at low elevation angles (high air
mass, especially bad for a blue star). In spite of
this handicap my first observation, on 2015 Nov 01,
showed that this 17th mag WD was feasible for
observation by amateurs with telescope apertures of
only 14". The original purpose was to help Dr. Bryce
Croll prepare for professional telescope observations
in 2016 February, which he indicated would be useful.
On Nov 8, when I measured a 0.4-mag fade event, I
began to suspect that amateurs could provide
scientifically useful observations, so I began
recruiting other amateur observers to help (starting
with Paul Benni, Nov 15, and Jerry Foote and Tom Kaye,
Nov 24). By late November it became obvious that
WD1145 was very active, and that our amateur
observations were potentially valuable by themselves.
Indirect indication of this came when we learned, in
late November, that Dr. Croll had arranged for
observations with two professional telescopes, 2.5
months ahead of his original plan. Actually, we had
more direct confirmation of the value of our
observations from frequent e-mail exchanges with
professional theoretical astronomer Dr. Saul
Rappaport, who had maintained contact with us since
October (when he suggested to me that Dr. Croll might
appreciate our help). It was Dr. Rappaport's
enthusiastic encouragement that caused our observing
efforts to go into "high gear" in mid-November. Dr.
Croll's appreciation of our observational results,
which he could monitor from a web page that I
maintained, became more apparent when he told us of
plans to present our data at the Extreme Solar Systems
III conference in Hawaii, 2015 Dec 4. He also
presented our data at the 227th Meeting of the AAS, in
Florida, 2016 Jan 4-8. After Tom Kaye and I persuaded
Dr. Rappaport that our fade events were drifting to
earlier times with respect to the K2 A-period, Dr.
Rappaport came up with a clever model involving an
asteroid-sized planetesimal that had migrated so close
that its "Hill sphere" had shrunk to the size of the
asteroid, and any fragments breaking off
(preferentially at the hot, L1 end) were free to
wander into an orbit slightly smaller than the
asteroid, and this accounted for the drifting that we
amateurs had documented. This eventually led to a
15-page manuscript that was submitted to MNRAS
(on 2016 Jan 27); it also appeared at the arXiv web
site (astro-ph.EP) on 2016.02.02: http://arxiv.org/abs/1602.00740.
Another web page has a detailed display of amateur observations from 2015.11.01 to 2016.01.21: http://www.brucegary.net/WD1145/ It was in the public domain until one of the professional astronomers on our MNRAS paper requested that it be PW protected, to prevent other professionals from knowing what we were doing. I consented, reluctantly, and when the MNRAS paper with responses to reviewer comment is finally accepted by MNRAS (probably 2016.03.07) I will place that web site back into the public domain. Until then, my observations since the last one used in the MNRAS paper are being posted at this web site, which begins with a 2016.01.27. These observations document a dramatic reduction of fade depths (i.e., dust production by a dozen or more fragments still in orbit). It now appears that something happened last August to increase activity to ~ 15 times greater than 1.7 years ago (during K2 observations), and also much greater than found using professional ground-based telescopes last Mar/Apr/May; the "activity level" peaked in early Dec, and has been declining ever since and may be on-track for returning to the K2 level of activity sometime this year.
Remaining Questions
Many questions remain about WD1145. Foremost is
whether Dr. Saul Rappaport's clever idea is right,
that the asteroid's Hill sphere has shrunk to the size
of the asteroid body, forcing it into a football shape
with the star side coinciding with the L1 location
that produces fragments that break away into orbits
corresponding to the location of the L1 distance to
the star. (Actually, due to gravitational pull during
the departure phase the fragment should end up in an
even smaller orbit than corresponding to the L1
distance.) Another question relates to the drift
lines: why don't they all have the same drift rate?
Their variance requires that the fragments have
slightly different orbit periods; could this be
explained by them having a variation of velocity
component in the for/aft direction as they leave L1?
If fragments break off from L1 in groups, can their
different drift lines be used to infer when the
break-off event occurred, by projecting their set of
drift lines backwards in time to a date when they
converge? Or do the fragments break away at random
times, not in groups but as single fragments? Do the
fade depths vary with wavelength in a way that can
provide a solution for dust size distribution? How
long can a fragment produce dust? What are the
patterns for fade depth variations, and how can these
be accounted for by variable dust production and loss
rates? How often are there episodes of increased
fragment creation and dust transiting activity? During
a 1.7-year interval we've seen one such event. Could
this have been pure luck? Do we have a correct orbital
period for the asteroid, which relies mostly upon the
3-months of K2 data (when WD1145 was inactive), and
which is only partially supported by the amateur
observations of the past 4 months? Both solutions,
using Lomb-Scargle periodograms, could be influenced
by the drift behavior of fragments and their turn-on
latency after breaking off the asteroid. During the K2
observations were there very few fragments, and only
the L1 part of the asteroid was "glowing" with dust
that stayed near L1, thus allowing for a determination
of the asteroid period? This is one way to reconcile
the absence of an A-period signal from data taken in
the last month. What about the other periodicities
derived from the K2 LS analyses? Do they correspond to
other asteroids in slightly larger orbits that only
infrequently produce fragments? Are all "dusty" WDs
destined to go through a phase of being like WD1145,
lasting until all planets and asteroids have
disintegrated by Rappaport's L1 break-away mechanism?
Presumably, each planetesimal, or asteroid, will
disintegrate when it migrates close enough to its WD
star; how long will the disintegration process last?
And are there intervals with no dusty transits between
times when a succession of asteroids migrate close
enough to begin their disintegration? How long will
this activity last? Are we simply very lucky to be
observing a rare event, or will WD1145 be active, with
the level of variability already observed, for
centuries and millennia?
How Will Pro's Use Amateur Monitoring Data?
The most important use for future monitoring
observations of WD1145 will be to know when the next
outburst of fragment creation occurs. With the
announcement of this next event (possibly later this
year, or next year, etc) an intensive program of
observations will begin with several goals in mind. We
need to determine how to make full use of the pattern
of drift lines. At this time we don't even know why
there is such a large variance of drift rates, so this
will be one of the first questions treated by the new
observations. The drift lines should converge
backwards in time to the date of the creation of the
dozen or more fragments (assuming fragments are
created in groups). The convergent point should also
allow for a determination of where the asteroid is in
terms of A-period phase. We think it is at ~ +0.10,
but this is still uncertain. This will also help in
refining the A-period, which is important for many
other goals for understanding WD1145. Documenting an
outburst of activity from its inception will permit a
determination of turn-on latency statistics. We
suspect that a newly-created fragment may not create a
dust cloud for several days, or maybe weeks. Fragments
are known to undergo reduced activity (dust
production), and these times of reduced activity can
be used to model dust destruction rate as well as
production rate variations. This information can be
used for constraining models for the dust cloud's
production and loss. The total longevity of a
fragment, coupled with its activity history, can be
used to determine fragment size. Observations are
currently underway to determine fade depth versus
wavelength, from B-band to near-IR, for the purpose of
deriving a particle size distribution (PSD). Since the
activity level is now very much lower than during the
main outburst phase (last November/December), these
observations may not be able to provide the required
data for a PSD solution. The next outburst will
provide a better opportunity for these observations.
Even amateur observations should then be useful for
this purpose. PSD is needed for several things, such
as yielding a more accurate fragment size and modeling
radiation pressure effects on particle movement away
from (and toward) the WD star.
Staying in Public Domain
Summary of Results
Many dips are still present per orbit, as of 2016 Mar 01, but they are concentrated at phase ~ 0.5 (different from Nov & Dec, when there were fades at all phases but concentrated near phase zero). A K2 simulation shows fade depths within the range 8% to 24% (with shape sometimes resembling K2 mission findings). The activity level is decreasing slowly (good luck for 2016 observers!). I think activity level rose from the low level observed during K2 to the high December, 2015 level starting in late July and mid-August (based on convergence times of fade drift lines). This is when an old (dead) fragment may have had a collision with the L1 end of the asteroid, prompting a new set of fragment breakaways. Sampling theory suggests that such renewals of activity may occur at 2 or 3 year intervals.
Data file: data (this is the 2016.12.19 version. Plz check for revised versions later.)
Activity Level
"Activity Level" for a date is defined as "the area under the curve" for one orbit on that date. It is calculated by summing the area of all dips needed to fit a LC for that date. Note, the area under one dip is 0.79 x depth x (tau1 + tau2) / 4.5 hrs.
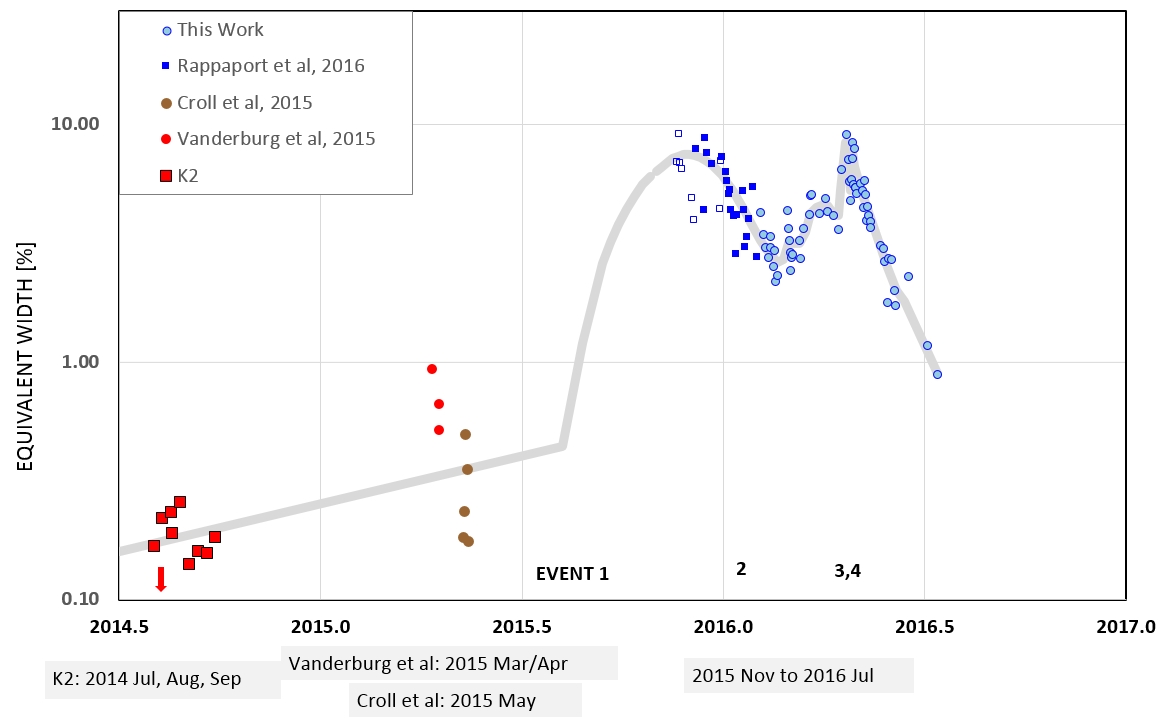
The EW (equivalent width, or total area under all dips) is currently 0.044 vs. 0.00146, the median before event A (~2015 Sep 1).
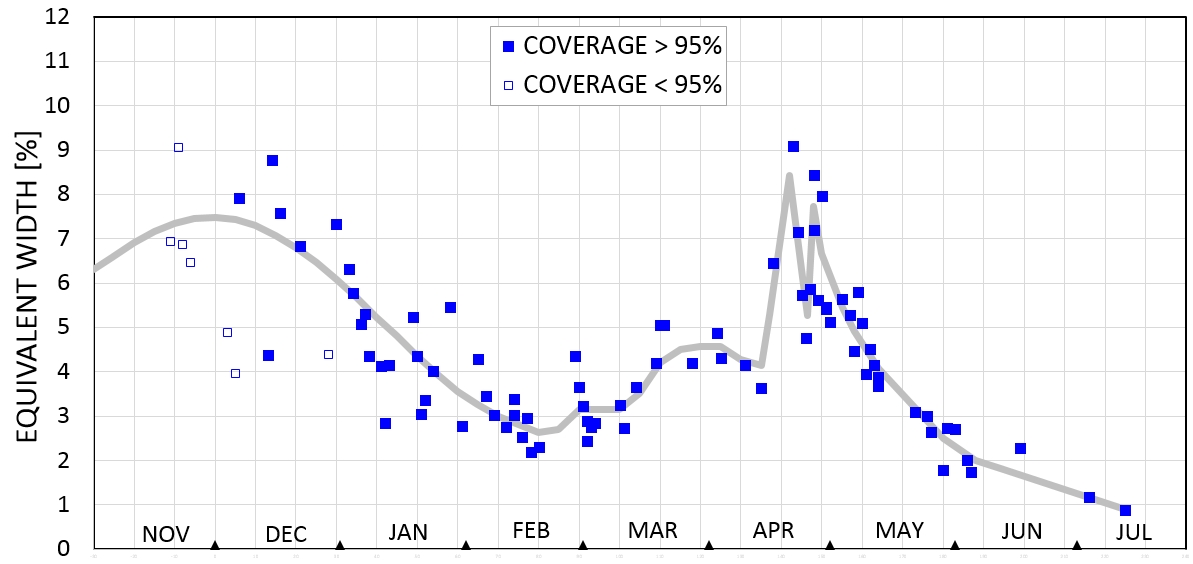
Total fade "equivalent width" is the sum of all fade events (depth × (tau_ingress + tau_egress)), during an orbit. Open squares are lower limits due to incomplete orbital coverage; small squares are attempted adjustments of open squares to estimated complete coverage value. The model takes into account a subjective estimate of the incomplete coverage for Nov/Dec data. The smooth model overlooks what appear to be real changes on smaller timescales. There appears to be a jump in activity on 2016 Apr 14 or 15, with a peak of activity on Apr 21, then a decrease that has lasted for 3 months.
The activity level was trending downward with date from early December to mid-February, as illustrated by the following two LCs:
The number of fade events didn't change but their depths did! Starting in late February the depth of fade events (dips) increased.
Waterfall Plots and Speculation
Note: The following plots have time increasing upward (so these could be "water-rise plots").
This is an overall location of dip features during the past 5 months using the asteroid's A-period ephemeris for defining phase. Date is defined as days since Nov 30. The vertical red line is identified with the asteroid. The rectangle of activity (centered on phase +0.10) has a period that agrees with the Kepler A-period. Symbol thickness is proportional to dip depth. (As of 2016.06.22)
I speculate that until ~ Jan 21 most fragments that left the asteroid "mother ship" were small enough to "turn-on" almost immediately but then ran out of mass and died within a few weeks, still close in phase to the asteroid source. This allowed them to show the A-period of their source asteroid. Imagine that the asteroid is located at phase +0.15, and the drift lines represent fragments breaking off the L1 end of the asteroid at dates corresponding to the intersection of the backwards-in-time projection of the drift line to the asteroid, at phase +0.15 (vertical red line). The first drift line would then correspond to an origin of 2015 Oct 12. The last breakaway event is indicated by the large group of asteroids that occurred on ~ 2016 Jan 21. This group of fragments was apparently large enough to remove "pressure" from the squeezing effect of the gravitational field gradient at the L1 end of the asteroid, so fragment breakaways stopped on that date.
I propose that the size distribution of fragments for the Jan 21 breakaway event included more large fragments compared with the earlier breakaway events. Since the surface area to volume ratio is inversely proportional to fragment size we can expect a lower level of activity (dust production per unit mass) immediately after the breakaway time, corresponding to a longer turn-on latency; but once turned on they should remain active longer and should turn-off much later than their small fragment counterparts. The Jan 21 event must have yielded many large fragments that didn't turn-on in a significant way for ~ 2 months, about mid-March. So far, this group of fragments has remained active for almost 2.7 months, and may continue to be active for many more. (The fact that some drift lines don't extend all the way back in time to the asteroid's location, at phase +0.13, can be explained by assuming a fragment can remain "dormant" for many days, or weeks and months depending on size, before it begins to produce dust clouds.)
Note how a fragment's dip depth varies with time. This constrains modeling of dust production and loss timescales. Presumably dust loss rate is constant but dust production rate is variable, accounting for variable dip depth vs. time for each fragment. The turn-on latency may be a good indicator of fragment size, with longer latency corresponding to larger size.
The large breakaway event of 2016 Jan 21 exhibits a drift rate (with respect to the asteroid) of -3.0 [min/day]. This leads to a complete phase shift in 90 days; that's the time it takes for the fragments to "lap" the asteroid. This group of fragments is predicted to pass the asteroid on Apr 20. If the asteroid's gravitational influence is strong enough to change fragment orbits then we should see a change in dip pattern starting on that date. For example, the drift lines should begin to diverge more, and take on a less-steep slope (closer to zero than -3.0 min/day). Speculating further, if orbit disruption does occur on about Apr 20 we might expect that one of the fragments with a disrupted orbit could impact the asteroid 90 days later, and cause a large number of new fragments to be produced, causing dip activity to increase dramatically. Apr 20 plus 90 days is Jul 19; that's unfortunate because WD1145 will be closing-in on the sun then, being observable for < 1 hour per night before sunset.
Consider the Apr 20 close approach of the asteroid with many fragments. They will be close together for something like a week. Therefore, there will be an outward gravitational tug during the week long passage. In other words, the fragments will have a larger orbit, and still approximately circular (because their proximity lasted many orbits). Since the fragments are in a new, outer orbit, their lap interval will increase to more than 90 days. After many such passes, at 90-day intervals initially, but stretching to longer and longer intervals, the probability of a collision increases. Collisions can be the trigger for a new phase of fragment release and dust cloud dip activity. How long can such a scenario endure? Until the asteroid is totally destroyed!
What a neat solar system!
These are traditional waterfall plots (except that I show time moving upward).
During the G6121 "transition" this is how the LCs stacked-up (using the A-fragment, G6121, ephemeris).
Waterfall Plots
Waterfall plot showing 80% of an orbit (i.e., phase) for a 2.4-month date interval (starting with the Jan 21 transition date). The 21 "drift lines" are solved for using an objective protocol (maximum of sum of depths encountered vs. slope, for continuous sampling of phase offset hinge points). The 10 solid line drift lines are what I would call "acceptable" (a subjective assessment) while the 11 dotted lines are merely "suggestive." (I have some feedback from a couple professionals who are skeptical about such drift lines. They essentially say "Can you prove that the dip associations belong together?" My answer: "No, of course not, but be reasonable!")
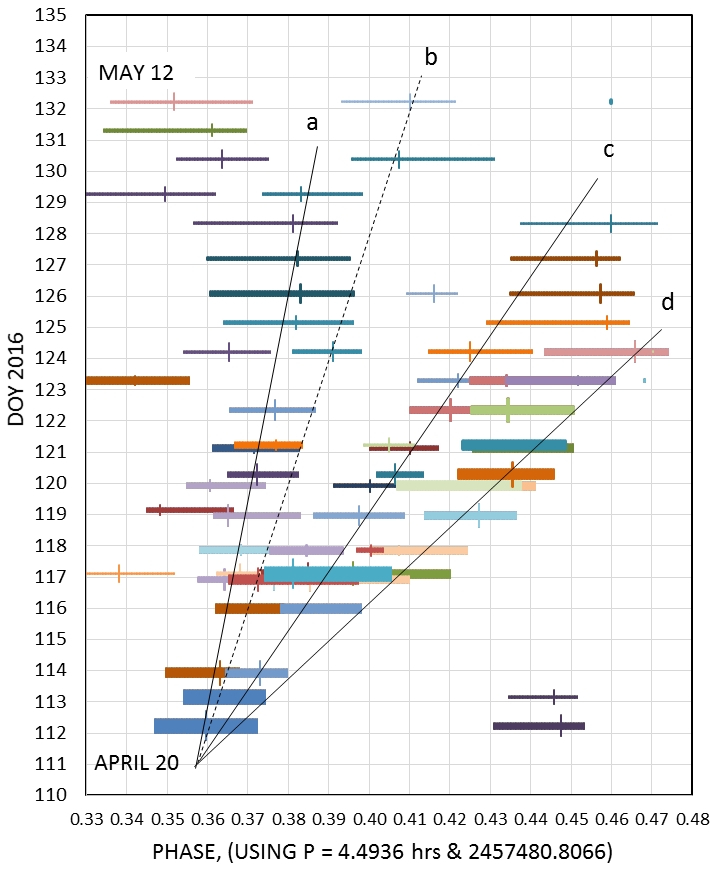
This 2016 April waterfall plot adopts fragments period of 4.4916 hrs. The red line on left is my provisional estimate for the asteroid's phase location (using P = 4.50037 hrs). Fragments that pass the asteroid (i.e., lapping it) will move upward to the red line and then veer to the right with a slope greater than the red line (i.e., corresponding to the fragment being in an orbit larger than the asteroid). Two fragments that have passes the asteroid appear to have reversed drift direction, and are now drifting to the right at a rate similar to, or greater than, the asteroid. A fragment that turned-on at location "Apr 21 / phase +0.39", is moving the right. Since it was far from the asteroid when it appeared it may have been caused by a collision of two previously dead fragments, exposing 3 fragments with fresh surfaces for producing dust clouds (lasting 2.5 weeks).
Below are a few old waterfall plots, showing behavior, up to Mar 20.
This waterfall plot is for data taken after the MNRAS publication, Rappaport et al (2016).
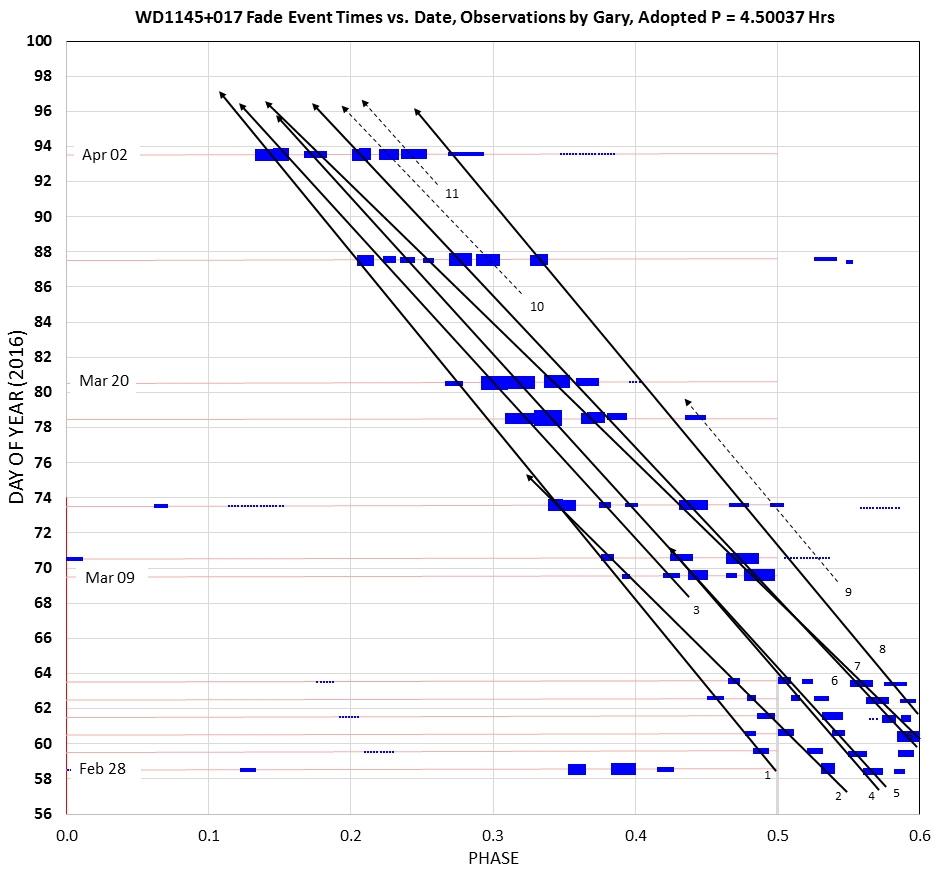
Expansion of above figure, showing detail of the current dip group. The average drift rate for this group is -2.80 min/day.
This waterfall uses the fragment period, so drift lines are close to vertical (which is easier to interpret).
The current group of dips drifts with respect to the A-period (4.50037 hrs) at a rate of -2.80 min/day. The fragments producing dust clouds therefore have a period of 4.4916 hrs (0.187151 day). The dip structure therefore appears 1.5419 hours earlier each day (i.e., 0.064246 days earlier each day). An ephemeris for the center of the dip structure is 2457481.7458 + 0.187151 × E.
There's another series of waterfall plots at this web page: link It shows activity level vs date for each drift line (fragment) for a limited interval of dates in early 2016.
B Orbit Dip Period
So far only 1 dip has appeared with the K2 B period of ~ 4.6053 hrs.
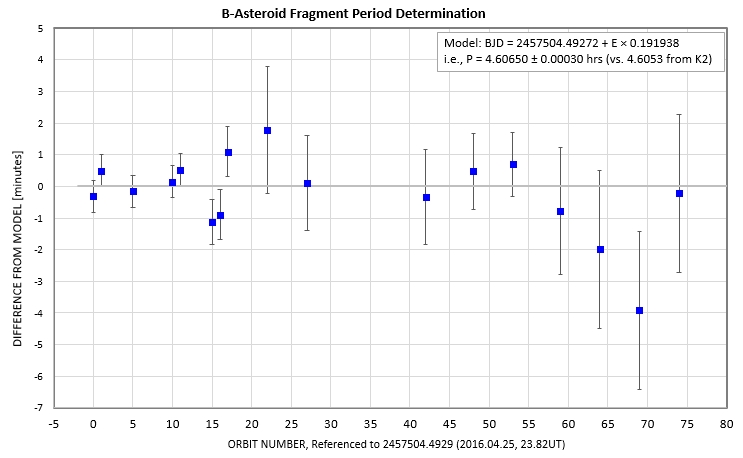
The fast-moving dip that suddenly appeared on 2016 Apr 26 has a period of 4.6066 ± 0.0004 hours, which is the same as the K2 B period. It must therefore be either a fragment that recently left the B-asteroid, or the B-asteroid is producing a dust cloud. It has a much longer trailing tail than leading one.
Spectral Energy Distribution (SED)
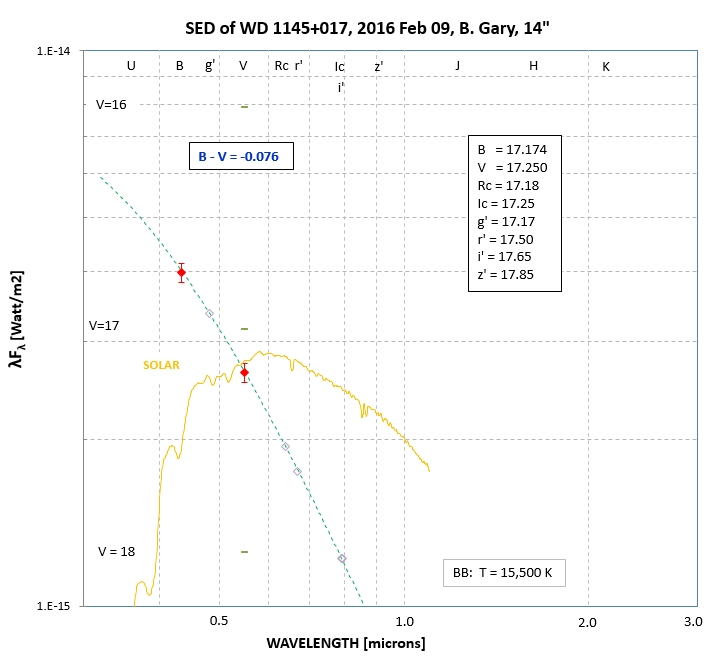
SED based on measured B-mag & V-mag (using 12 nearby reference stars). Other mag's can be estimated using the fitted BB model.
Fragment Periods
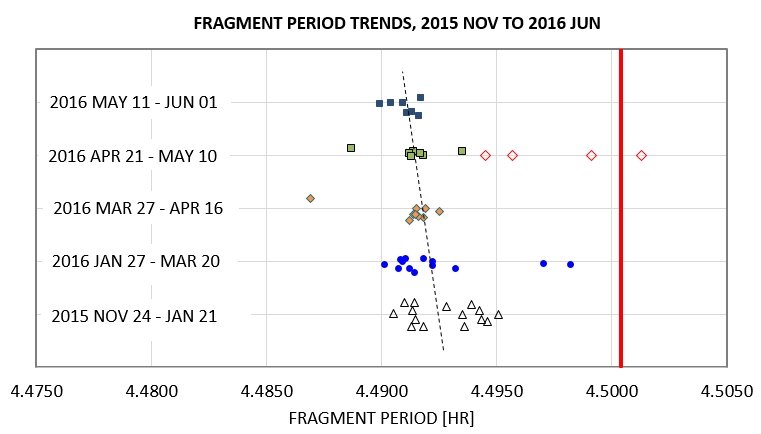
It appears that the fragment period has been decreasing during the past 7 months.
The Poet Within Me
When a neighbor asked what I’ve been doing lately, the poet within me spoke up: I’ve been getting a far-future glimpse of our sun, the Earth and the matter that makes up you and me. I told how our sun will swell to giant size, then collapse into a white-hot dwarf star the size of Earth, followed by surviving planets disintegrating, breaking off pieces, some of which will include the atoms that once were you and me, and that we will in this way contribute to dust clouds that will obscure some of our diminutive sun's light, to be noticed by some intelligent observer elsewhere in the galaxy, curious to understand what's out there, and perchance to better know their future. I presume that those observers will be as clueless about the privileged time of their race as ours was while living through the best of times for us during the mid-20th Century on this wondrous home planet. At our human high noon, when our fortunate species prospered and squabbled upon a giving Earth, we forgot to feel gratitude. Yes, gratitude was the real subject for what I had been doing lately; it always comes when the grateful thing is gone, as it certainly will be when our horrible human race, with its deep-rooted tribal mentality, transforms an artisan created civilization into a cancer that chokes off most life on Mother Earth, eventually including itself. My neighbor politely nodded, pretending to understood.
Evolution of the Culture of Astronomy and the State of Pro/Am Collaborations
It has taken me about a decade to figure out that the astronomy culture of today has changed from what I knew ~ 5 decades ago, when I was a professional radio astronomer.
During the 1960s and 70s the culture was collegial; astronomers helped each other get established, and establishing a career required only a +2-sigma IQ and a love of the subject. We helped each other, and shared what we were doing without suspicion. During the 70s I transitioned into the atmospheric sciences, and lost track of the culture of astronomy, except for occasional grumblings by former colleagues. I recall MJ complaining, during the 1980s, that getting funded required being part of an "old boy's club."
After retiring in 1998 I remembered the fun of my childhood astronomy hobby, before college, so I bought a 10" Meade telescope and returned to astronomy as a hobbyist, an amateur. The transition from film to CCD was occurring, and as a result new observing opportunities for amateurs were opening up. I became one of the first amateurs to measure an exoplanet transit in 2002. I urged other amateurs to join in this fun, and created a web page for archiving amateur exoplanet transit LCs (AXA, with ~640 LCs). I tutored many of these amateurs so they could produce scientifically useful light curves. A few professional astronomers took note, and I was invited to collaborate by observing exoplanet candidate stars (the XO Project). Later I began a consulting arrangement with Vanderbilt University (i.e., KELT), lasting ~ 3 years.
I slowly started to take a new reading of the professional astronomy culture. It seemed that the most striking change was an out-of-balance supply/demand ratio; in other words, there were too many young PhD astronomers competing for the funding available from NASA and NSF. It occurred to me that universities were graduating too many PhD astronomers (because it allowed them to maintain teaching staff).
After a couple years consulting for an asteroid astronomer, I gained some insight into the funding atmosphere for that discipline. That's where I learned about the new need for sharp elbows, keeping secrets and bitter competition for recognition. More recently I learned something from working with a young WD astronomer, in which my role was creating a group of amateurs for providing all the observations.
I have come to realize the role of secrecy in creating a career in astronomy. Using others without their knowing it is also helpful. Accepting co-authorship without contributing is acceptable. Anything, in short, that promotes securing employment defines the new astronomy culture. I'm not overlooking the role of intelligence and knowledge; it's just that those are merely a minimum requirement. Having a +3-sigma IQ, and being highly motivated, are just the entry ticket for achieving a career in astronomy because those other new skills that I've recently learned about have become important. I sense the loss of "spontaneous fun" within this new culture, so "fun" may now be secondary. And there's also a loss of trust. It is now necessary to think twice about a colleague's motives. For example, does that person have an affiliation with another group of astronomers doing work that competes with what we're doing together, and is he passing secrets. Who is going to beat us in publishing similar work, knowing from an informant our publishing schedule.
For some people, this may be fun; but not me! I'm old fashioned, and accustomed to openness and trusting relationships. If this is unfeasible, then count me out. I'll restrict my future collaborations to other amateurs. For this reason I am proud to be an amateur again!
The rest of what I once wrote for this section might be considered a "rant" that's a bit too candid for this web page. If anyone wants to read it you'll have to ask me for the web page PW. The username is "123" but to get the PW you'll have to e-mail me (see bottom of this page). The rant is located at link.
Another complaint that I've slowly come to recognize, which I think afflicts the present community of astronomers, is what I call the "Culture of Caution." The best way to convey what I'm referring to is with a joke that Dr. Gulkis told me 5 decades ago, shortly after I hired him at JPL: A scientist is traveling on a train, and a traveling companion remarks "Look at that brown cow grazing in the field." And the scientist replies "Well, we only know it's brown on the side we can see." This joke may only be funny for someone who has had to work with professional scientists and felt the frustration of getting past a reasonable assumption for the sake of pursuing an interesting speculation. That's the frustration I felt when Tom Kaye and I tried persuading a professional astronomer on our WD1145 team that we were seeing dip features drift to earlier times using the A-asteroid ephemeris. I think it took 3 or more weeks of data to sort of convince him, and he's still very cautious about believing my drift lines. He also seems reluctant to accept the use of converging drift lines as a way of assigning a creation date for a fragment collision. Some favorite paragraphs, and one section, in the MNRAS manuscript, were deleted before submission for lack of supporting theory. When we received a 3-page list of comments from an anonymous reviewer assigned by the MNRAS journal, the same excess of caution was present. Basically, "Can you prove that the drift lines that you created by eye are physically associated?" (My response, kept to myself: "Of course not, but can't we be reasonable!"). It was like asking if I could prove that the cow was brown on the other side. Partly in response to the reviewer comments (urging caution), an additional section (and my favorite figure) were deleted from the journal article. I feel like the article has been eviscerated of much of what made the WD1145 observing and speculation project fun. From now on, I'm going to avoid the killjoy "Culture of Caution" by only "publishing" in web page format, and maybe supplemented by PDF document summaries (as in link).
Finder Image
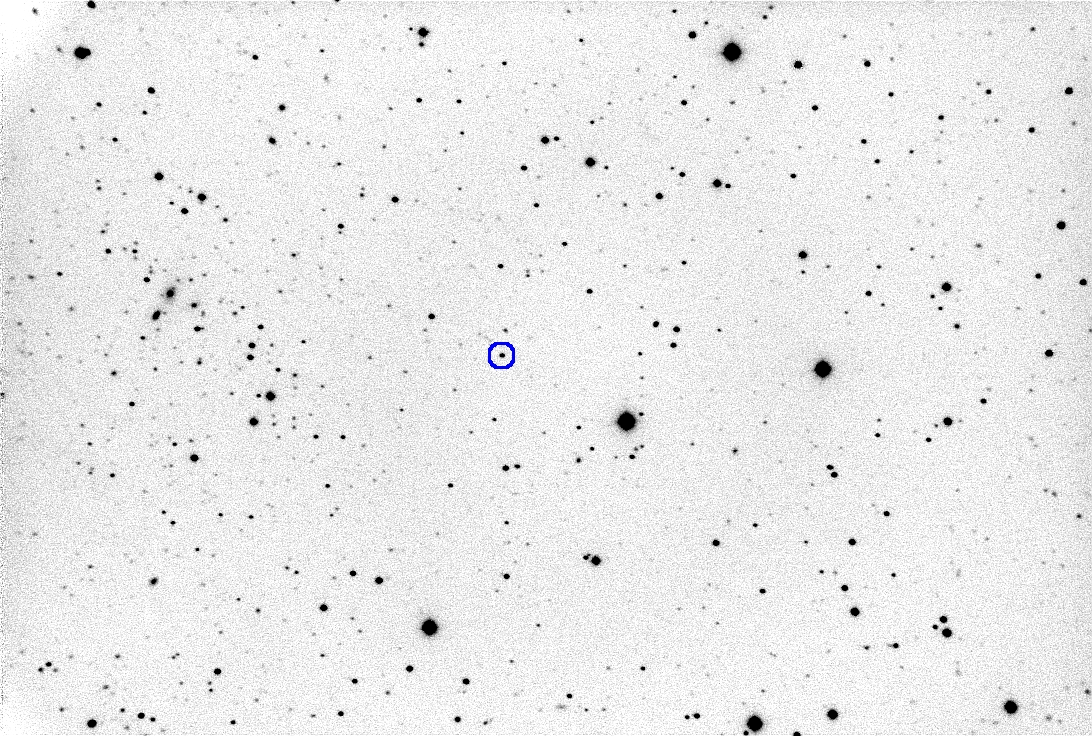
WD1145 is at 11:48:33.59 +01:28:59.3 (J2000). FOV = 27 x 18 'arc, northeast at upper left.
References
Vanderburg et al, 2015, "A Disintegrating Minor Planet Transiting a White Dwarf," Nature, 2015 Oct 22, arXiv:1510.063387
Croll et al, 2105, "Multiwavelength Transit Observations of the Candidate Disintegrating Planetesimal Orbiting WD 1145+017," ApJ, arXiv:1510.06434
Gaensicke et al, 2015, "High-Speed Photometry of the Disintegrating Planetesimal at WD 1145+017: Evidence for Rapid Dynamical Evolution," arXiv :1512.09150
Gary, B. L., S. Rappaport, T. G. Kaye, R. Alonso and F.-J. Hambsch, "WD 1145+017 Photometric Observations During 8 Months of High Activity," 2017, MNRAS, 465,3267-3280. Abstract & PDF, arXiv:1608:00026
Rappaport, S., B. L. Gary, T. Kaye, A. Vanderburg, B. Croll, P. Benni and J. Foote, 2016, "Drifting Asteroid Fragments Around WD 1145+017," MNRAS, arXiv:1602.00740
Alonso, R., S. Rappaport, H. J. Deeg and E. Palle, 2016, "Gray Transits of WD 1145+017 Over the Visible Band," Astron. & Astrophys., arXiv:1603.08823
Petit, J.-M and M. Henon, 1986, Icarus, 66, 536-555 (link)
Redfield, Seth, Jay Farihi, P. Wilson, Steven G. Parsons, boris T. Gansicke and Girish Duvvuri, "Spectrosopic Evolution of Disintegrating Planetesimals: Minutes to Months Variability in the Circumstellar Gas Associated with WD 1145+017," arXiv:1608.00549
Xu, S., M. Jura, P. Dufour & B. Zuckerman, 2016, ApJ, 816, L22
Veras, Dimitri, Philip J. Carter, Zoe M. Leinhardt and Boris T. Gansicke, 2016, arXiv
Tom Kaye presentation at 2016 Society for Astronomical Science meeting: link
Related Links
Mukremin Kilic's pro/am monitoring
of dusty WDs: link
Tom Kaye video of talk about WD1145
presented at Society for Astronomical Sciences(SAS),
June, 2016: link
Some observing "good practices" for
amateurs (book): Exoplanet
Observing for Amateurs
Hereford Arizona Observatory
(HAO): http://www.brucegary.net/HAO/
Tutorial for faint object observing
techniques using amateur hardware: http://brucegary.net/asteroids/
Master list
of my web pages & my Resume