WD 1145+017 Observational
Findings that Need Modeling
2019.07.10, B. Gary
During the past 3.7 years I've analyzed 354 observing
sessions of WD1145, yielding a light curve for each. My 14" and
16" telescopes were used for most of these (61 %). Other
contributors are Tom Kaye (19 %), Josch Hambsch (9 %), Roi
Alonso (6 %) and Paul Benni (4 %). I have identified 1717 dips
in these LCs, all of which have been fit by the AHS function.
Statistics for dip depth and width are presented here (Fig. 1
and 2). Waterfall plots of dip location were used to identify
106 drift lines. Their "existence duration" histograms are
presented (Fig. 3). Several drift line properties (depth and
width) have been studied vs. date; one of them exhibits
impressive stability over a 3-month interval (Fig. 4). Drift
lines sometimes exhibit a "bend" in slope, and occasionally the
bend date is associated with the appearance of new drift lines
with a range of slopes (Fig. 5). Activity level, defined as
fraction of "missing" flux due to dips, summed over an orbit,
change with timescales of a few days and also years (Fig. 6).
The activity level during the 2016/17 observing season reached a
level that was 100-fold greater than during the Kepler discovery
observational dates. Dips with drift lines slopes corresponding
to periods close to 3 of the 6 periods found in Kepler data have
been observed from follow-up ground-based data. Whereas almost
all dips are associated with the A system, several are
associated with the next orbit out D system (Fig. 7), and a
small number are associated with the 3rd orbit B system. Figure
8 summarize this. Occasionally a set of dips distributed over a
large range of orbit phases will undergo a simultaneous increase
in activity, as occurred during 2017 January to March, (Fig. 9).
When circumstellar gas disk absorption lines are observed during
a dust cloud dip event the UV line absorption strength decreases
in relation to optical dip depth in a way that requires
different projected area on the WD disk for the absorbing gas
and dust cloud. The circumstellar gas disk must project a
smaller fraction of the WD disk than the larger dust cloud (Xu
et al., 2019). Models for projected areas and dust cloud opacity
can account for this relationship (Fig. 10), but solution dust
cloud is narrow and opaque. The problem with this result is that
a dust cloud with an opaque strip along the centerline should
produce "flat-bottom" dips on occasion, and none have been
observed. This web page's purpose is to summarize the wealth of
photometric observational findings obtained so far in order to
generate interest by modelers to construct realistic physical
models for the specific case of WD1145.
Categories of Photometry
Observational Findings Relevant for Physical Model
Development
There are several categories of observational findings that can
guide model development. Here are 10 categories.
1) Dip Depth Statistics
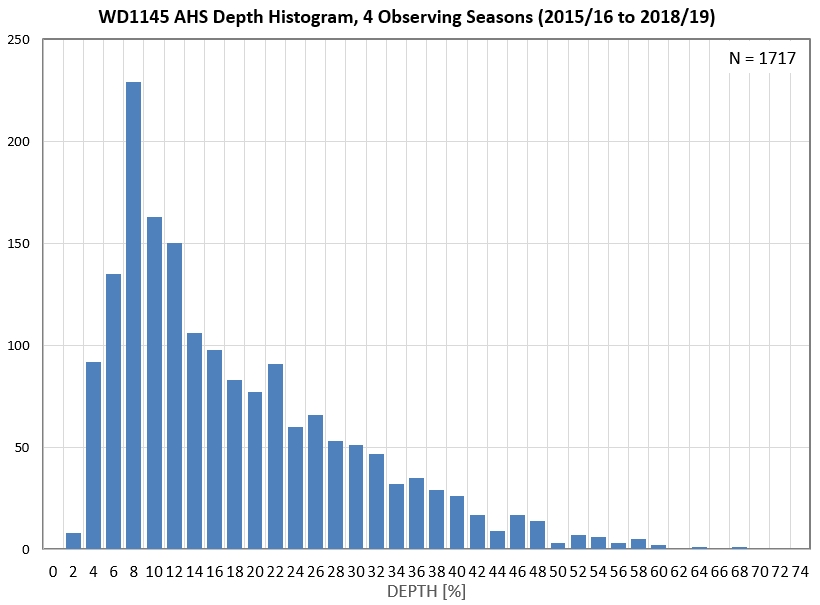
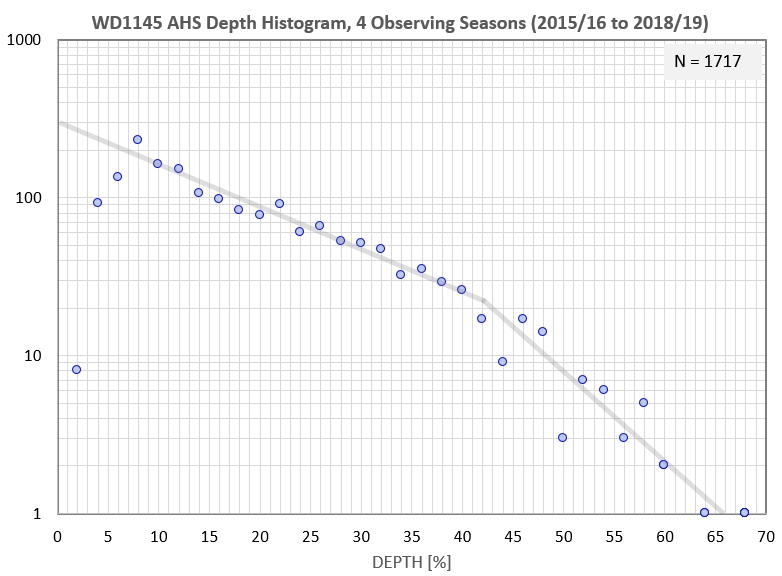
Figures 1a and 1b. AHS depth histograms for a sample of
1717 dips reported during the past 4 observing seasons.
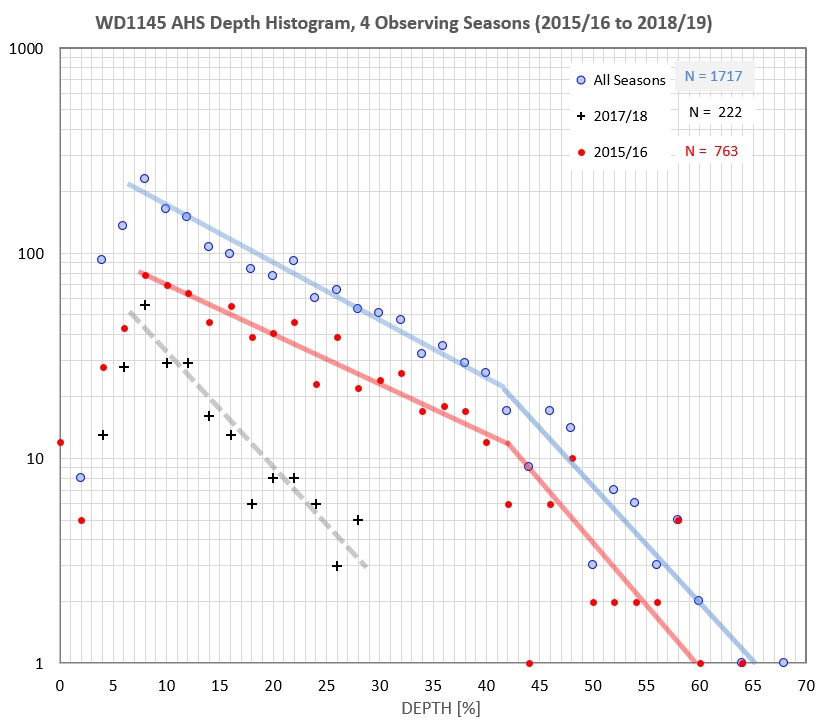
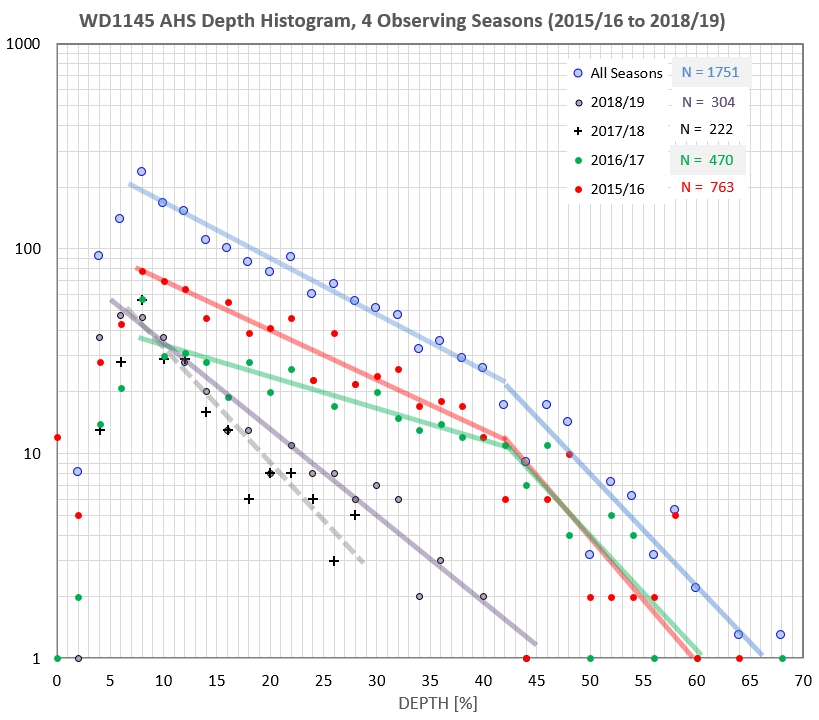
Figure 1c and 1d. Histograms for depth for the most
active and least active seasons (left) and all four seasons
(right). (Disregard the falloff at small depths, which is due to
use of small-sized amateur telescopes).
Median dip depth for all seasons is ~ 14 %. Using an amateur 14"
telescope dips with depth of < 7 % are under-reported. Based on a
simple log/linear plots (Fig. 1b) dips with a depth of 2 %, for
example, must be twice as numerous as the 7 % dips (that can be
detected reliably). Dips with depths exceeding ~ 40 % exhibit
a different incidence of occurrence vs. depth than applies to the
shallower dips (for both seasons when depths exceeding 40 % were
present). The deepest dip measured during 4 observing season is ~ 66
%.
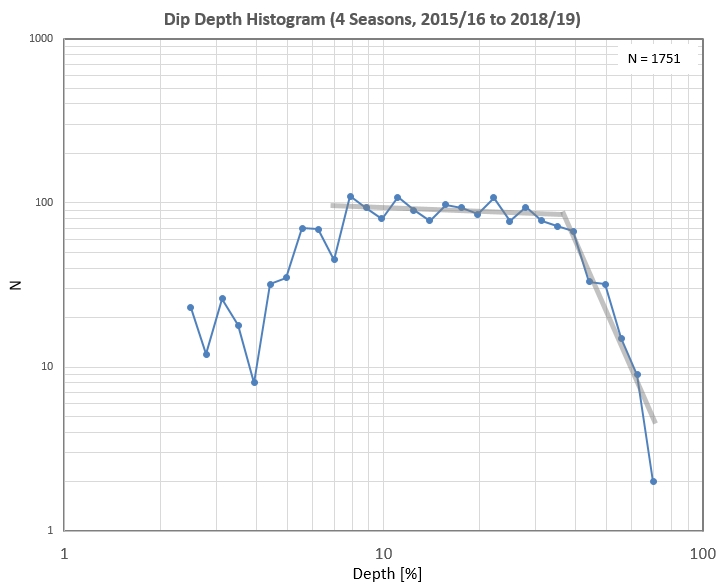
Figure 1e. Histogram using
uniform intervals for log(depth). Depths < ~ 7 % are
under-counted due to SNR limitations of my telescope (14").
The break at 40 % is real and may be related to the
inclination of dust cloud orbits that produce a preference for
transiting in front of one hemisphere of the WD disk more than
the other hemisphere.
The interpretation extremes are that 1) dust clouds are opaque,
with projected areas (and abrupt edges) that cover as much as 2/3
of the WD disk, and 2) dust clouds can cover the entire WD disk
with average transparencies < 1/3. Can the slope of the depth
histogram in Fig. 1e, in the depth region 7 to 40 %, be used to
assess compatibility with collision cascade models?
2) Dip Width Statistics
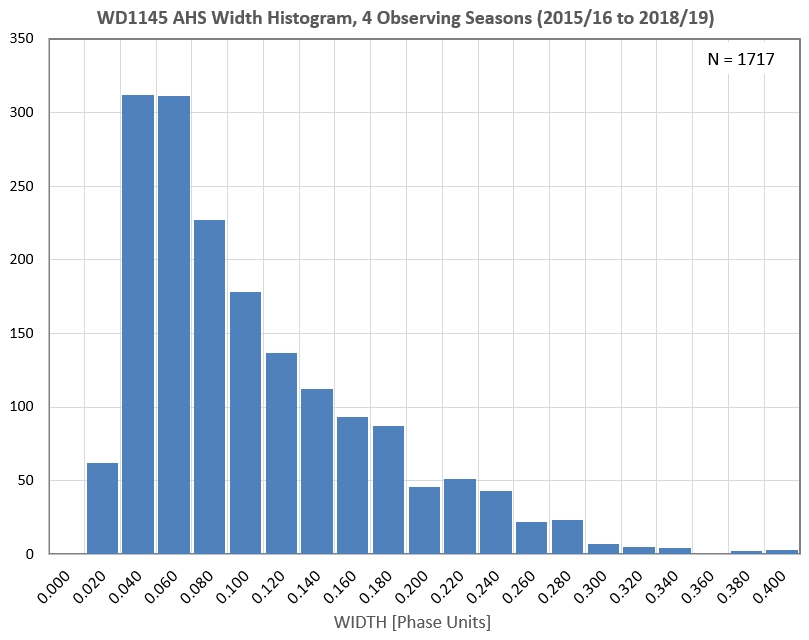
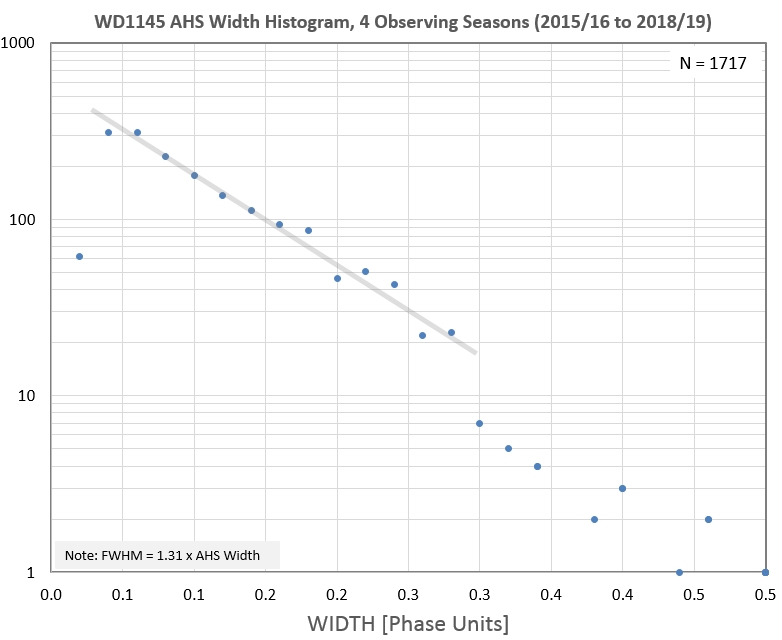
Figures 2a and 2b. AHS width histograms.
The median dip width, as measured using the AHS function, is
0.077 phase units (FWHM = 0.10 phase units). This is much smaller
than would be produced by Keplerian shear of a one-time created dust
cloud to spread to larger widths.
Some physical mechanisms have to be
continually creating and destroying dust.
3) Dip Duration Statistics
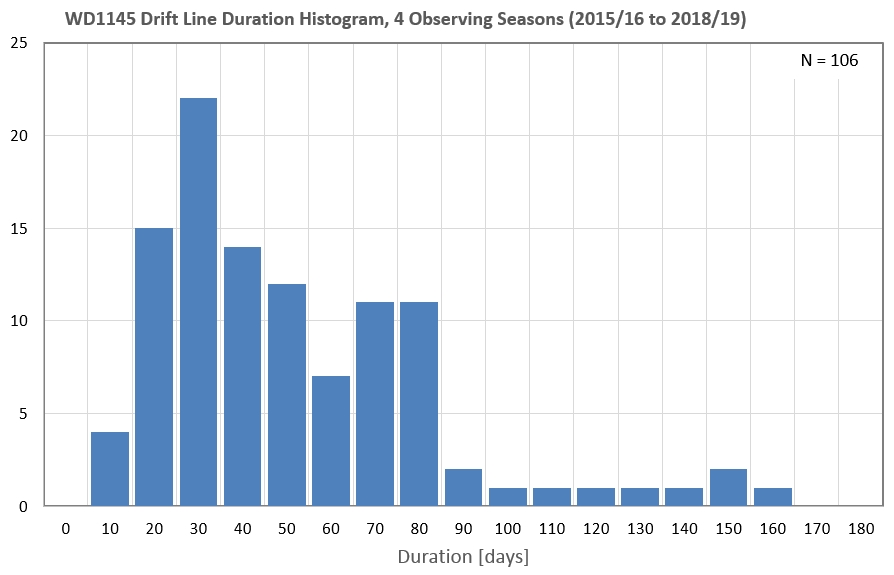
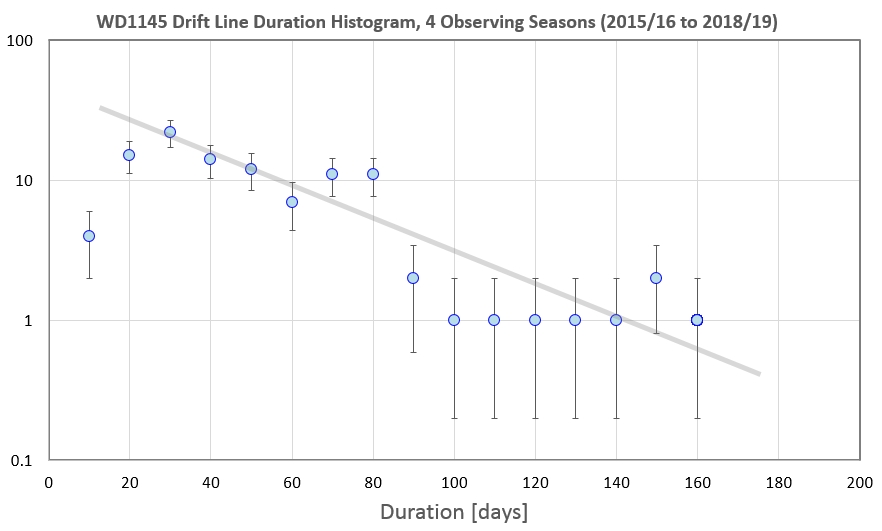
Figures 3a and 3b. Duration of drift line histograms.
The median duration of dips (that can be identified by their
appearance at expected phases for several observing sessions) is
> 40 days. This is much longer than the time it takes for
Keplerian shear to spread a one-time created dust cloud into
something resembling a ring of approximately uniform dust density
around the orbit.
Some physical mechanisms have to be continually creating and
destroying dust.
4) Dip Properties Stability
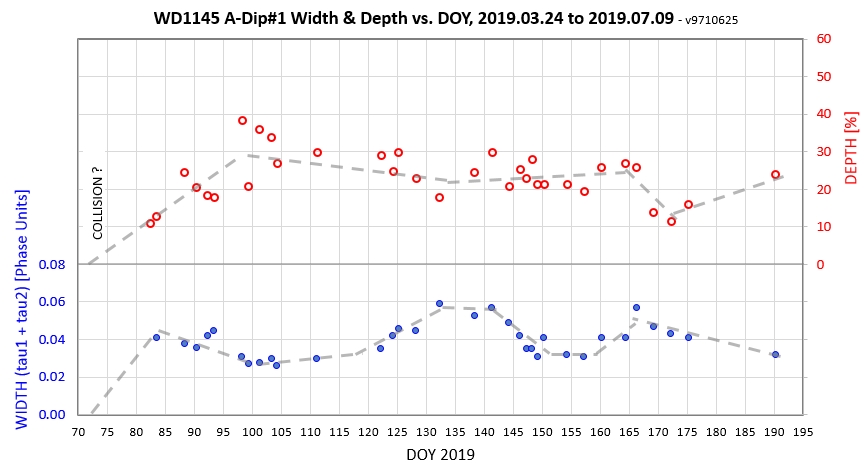
Figures 4. Dust cloud width and depth vs. date for a
3-month interval in 2019.
The 30 % depth requires a dust cloud vertical thickness >
0.5 × Rwd (assumes opaque cloud band with zero impact parameter,
i.e., extending from 0.25 Rwd below WD center to 0.25 Rwd above).
Ejection velocities must be as high as 0.75 km/s (assumes isotropic
ejections). This dip's width is stable at ~ 0.05 phase units (FWHM ~
0.065 phase units, 5% level ~ 0.185 phase units). Keplerian shear
for 0.75 km/s is 7.5 Rwd/day, which is 0.012 phase units per day. A
total shear of 0.185 phase units (corresponding to the 5 % level of
the AHS fit) will occur in 15 days.
Does this dips behavior (30 % depth and size
stability of 0.05 phase units, using AHS parameters tau1 + tau2)
mean that the farthest away particles (which presumably are the
smallest ones that are moving fastest) sublimate to vapor after 1
or 2 weeks? Does the stability of dip depth mean that particles
are being produced continually (during collisions every half
orbit)?
5) Drift Line Bending Events
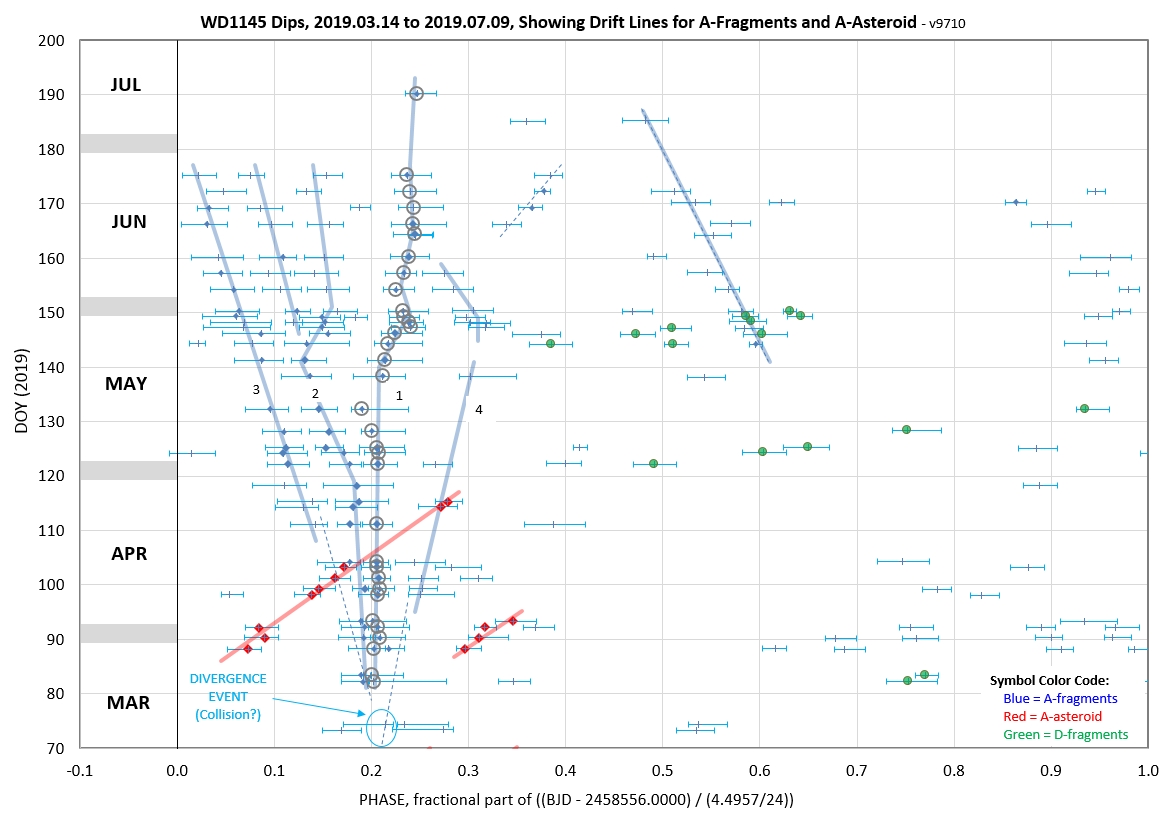
Figures 5a. Drift line waterfall plot for the second half
of the 2018/19 observing season, using a period for the A-system
fragments. Bent drift lines are evident for several dust clouds.
The circled symbols are for Dip#1, whose width and depth are
plotted in the previous figure. The apparent pattern of drift line
divergence from a "drift line divergence date of DOY ~ 73 is
treated in the Category 9 section. Note: the horizontal bars are not
SE uncertainties; they are the AHS tau1 and tau2 locations (where
depth is 65 % of the deepest depth). The uncertainties of the dip
center location is much less than the span of the
horizontal bars (SE is comparable to the size of the circles for
Dip#1).
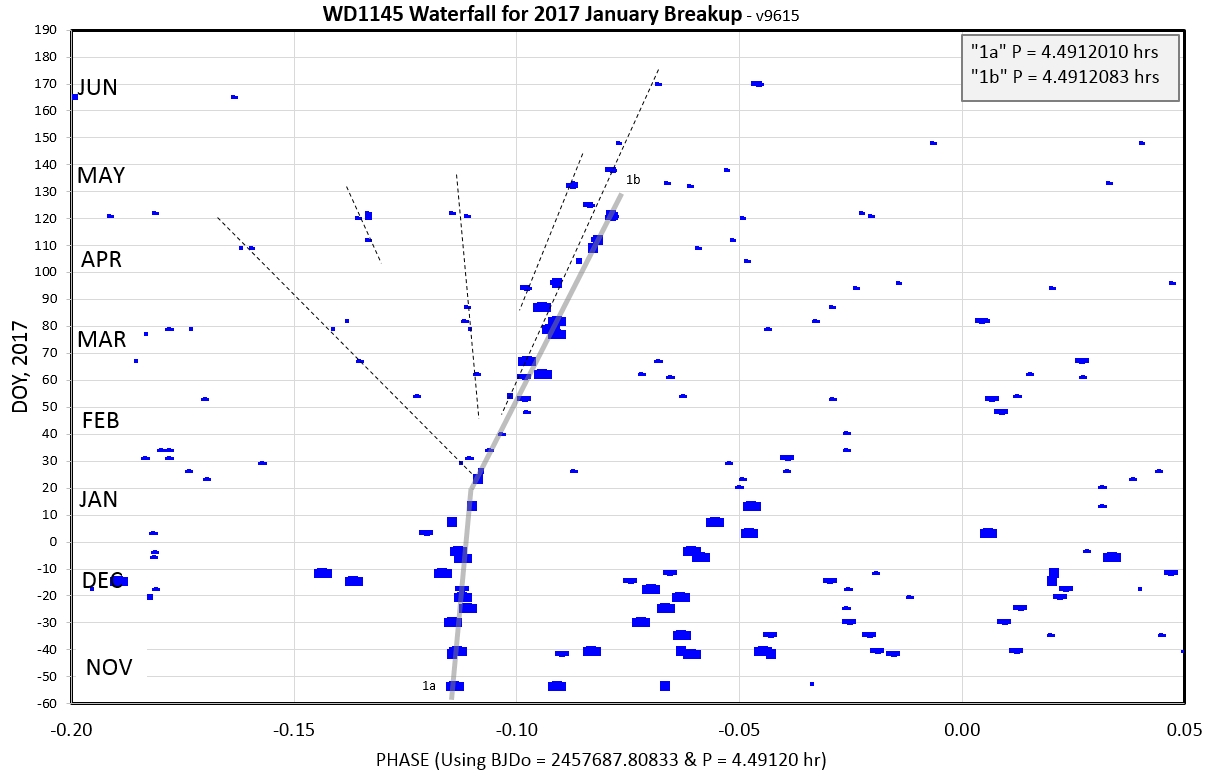
Figures 5b. Drift line waterfall for
the 2016/17 observing season (showing 1/4 of the orbit phase)
revealing a bending event, possibly caused by a collision in
late 2017 January. (The other drift lines radiating from this
"collision" are discussed in the Category 9 section.)
If drift line bends are due to
gravitational effects due to close passes of fragments then does
this provide a way to estimate a combination of parameter values
for number density vs. fragment mass?
6) Activity Level Variations
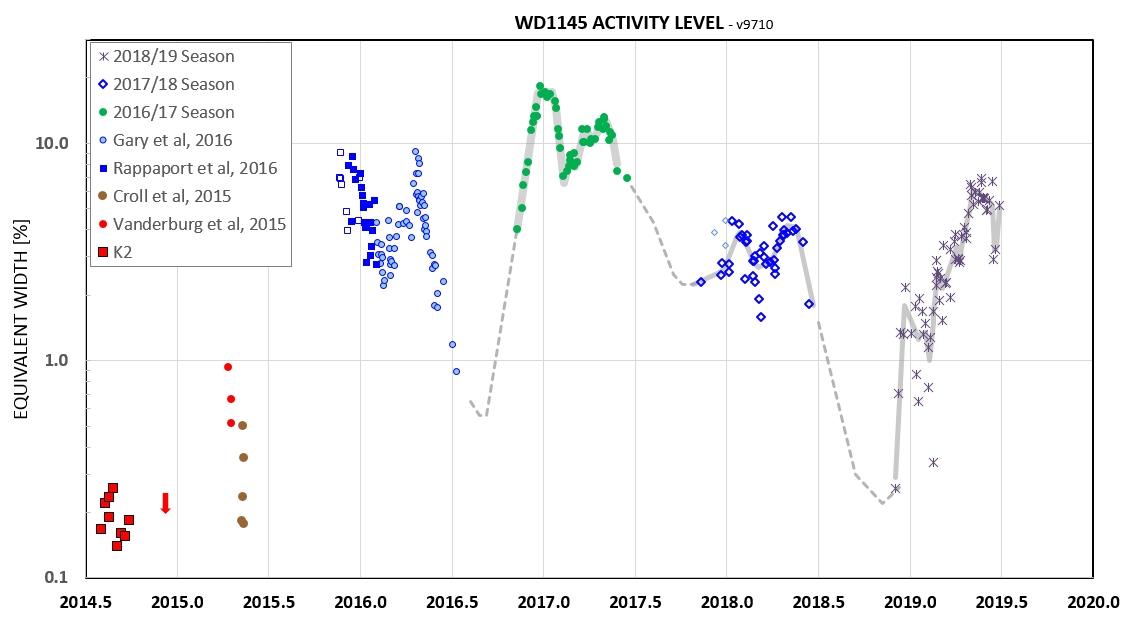
Figures 6. Activity level (fractional loss of flux during
an orbit) for a 6-year interval. There's a 40-fold increase in
blocked flux from K2 observing dates to the beginning of
ground-based observations in late 2015.
The past 5 years of monitoring activity level suggests that "low
activity" (1 year) is less common than "high activity" (4 years). It
may be possible to assume that activity level is ~ 3 % most of the
time and use this to calculate long-term rates for dust production
and asteroid mass loss.
About 2.5 % of WD1145 flux is obscured on
average during long-timescales of WD1145's life. This can be used
to calculate dust production rate and hence estimate total mass of
planetesimals available for disintegration after passing through
the red giant phase and becoming a WD.
7) Period Shift to Smaller Values When Activity Level
Increases
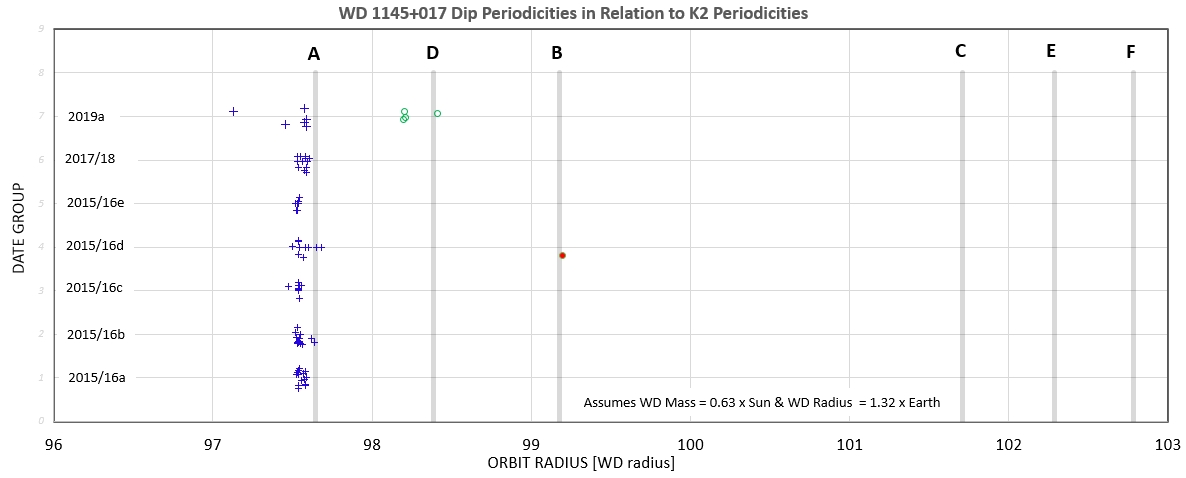
Figures 7a. The 6 Kepler periods correspond to these
distances from the WD shown here (for an assumed WD mass and
radius). The symbols represent measured drift line periods.
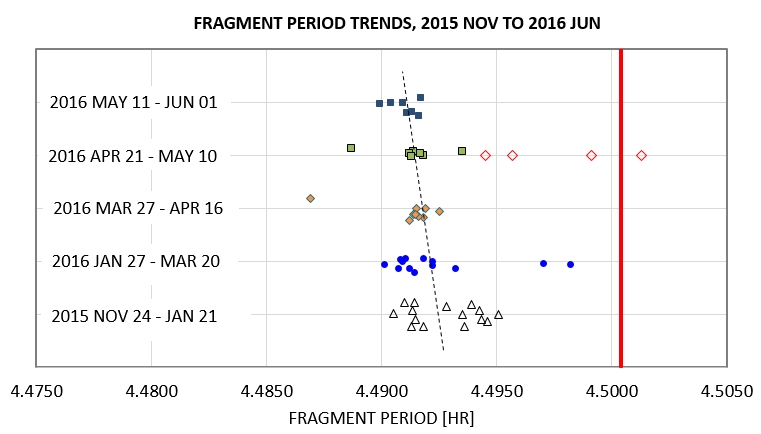
Figure 7b. Detail of relationship between periods of
A-system dust clouds and the K2 A period, presumably associated
with the A asteroid (for one observing season).
Does this require that only the hot end of an
asteroid releases fragments that later may become active in
producing dust clouds? Or could fragments be released at both the
L1 and L2 sides and they remain dormant until "viscosity" of a
permanent cloud of small fragments (too large for obscuring WD
starlight but massive enough to affect orbits of newly-created
fragments, think > 1 millimeter) causes orbits of the L2
fragments to shrink to smaller than the parent asteroid? (See last
section for details.)
8) Simultaneous Increase of Activity Across Broad Phase Region
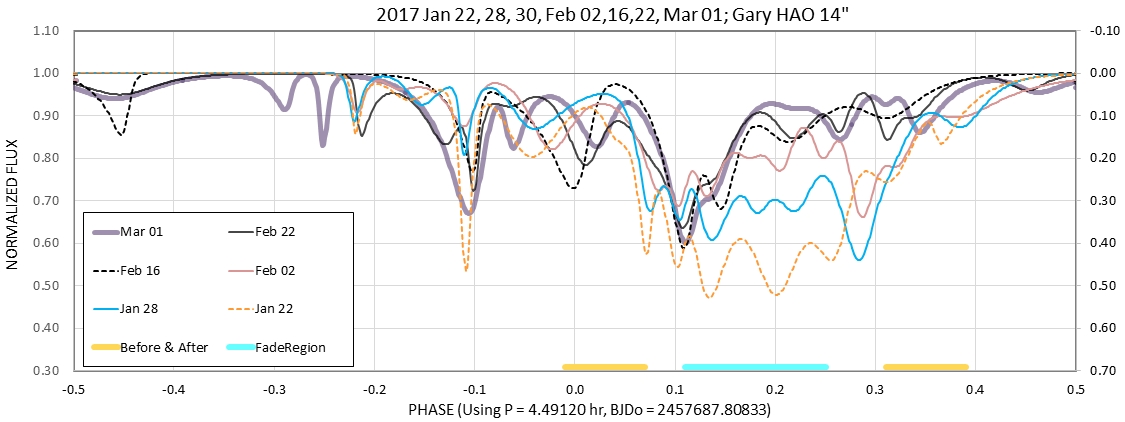
Figures 8a. Simultaneous change of activity across large
span of orbit azimuths.
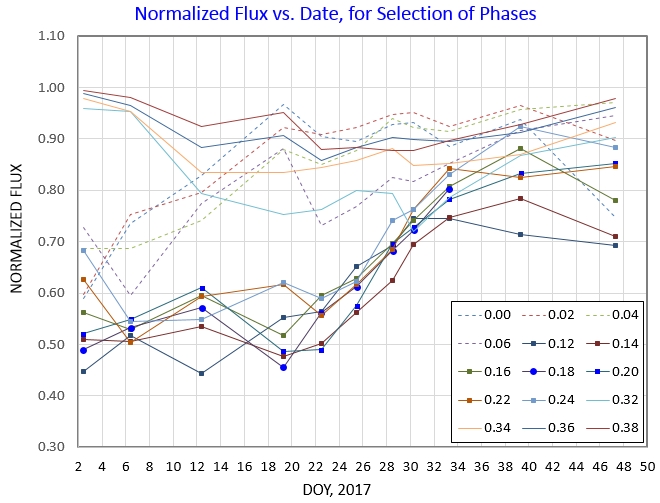
Figures 8b. Detail of above plot showing that
indeed fades in the previous figure does
indeed show a simultaneous change at all phase values within
that region starting ~ 2017 Jan 21.
Does this mean that dust clouds
extend in radial distance as well as orbital azimuth by large
amounts, with densities of mini-fragments that are sufficient to
activate dust production by previously "dormant" fragments?
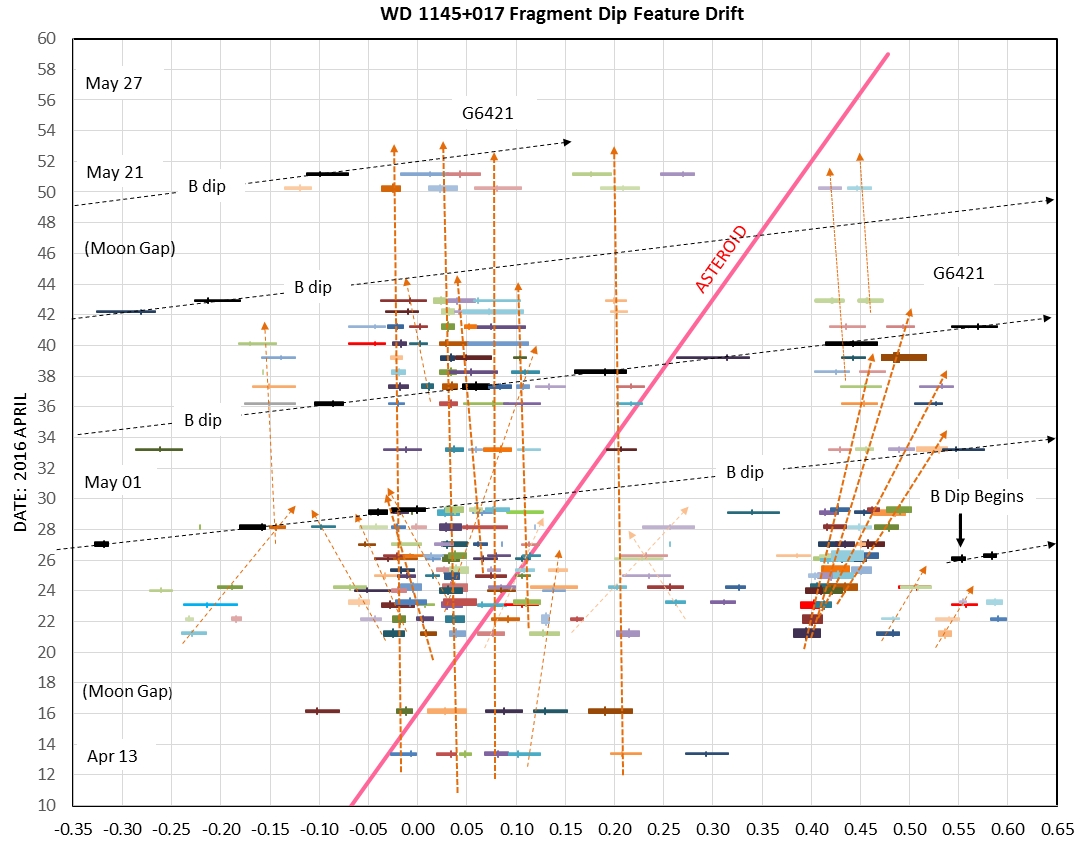
9) Drift Line Diverging Events
Many examples exist for diverging drift lines, starting with the
sudden rise of activity level in late 2015. Sometime before the
start of the 2015/16 observing season activity level increased
dramatically (30-fold, from ~ 0.3 % to ~ 9 % average blockage).
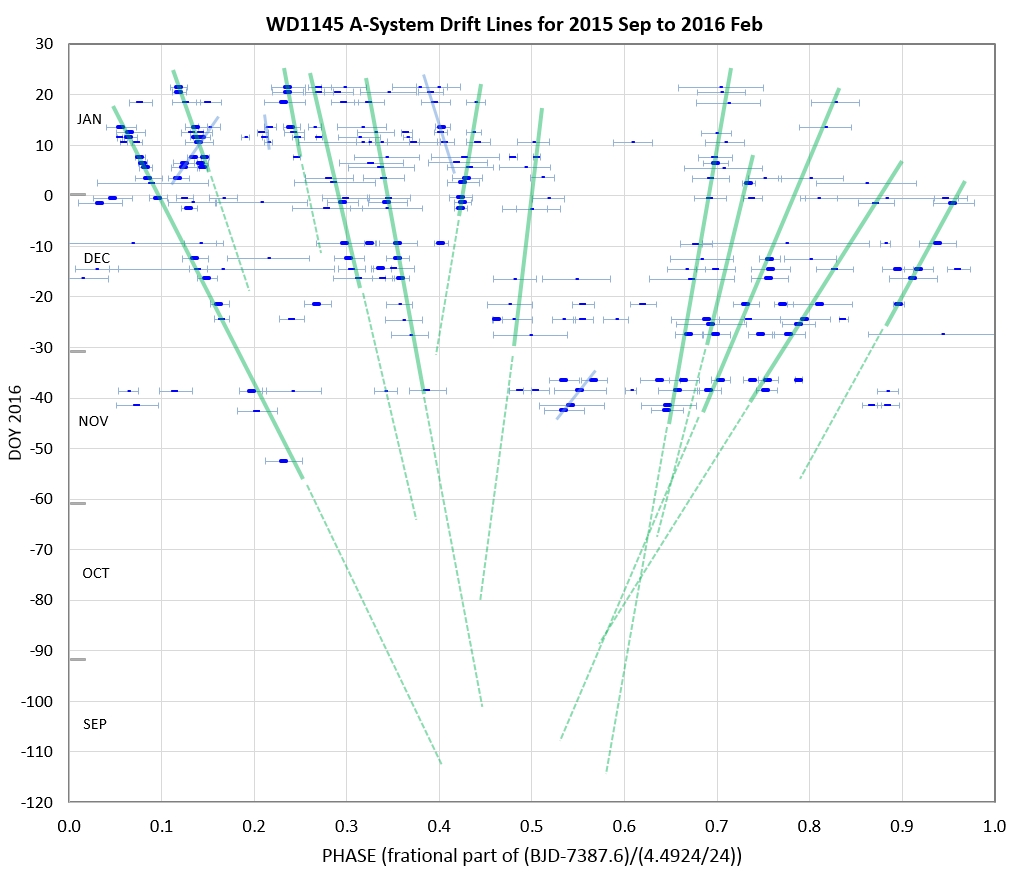
Figure 9a. The first two months of dip drift line
locations on a waterfall plot exhibit a diverging pattern that
project backwards to a date of approximately late August of 2015.
This may be the date of a major collision that started what has
become a 3-year time of heightened dip activity level.
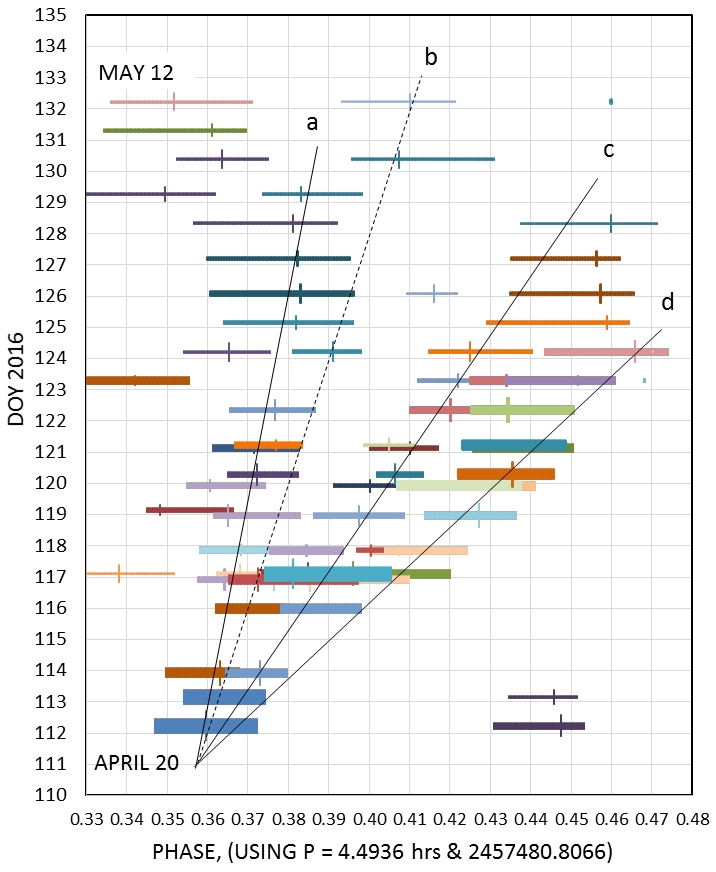
Figures 9b & 9c. On 2016 Apr 20 there was a sudden
appearance of a pattern of dips following 4 drift lines that
lasted ~ 2 weeks. All of these drift lines were sloped in
a way corresponding to a shorter period than the K2 A-period
(labeled "Asteroid").
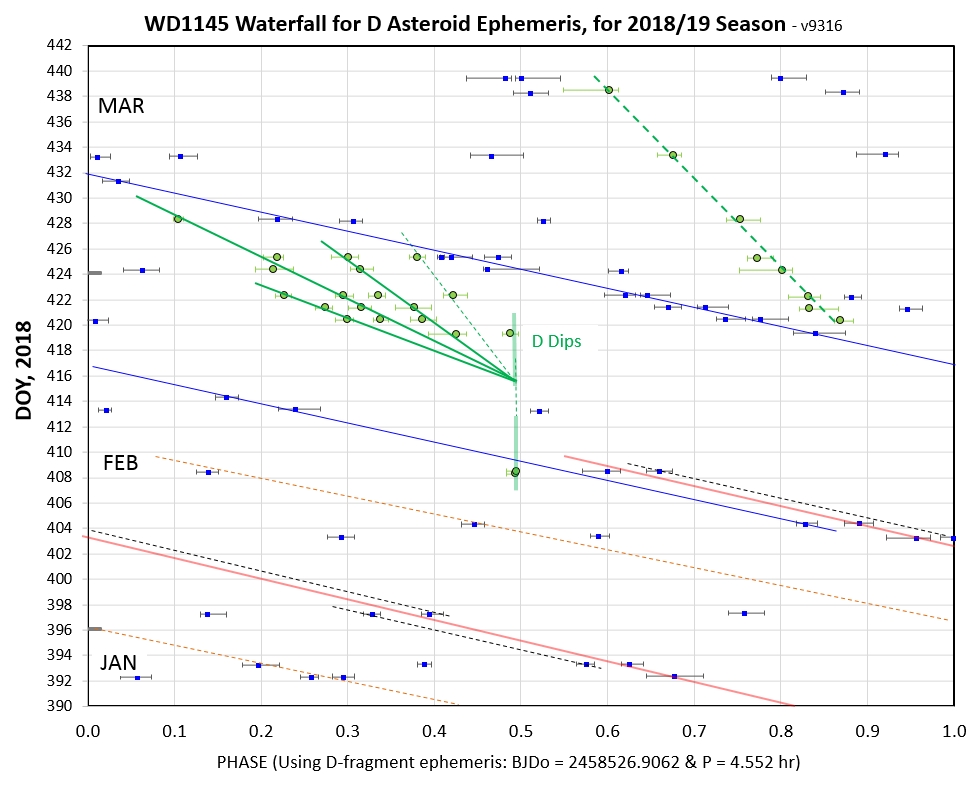
Figures 9d. Drift line waterfall plot using a D system
period, showing the dust cloud results of a collision at DOY
415.5. The main fragment revealed itself before the collision, at
DOY = 408.2, by a LC with two narrow dips separated by 4.552 +/-
0.001 hours (which was used for establishing the period of this
plot). All green drift lines belong to the D-system; the steeply
sloped blue and red lines belong to the A-system.
Figures 9e. Drift line waterfall for the 2016/17 observing
season (showing 1/4 of the orbit phase) revealing a possible
collision and in late 2017 January. The "main object" has a bend
in drift line slope at the collision date and as many as 4 new
drift lines diverge with different slopes from that date.
Figure 9f. The most recent drift live divergent event
began in early March, 2019 (DOY ~ 72). Notice that there are no
dips at this phase before this suggested collision date.
Does this mean that collisions between
similar-size fragments initiate dust cloud production (with
velocities of up to 1 or 3 km/s)?
10) Relationship Between Gas Disk Absorption Strength and Optical
Transit Depth
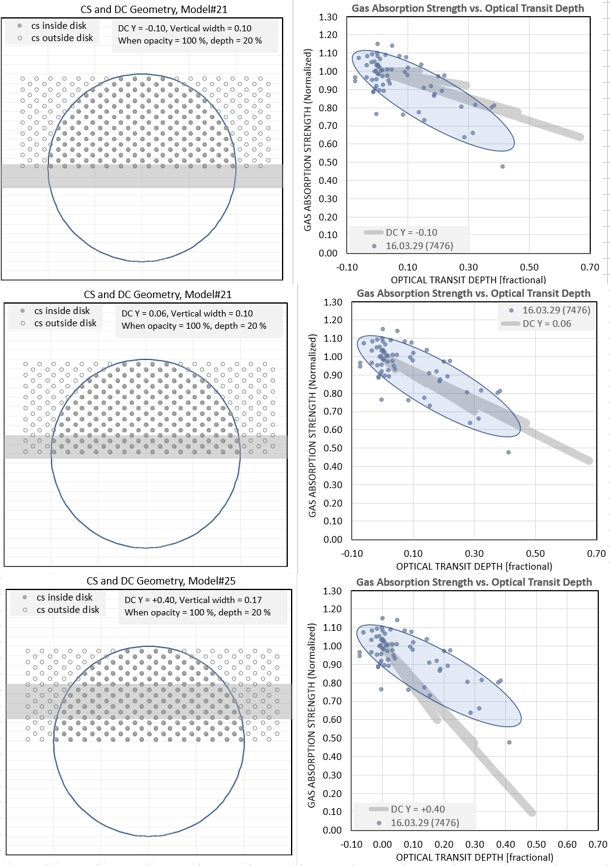
Figures 10a. Solving for geometry of dust clouds
in relation to location of "circumstellar gas disk" for the case
of optically thick dust clouds.
[in progress]
Figures 10b. Solving for geometry of dust
clouds in relation to location of "circumstellar gas disk" for
the case of optically thin dust clouds.
If dust clouds typically have high optical
depth they must be located near the WD equator and be narrow in
vertical thickness. If they are optically thin then they must
extend across much more of the WD disk. .
Sample Format for Physical Model
Description
Here's an example of what I think a physical model description might
resemble.
There are 6 asteroids with Kepler periods A to F that are in
orbits that have shrunk to their WD's Roche radius. Their rotation
and revolution are synchronous, causing the WD sub-solar "hot
pole" to be hotter than the sublimation temperature of some
minerals. Depressions are a few 100 K hotter than surrounding flat
surfaces, and the heat wave penetration at these locations causes
isolated pockets of sublimation-driven ejection of overlying rock
fragments and regolith. Even small ejection velocities will cause
material to "drift away" into new orbits because the Hill sphere's
surface is close to the asteroid surface. The opposite side will
be a "cold pole" and will not experience sublimation jets; for
this reason there will be far fewer fragments drifting away from
the L2 "cold pole" location into orbits larger than the asteroid's
orbit compared with the number of fragments drifting away from the
L1 "hot pole" location into orbits smaller than the asteroid's
orbit.
The large number density of fragments in orbits adjacent to
and inside the asteroid's orbit mean that large fragments
sometimes collide. If the collision debris is ejected
isotropically from the collision site all debris particles and
sub-fragments will be in orbits that have three components: 1)
ejected up or down (inclined orbits with unchanged period), 2)
ejected in or out from the WD (eccentric orbits in same orbit
plane and same period), and 3) ejected forward or backward along
the orbit (same orbit plane but different periods). All debris
will be in orbits that come together twice per orbit, at the
collision site and anti-collision site - at least for the first
few orbits. This can initiate a cascade of collisions every half
orbit. After a few orbits the "along orbit" category of debris
will spread out along the orbit due to their different periods.
A collision will cause small particles to be ejected at
higher speeds than the large particles, rocks and sub-fragments.
The smallest particles (< 0.5 micron radius) will sublimate out
of existence due to their smallness (emissivity for thermal IR
wavelengths is low due to thermal IR wavelength being large in
relation to circumference while Bond albedo is unaffected by size
since WD radiation is at wavelengths smaller than circumference).
This will cause the outer edges of the cloud to disappear after
however long it takes for the smallest particles to "overheat" -
perhaps a few orbits or days. The cascade of collisions every half
orbit will replenish the cloud of debris with a fresh supply and
lead to a steady-state dust cloud size.
There are three size categories to consider: 1) radius <
0.5 micron, 2) 0.5 micron < radius < 300 micron, and 3)
radius > 300 micron. The smallest particles will be
short-lived, most of the light blocking capability will be with
the middle size particles and most of the mass and collision
activity will reside with the largest size particles.
There's another potential role for the largest size
particles, at least the small size end of their size range: they
can provide a cloud of particles that provide "viscous drag" for
the other particles. Consider those large size particles that are
ejected in the orbital direction (fore/aft particles). Those that
went behind ("aft" particles) will be in shorter period orbits
than those that went ahead ("fore" particles). This means that the
other particles (the up/down and in/out particles) will encounter
the slower moving "aft" particles (when they are at apoastron)
more often than the faster moving "fore" particles (when they're
at periastron). Since the slow particles will be encountered more
often than the fast particles, the net effect will be to remove
orbital angular momentum from the "up/down" and "in/out"
particles, which will cause their orbits to gradually shrink.
When the "viscous drag" by fore/aft particles cause the
other particles to come closer to the WD, their temperature will
increase and they will sublimate out of existence. With additional
orbit shrinkage, and increased heat, the minerals will separate
into elements. This disk of gas could extend inward from about 40
Rwd. Gas closer than ~ 10 Rwd is removed by some unknown mechanism
for deposition onto the WD atmosphere (magnetic field?).
The above is merely an example of what a physical model description
overview would look like. Since it's constructed by an
"observationalist" it should not be taken seriously.
I hope modelers will become interested enough to take on the
challenge of tailoring their model ideas to the WD1145 situation,
which is the purpose for this web page.
Related Web Site Links
Details for 2018/19
observing season (data exchange files for all seasons; 1-line
description for every image)
Details for 2017/18
observing season
Details for 2016/17
observing season
Details for 2015/16a
and 2015/16b
observing season
Model speculations
(based on early GB photometry observations)
My Collaboration Policy
Please don't ask me to
co-author a paper! At my age of 80 I'm entitled to have fun and
avoid work. Observing and figuring things out is fun; writing
papers is work.
All of my WD1145 observations are
in "the public domain" (as well as my analyses
of image sets by observers who have agreed to share their data
with me). If any of this is essential to a publication just
mention this in the Acknowledgement section.
____________________________________________________________________
WebMaster:
 Nothing on this web page is copyrighted. This
site opened: 2019 June 17
Nothing on this web page is copyrighted. This
site opened: 2019 June 17