4. White Dwarf WD 1145+017 Photometric Monitoring Observations by an Amateur Observer
B. L. Gary, 4 of 4 web pages, Last updated 2017.09.25 UT
1
of 4 - 2015.11.01 to 2016.01.21: LC
Observations - 1st set of LCs for 2015/16 observing
season
2 of 4 - 2016.01.17 to 2016.07.13: LC Observations - 2nd set of LCs for 2015/16 observing season
3 of 4 - 2015.11.01 to 2016.07.13: LC Observations - 3rd set of LCs, for 2015/16 observing season - Overview, Results & Model Speculations
4 of 4 - 2016.10.25 to 2017.06.18: LC Observations - 4th set of LCs, for 2016/18 observing season (you are here)
5 of 5 - 2017.10.23 to 2018.??.??: LC Observations - 5th set of LCs, for 2017/18 observing season
Status Update:
Activity has decreased to ~7% after reaching an all-time high of ~ 17% (flux lost due to dust clouds, averaged over an orbit). The "high phase" set of several dips continue to march to higher phases. My favorite dip, Dip#1, is fading to almost nothing; it has lasted at least 6.7 months (and probably 8.4 months). At least one dip drifts with a period the same as the A asteroid, and it may have 3 or 4 companions drifting with the same period (all other dips have very slow drift rates with respect to the A asteroid fragments). It seems to have disappeared a few weeks ago.
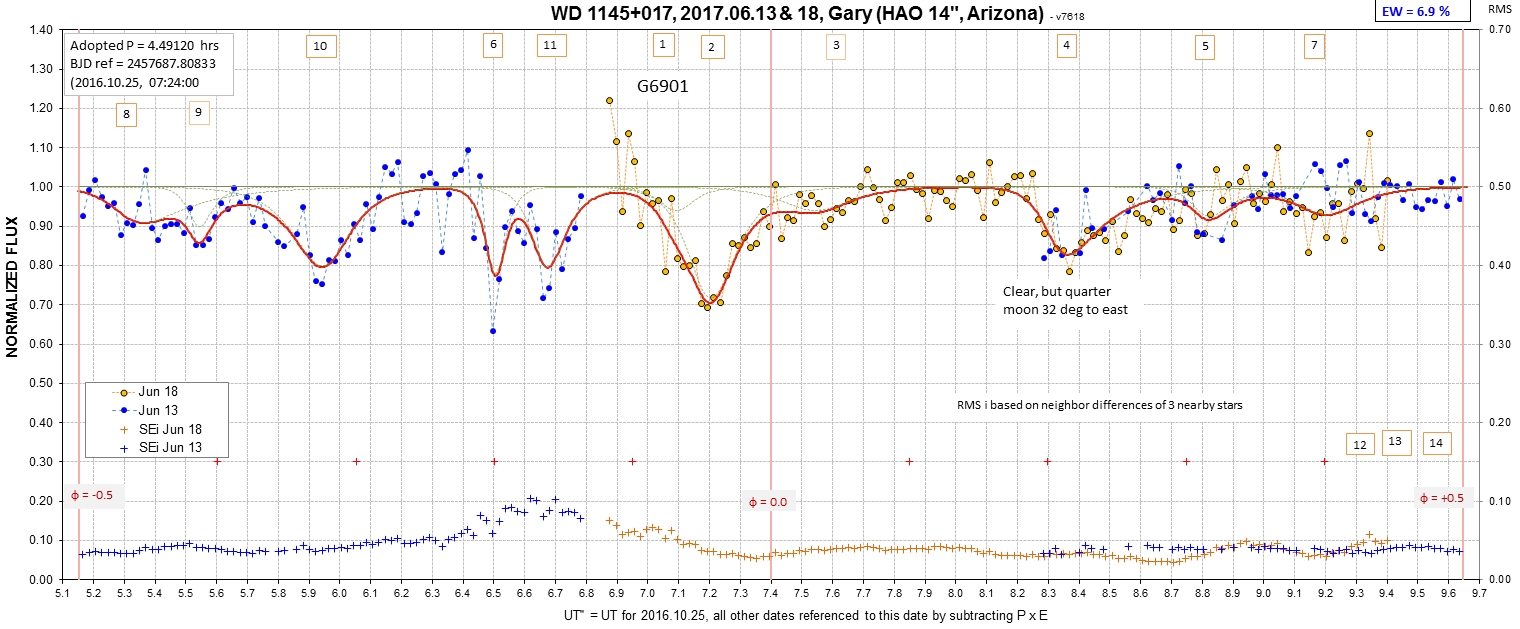
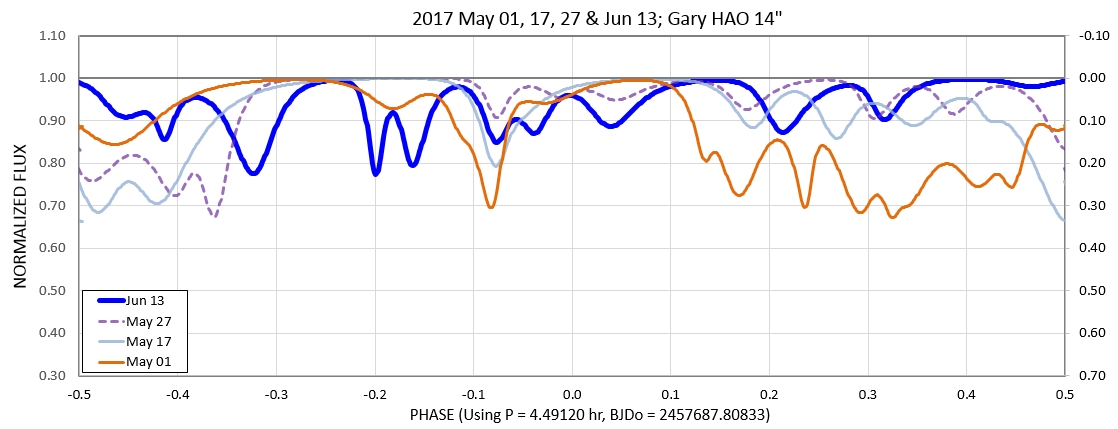
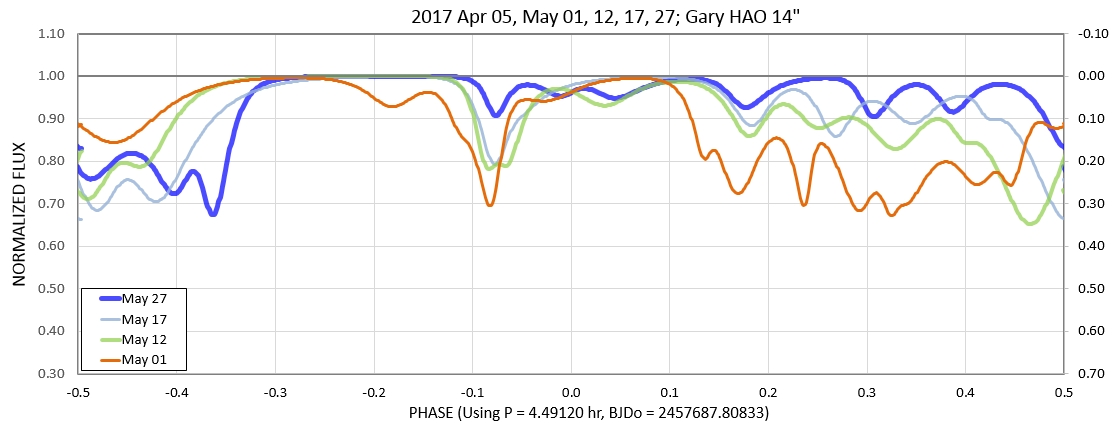
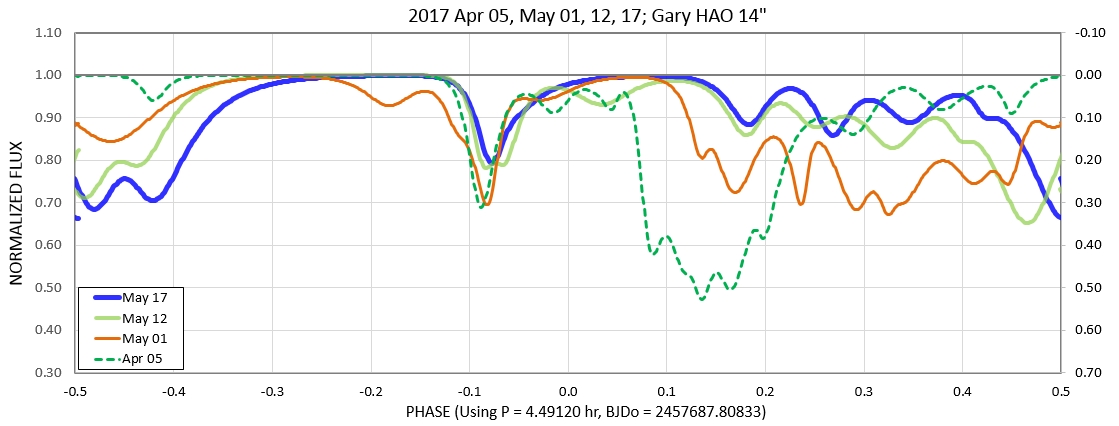
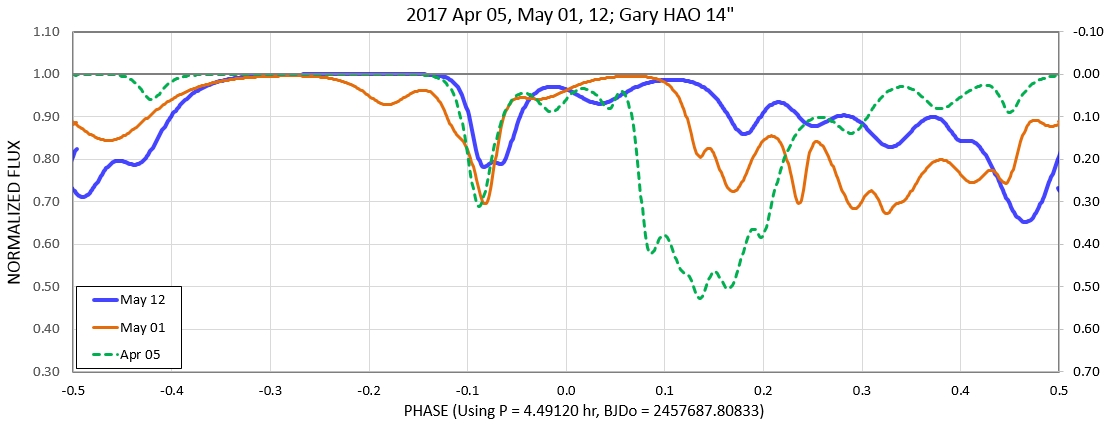
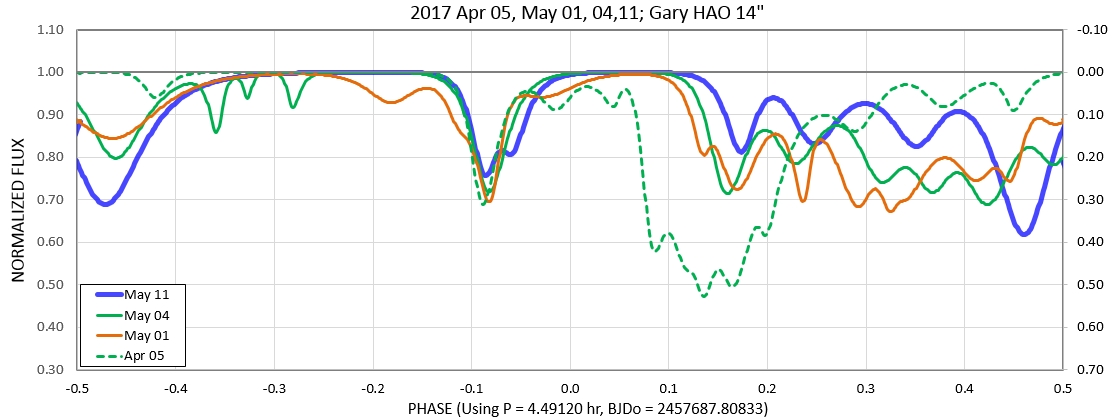
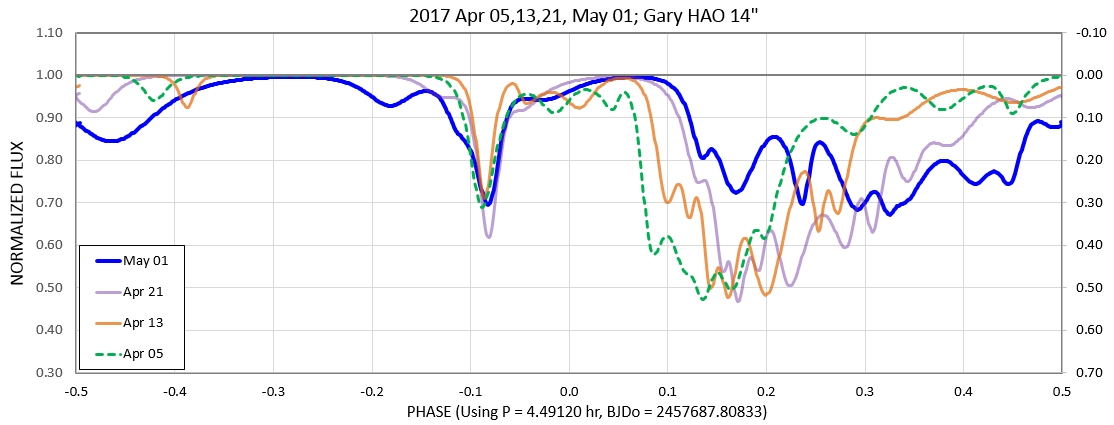
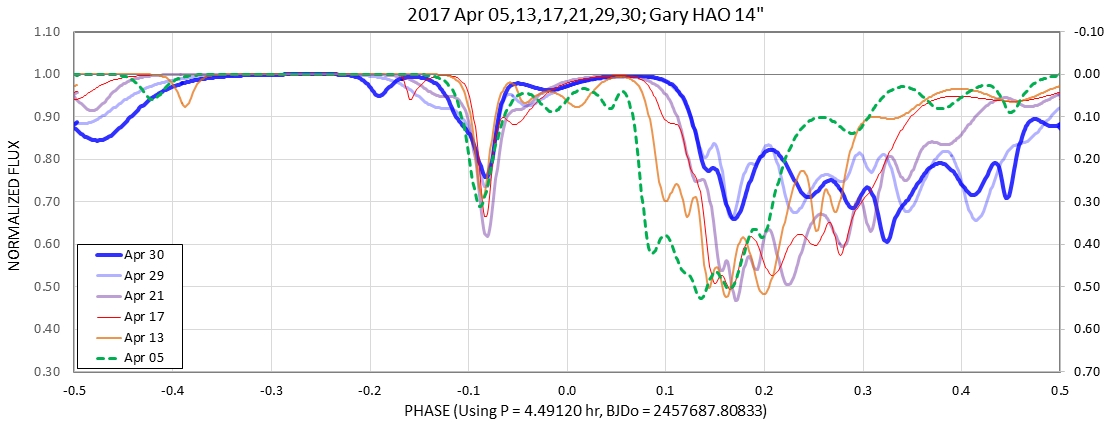
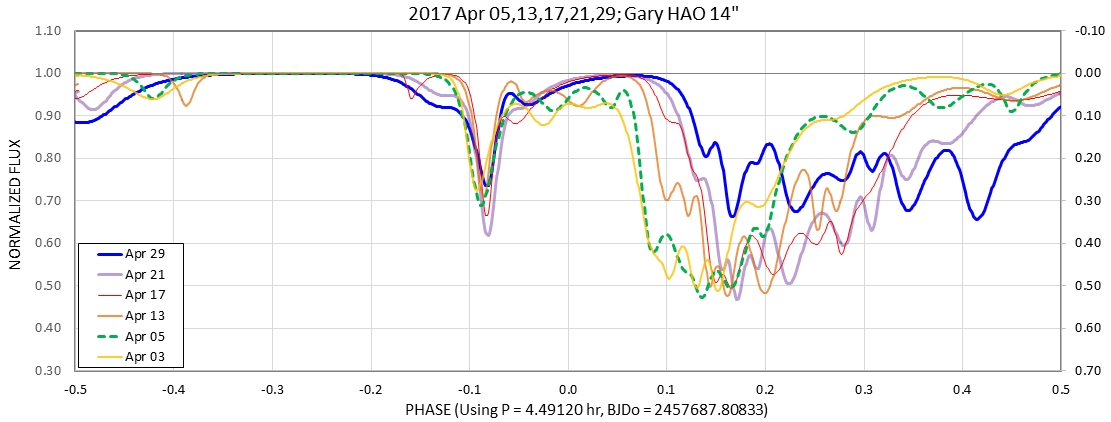
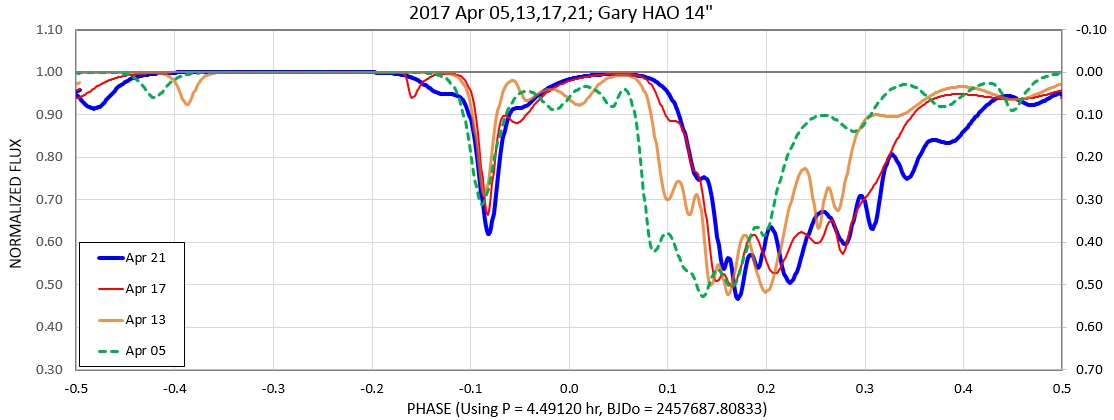
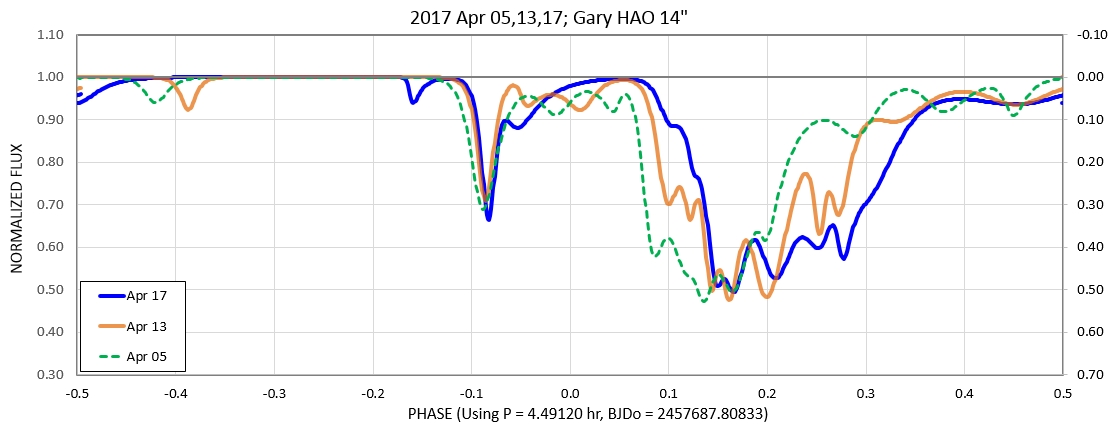
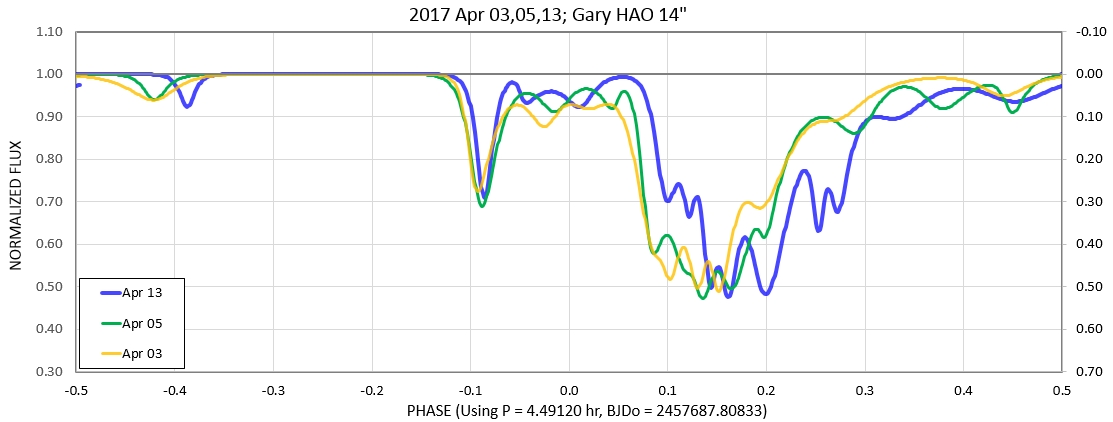
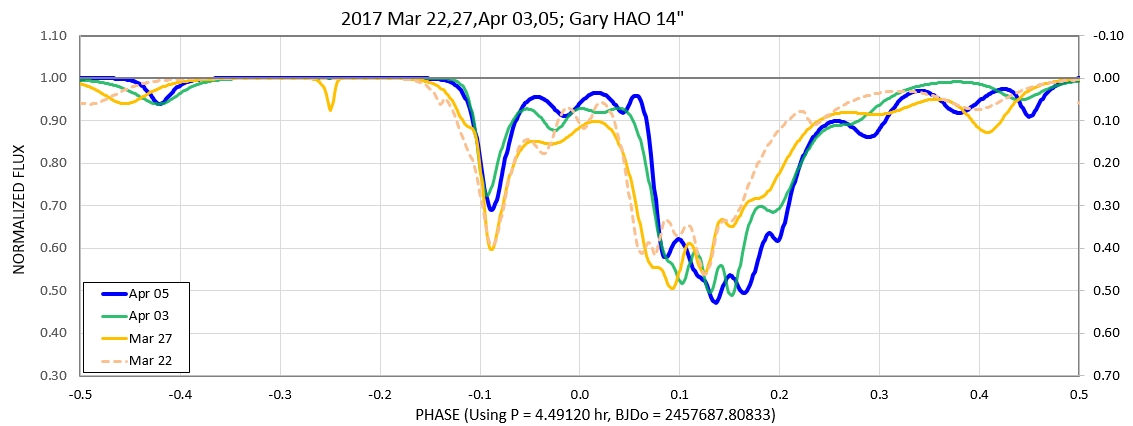
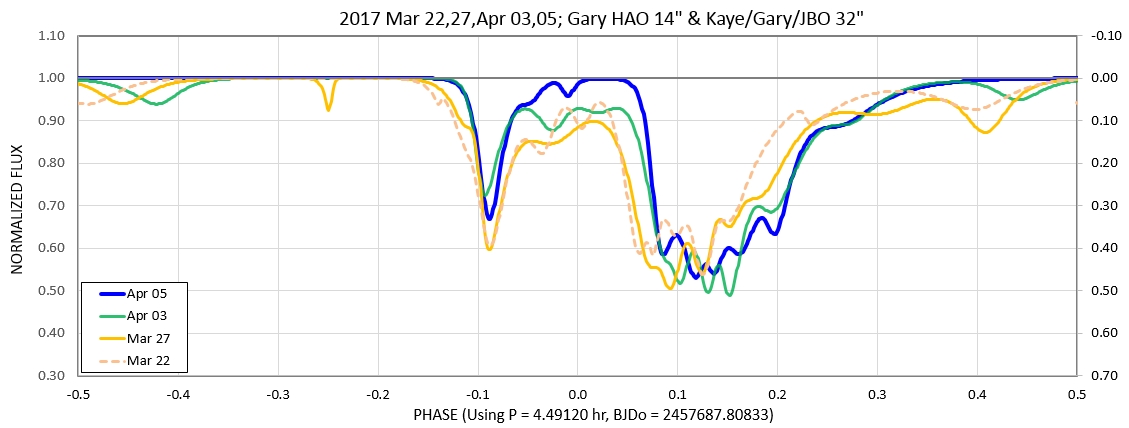
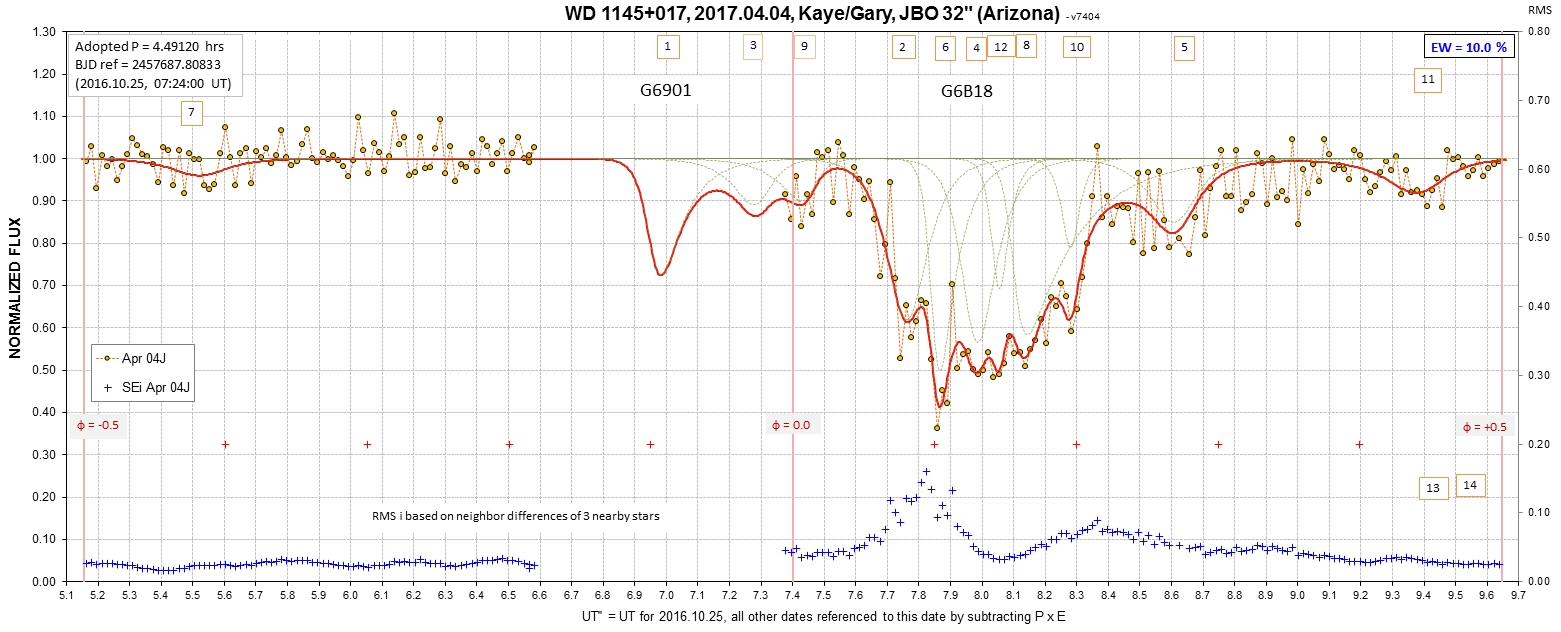
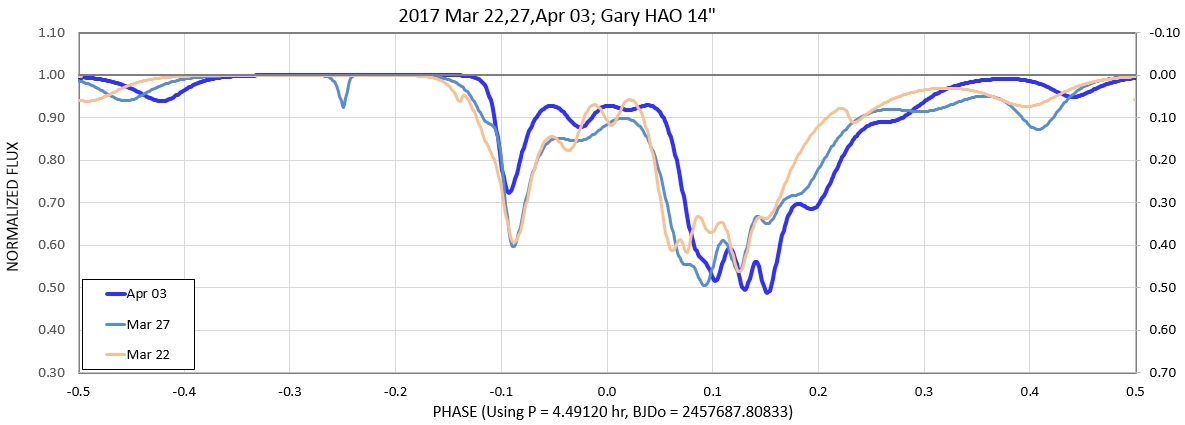
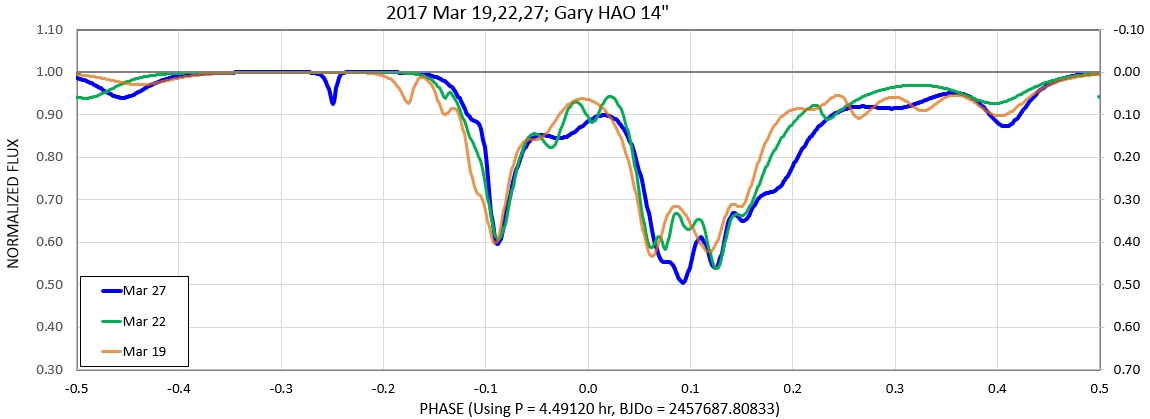
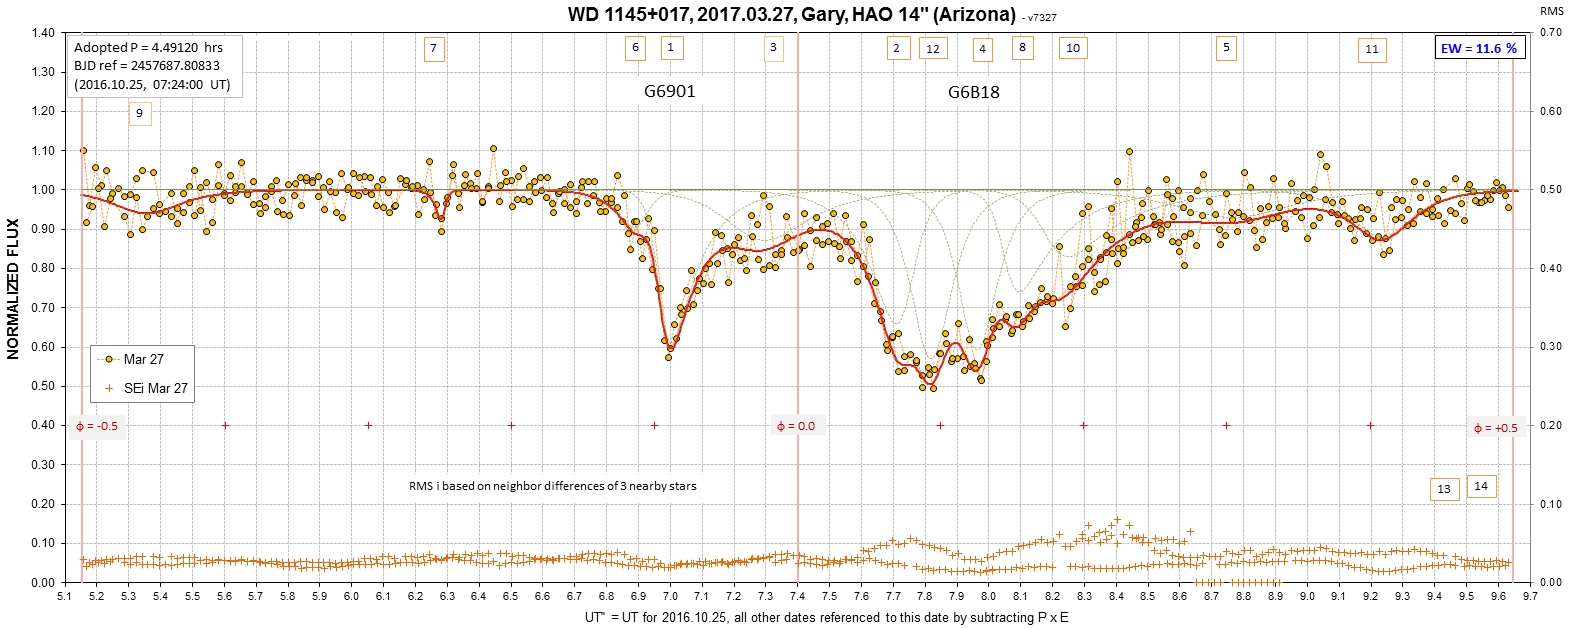
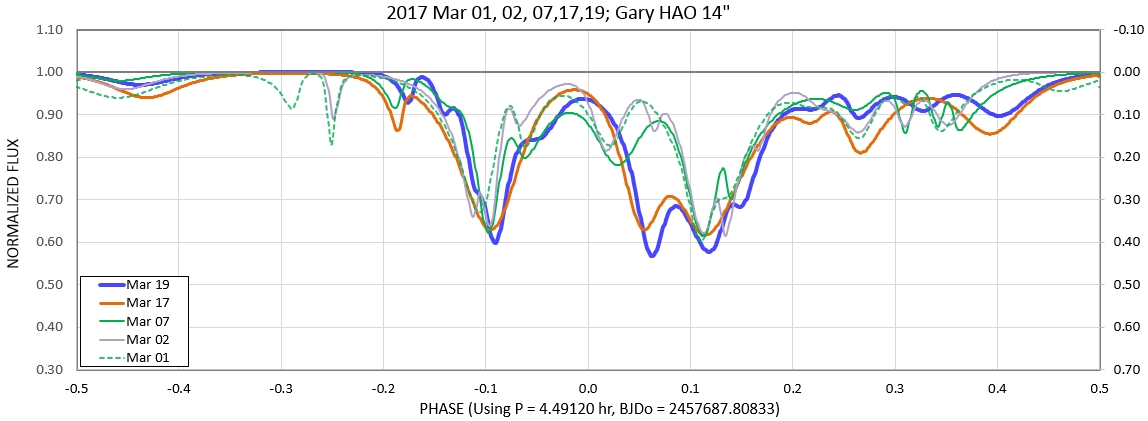
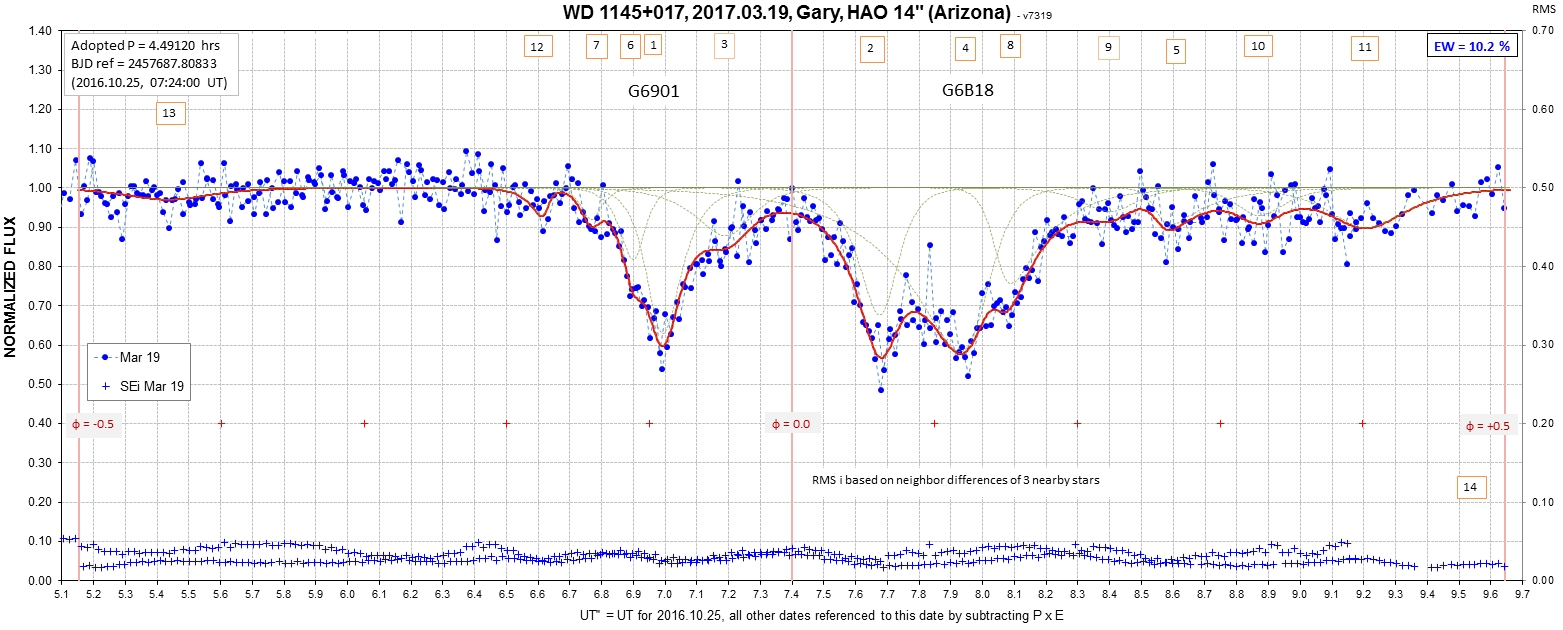
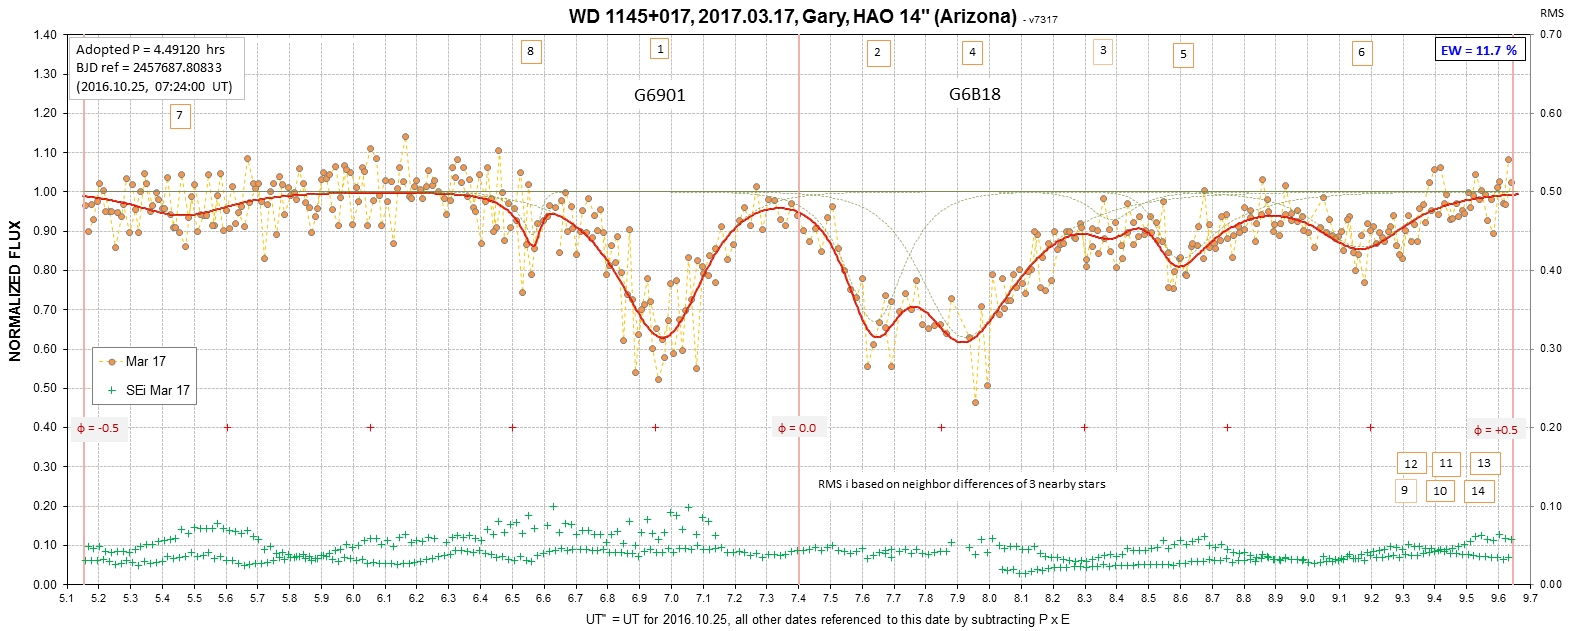
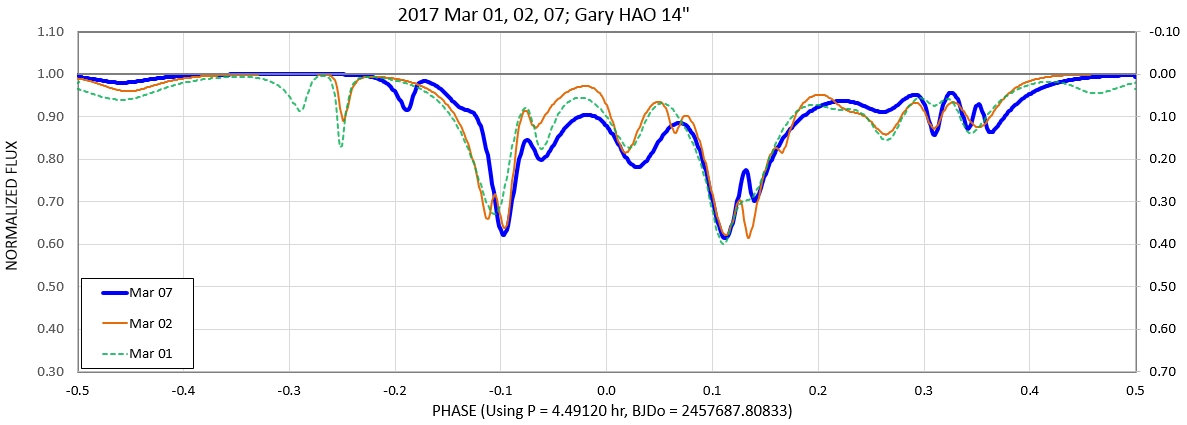
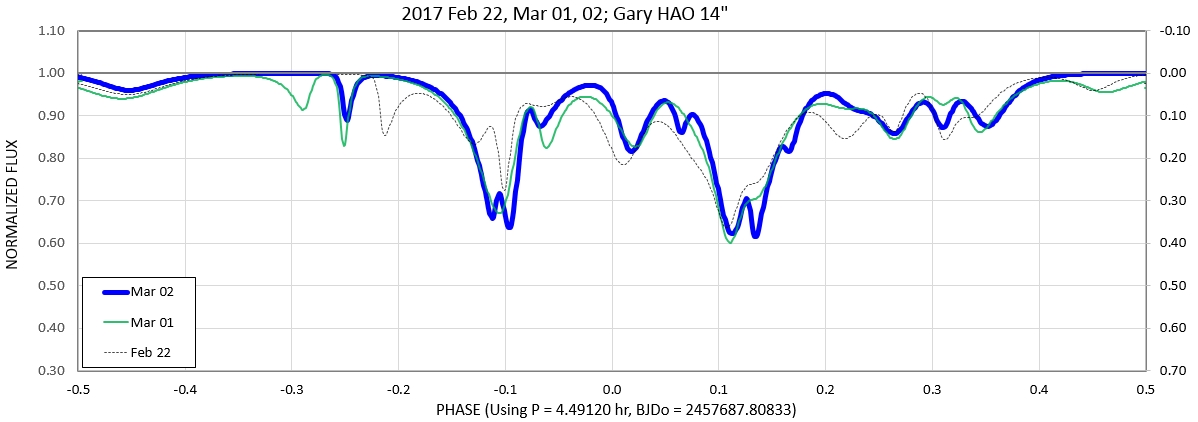
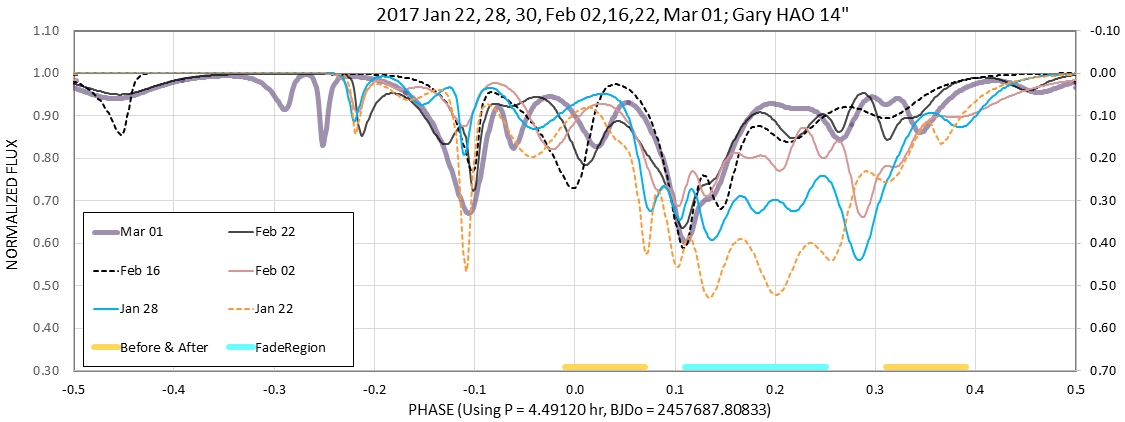
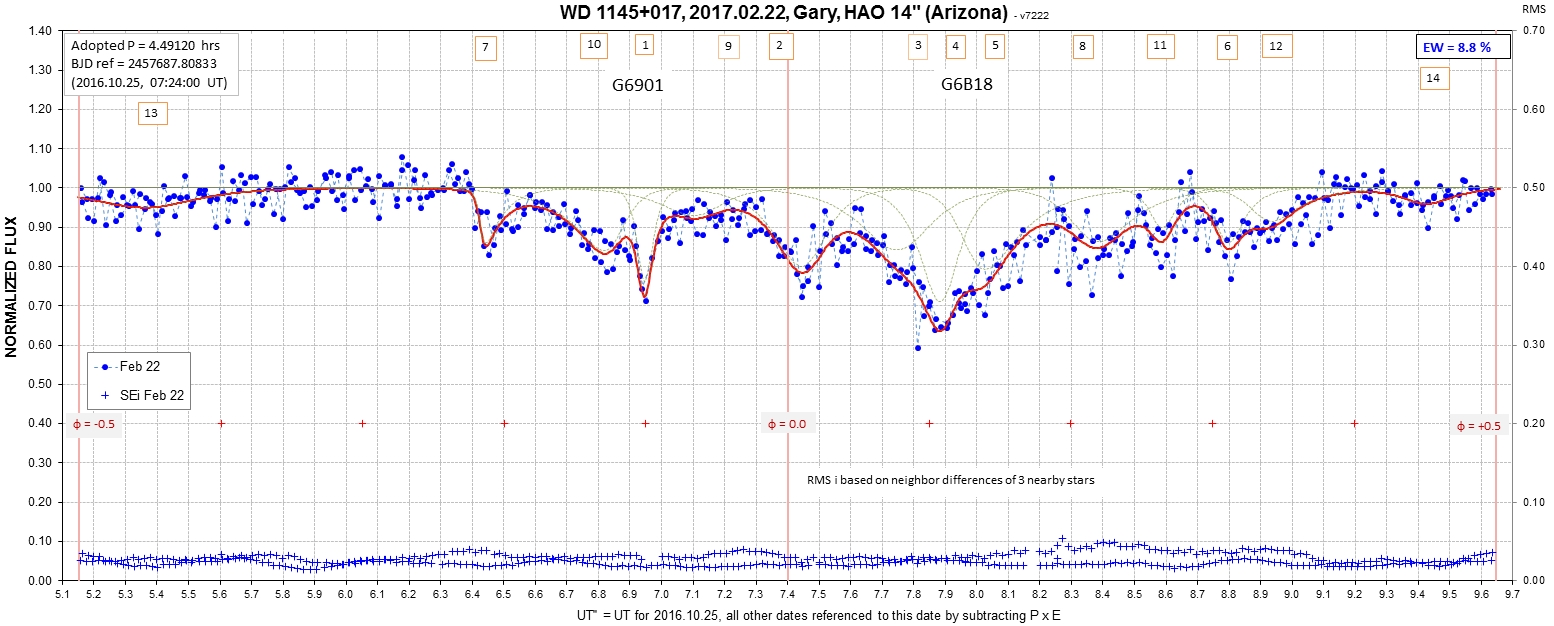
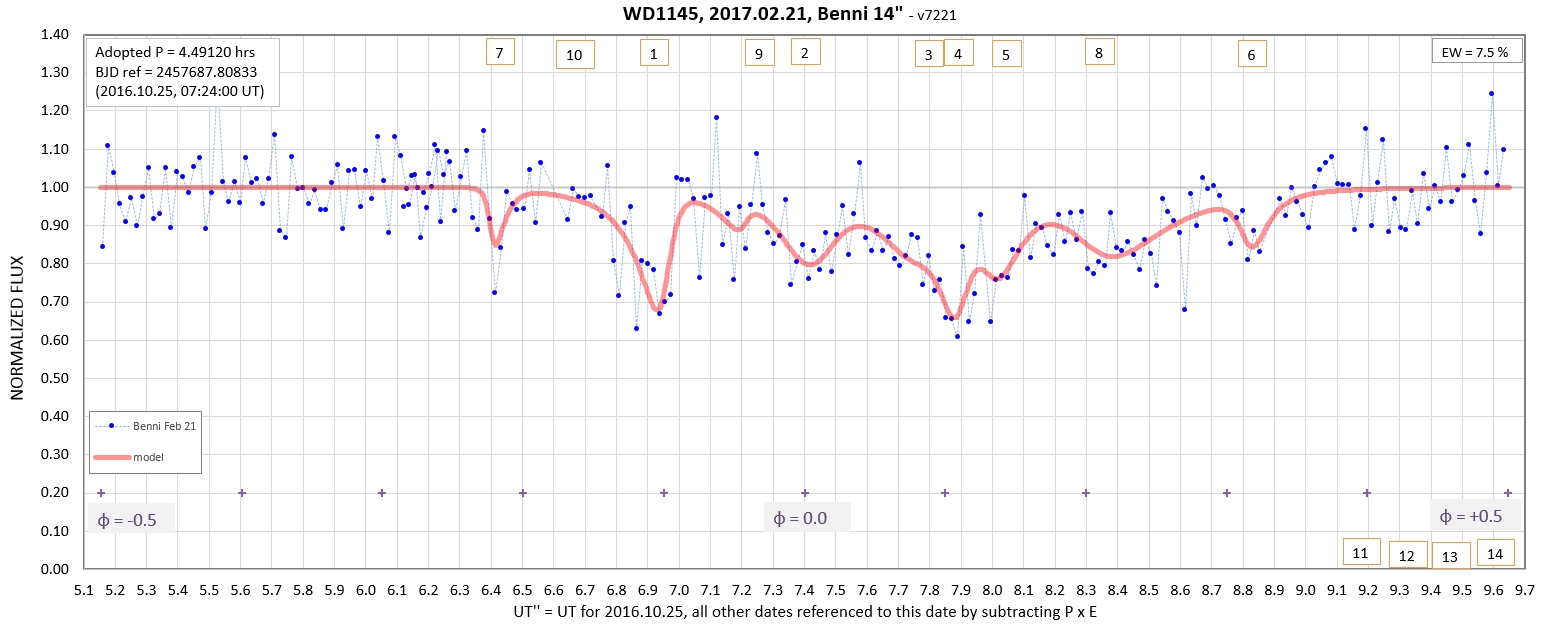
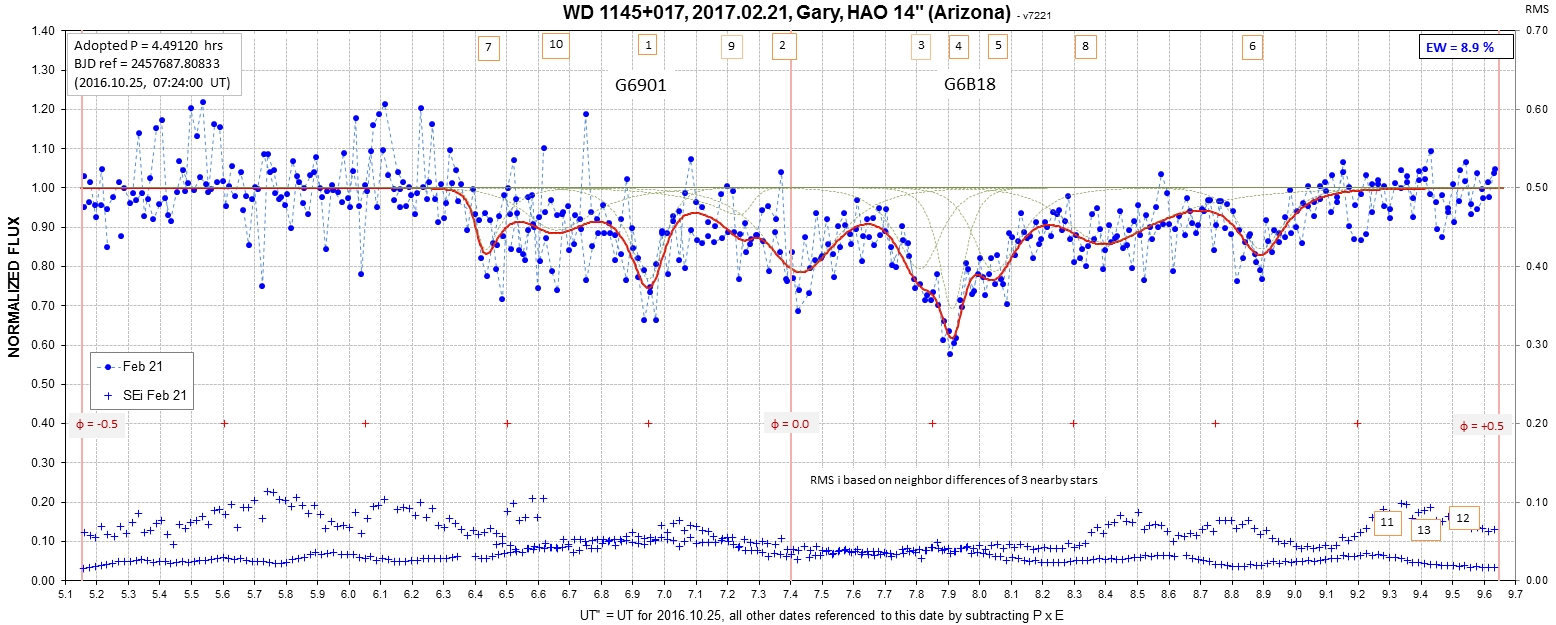
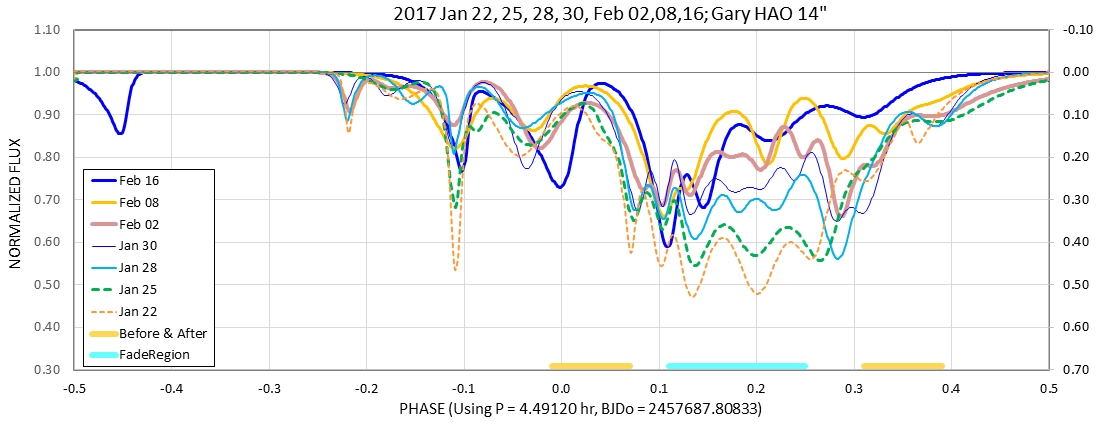
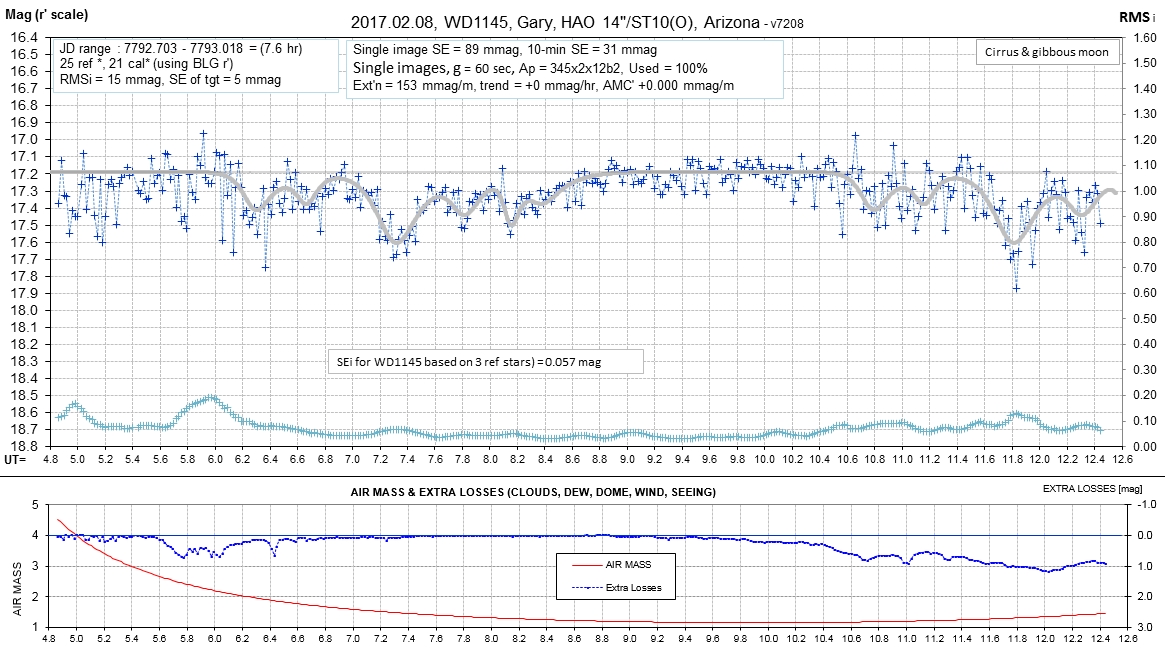
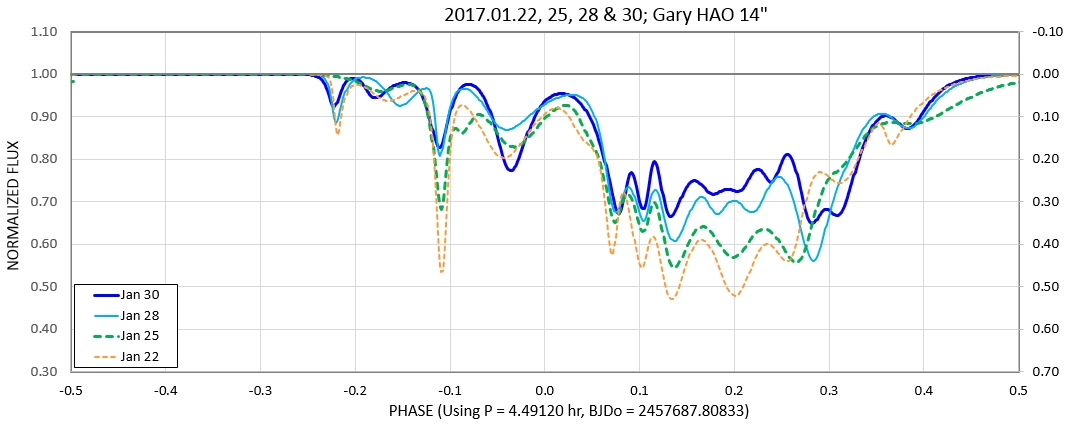
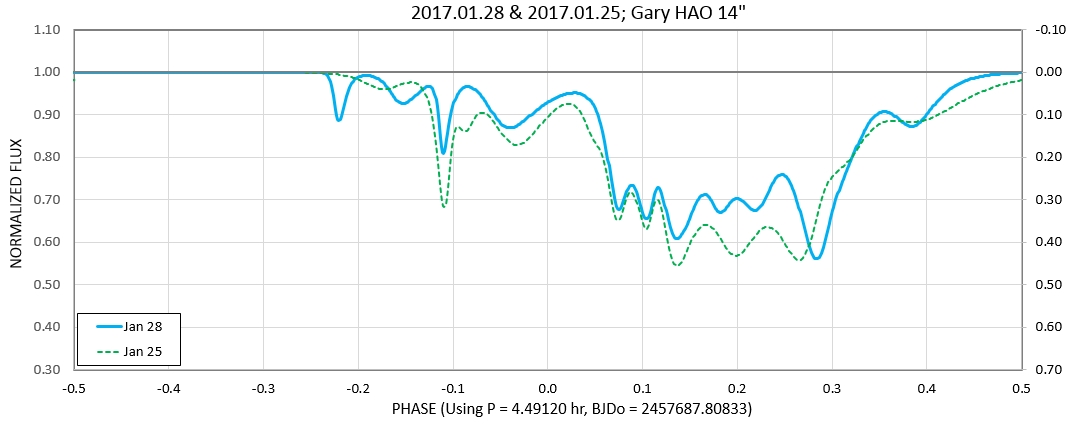
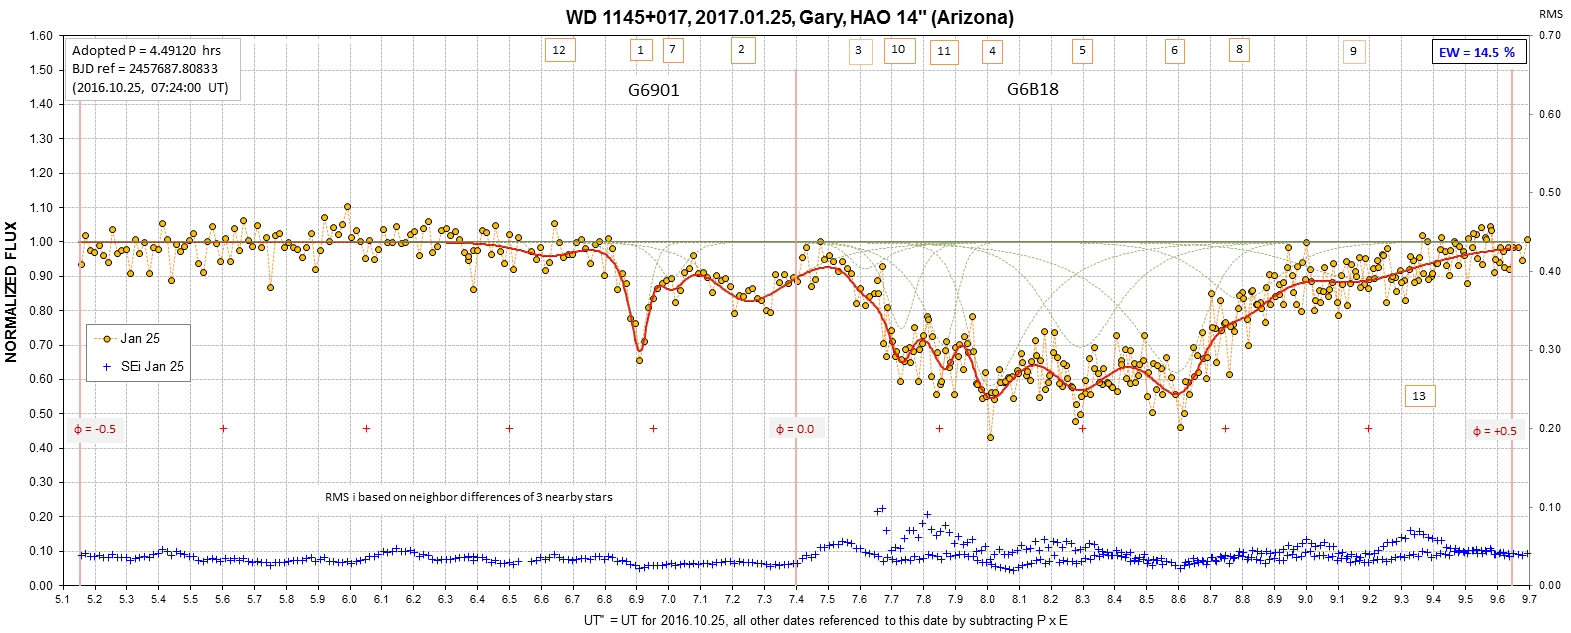
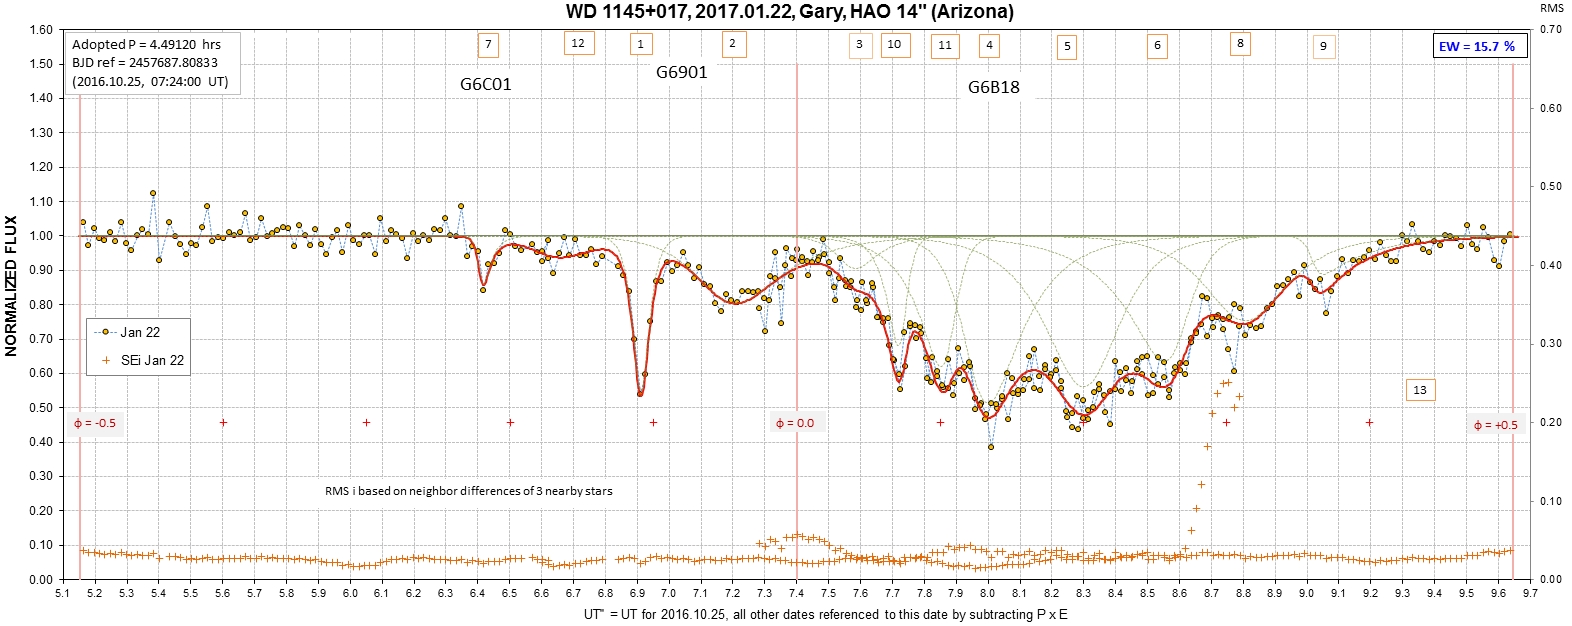
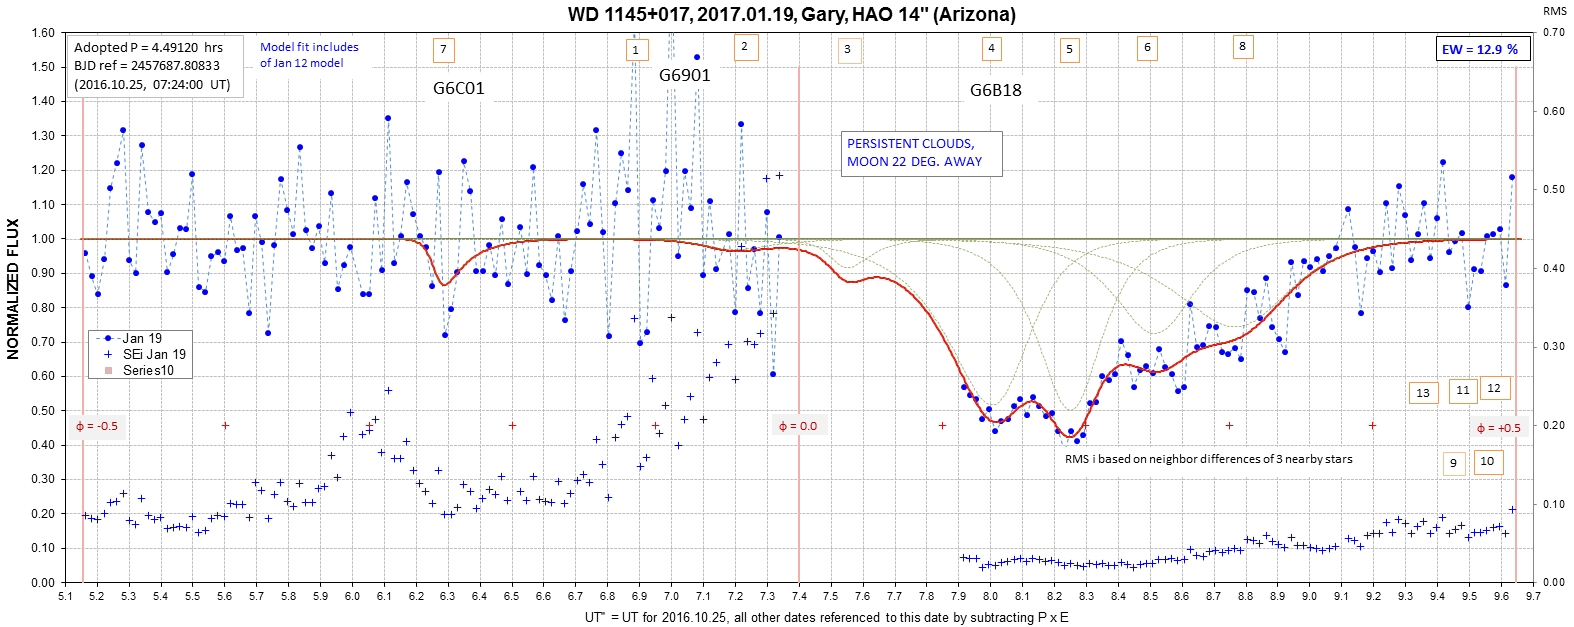
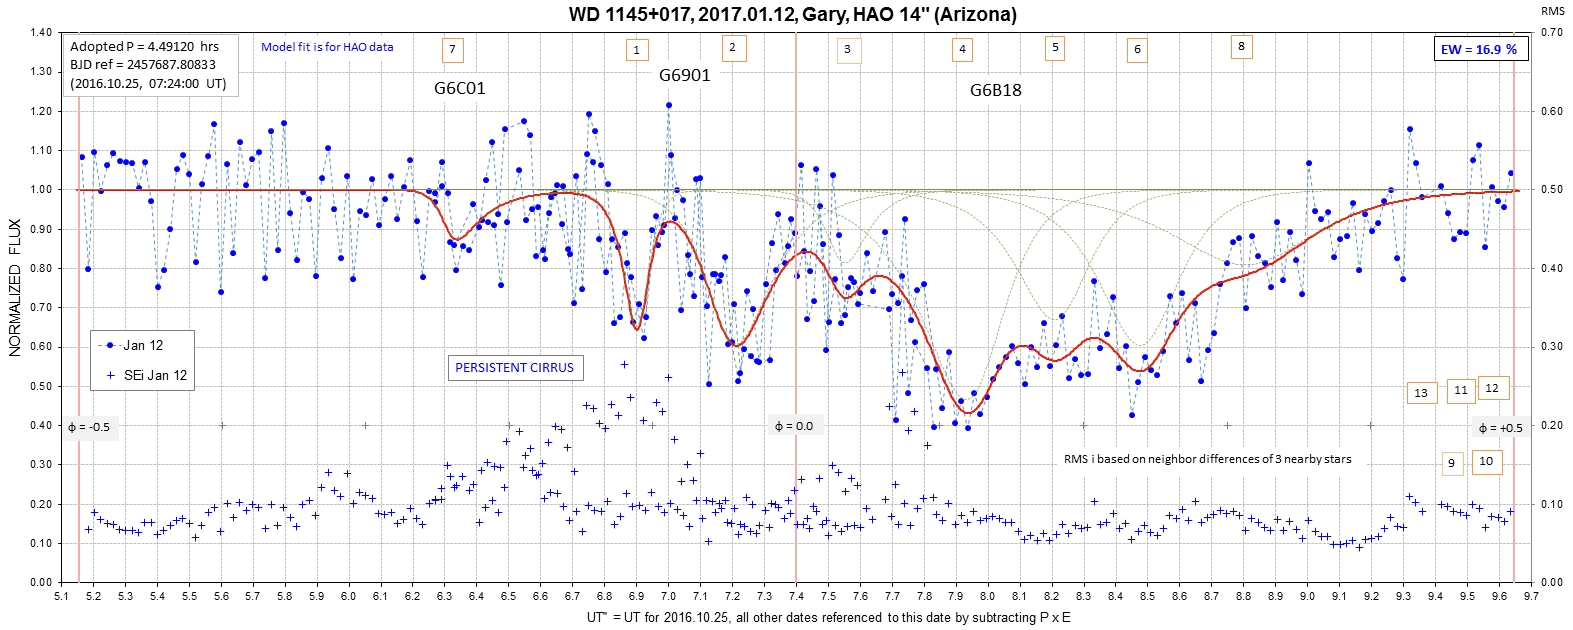
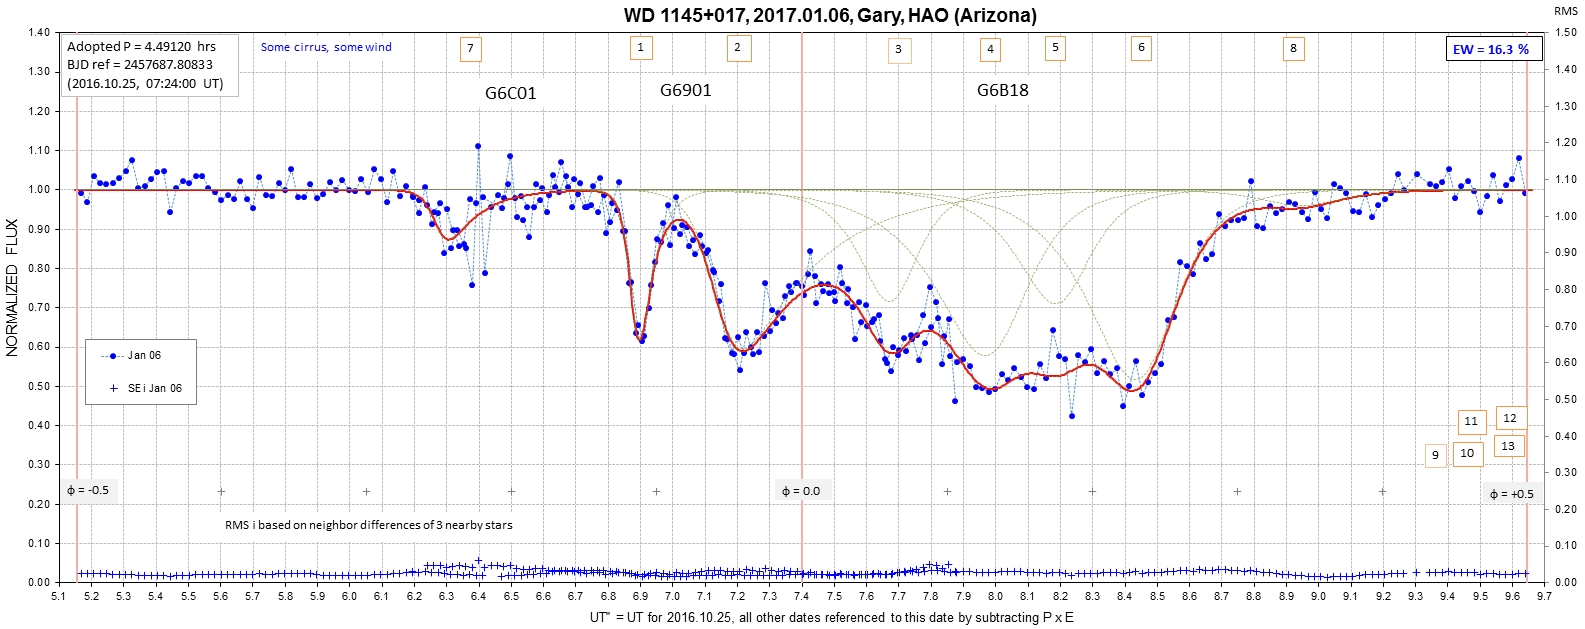
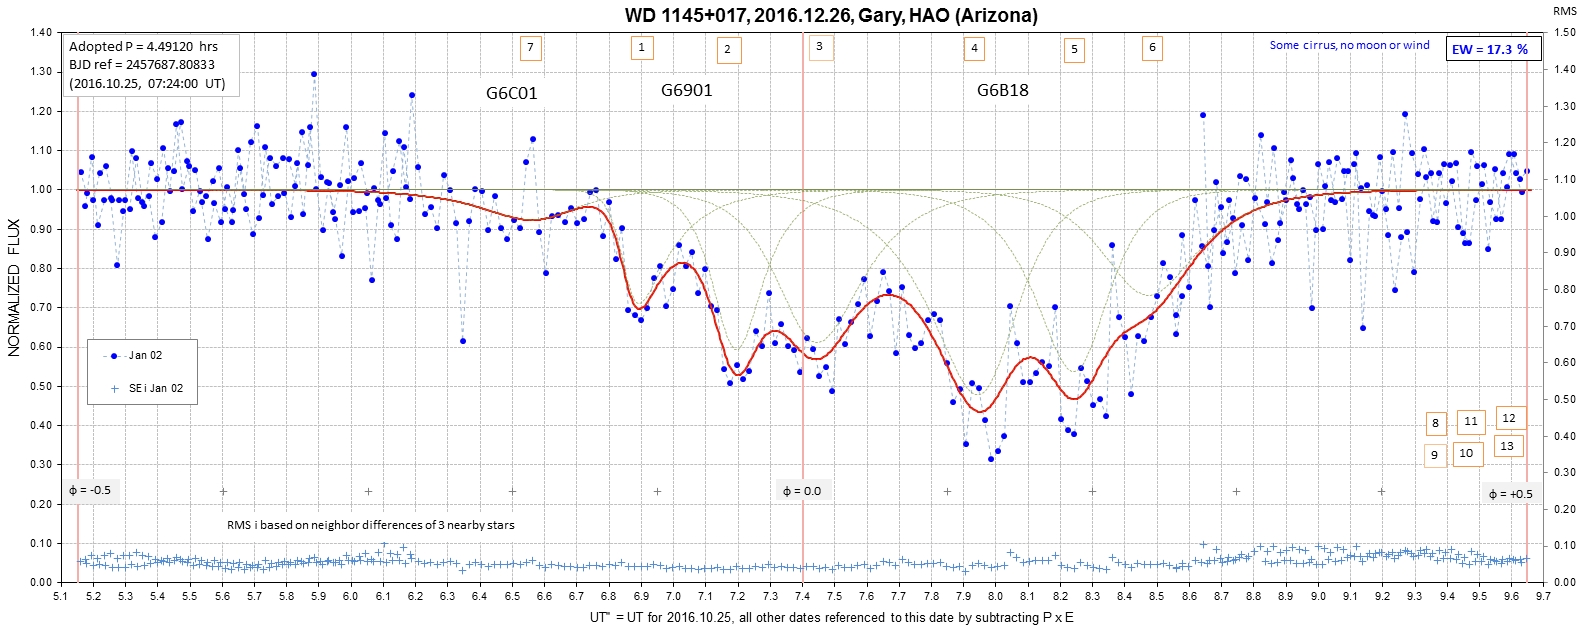
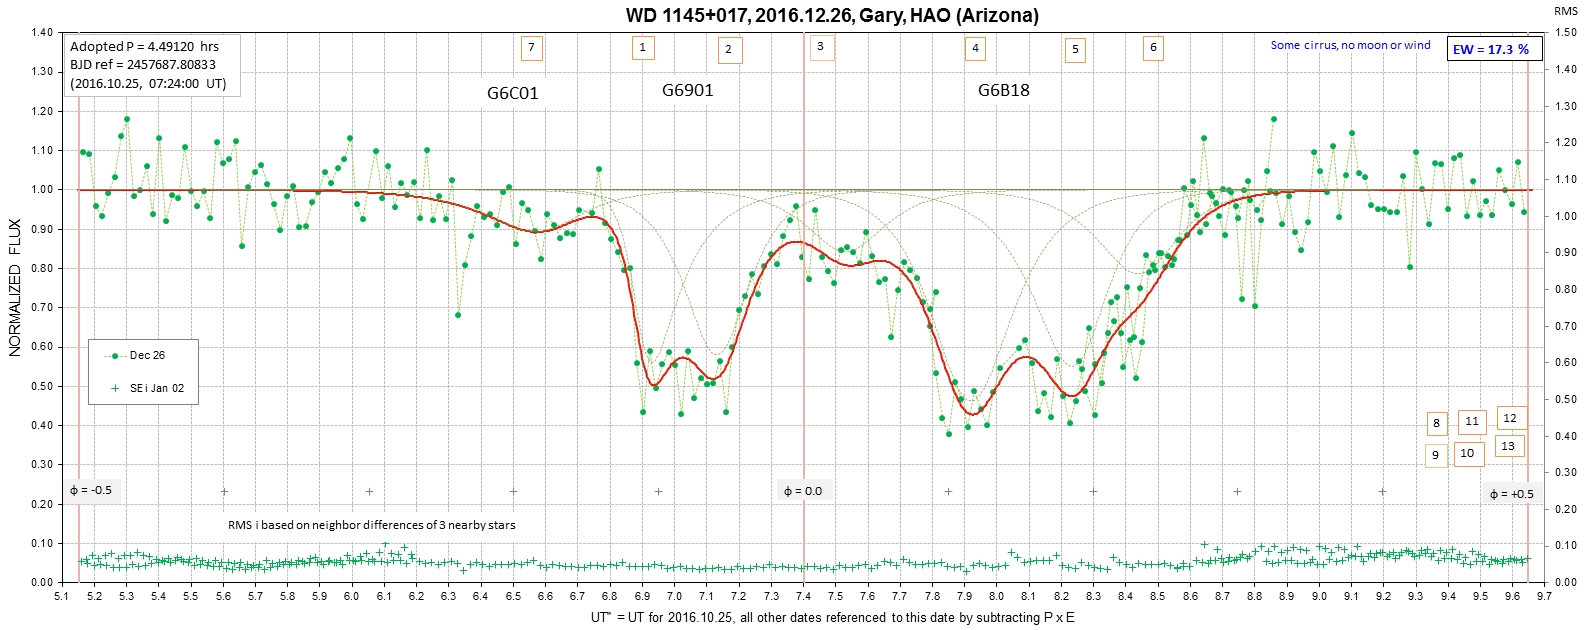
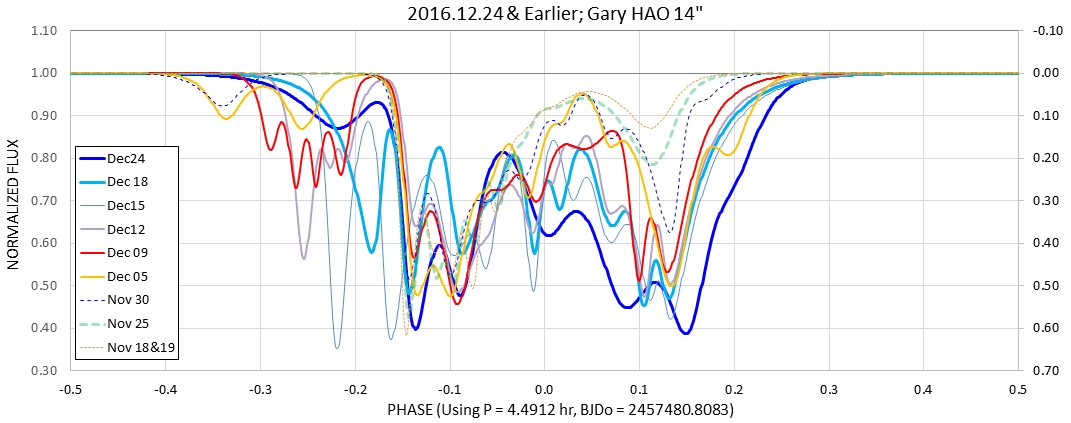
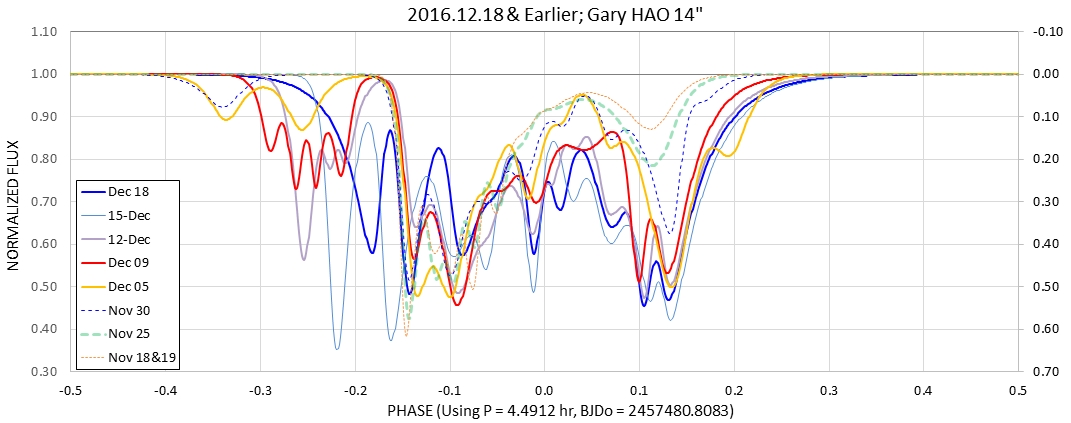
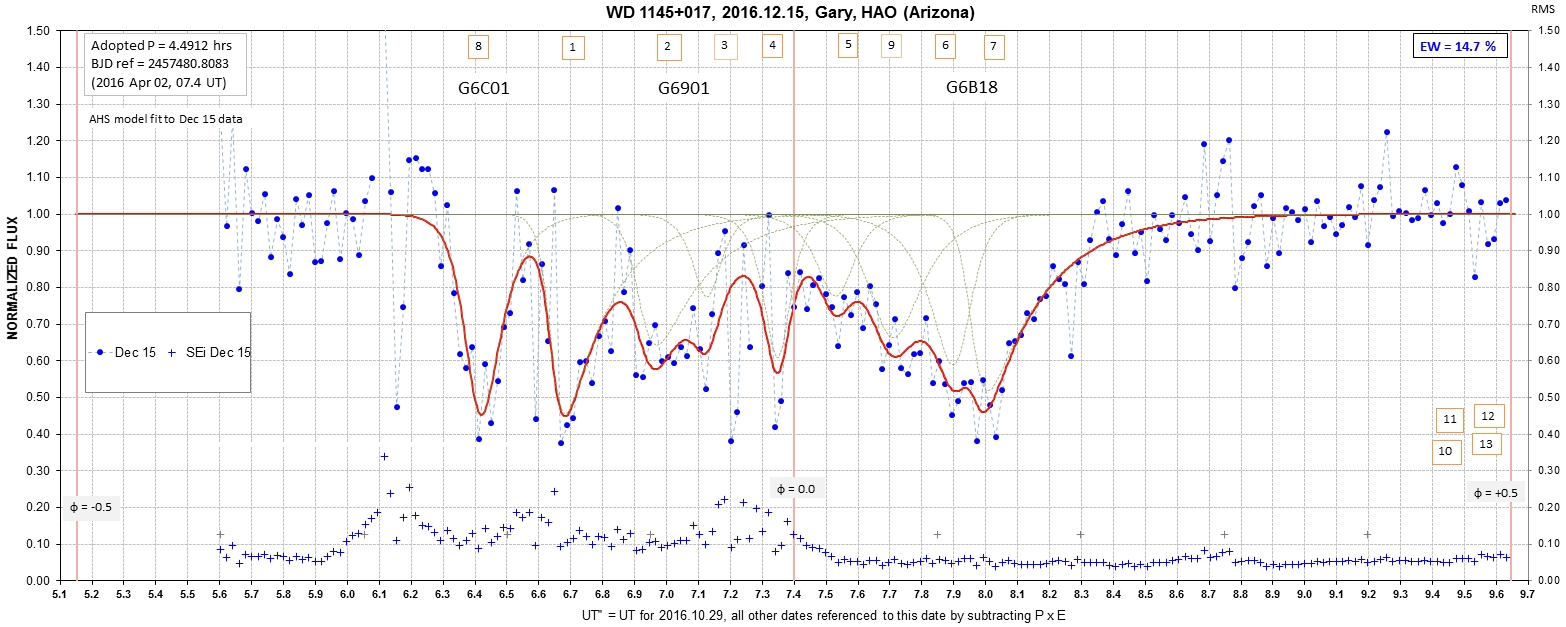
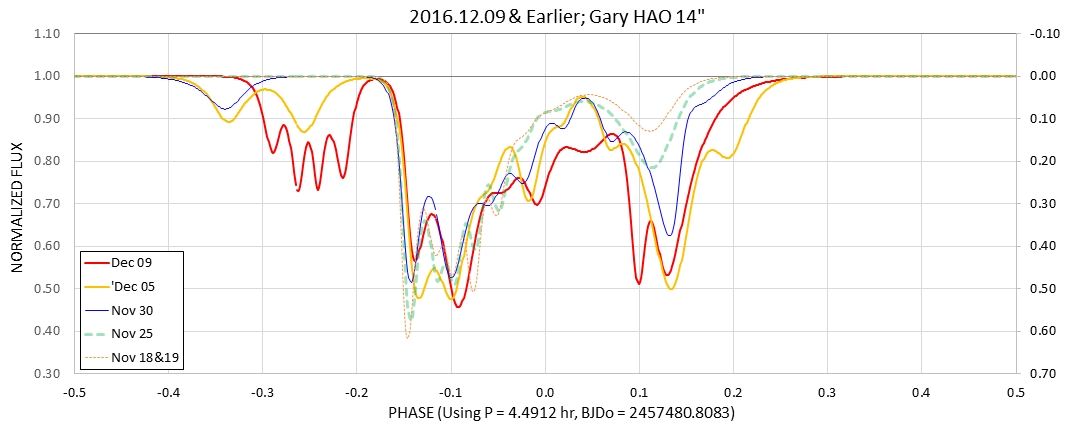
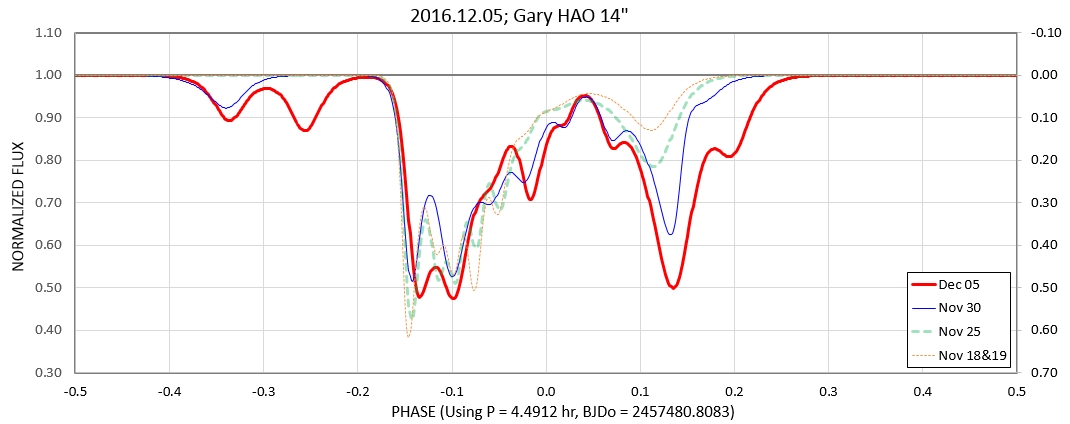
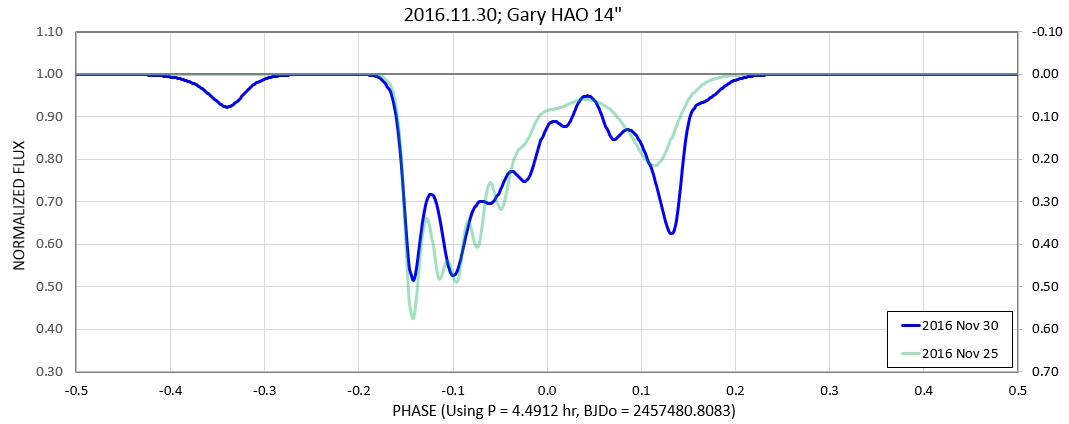
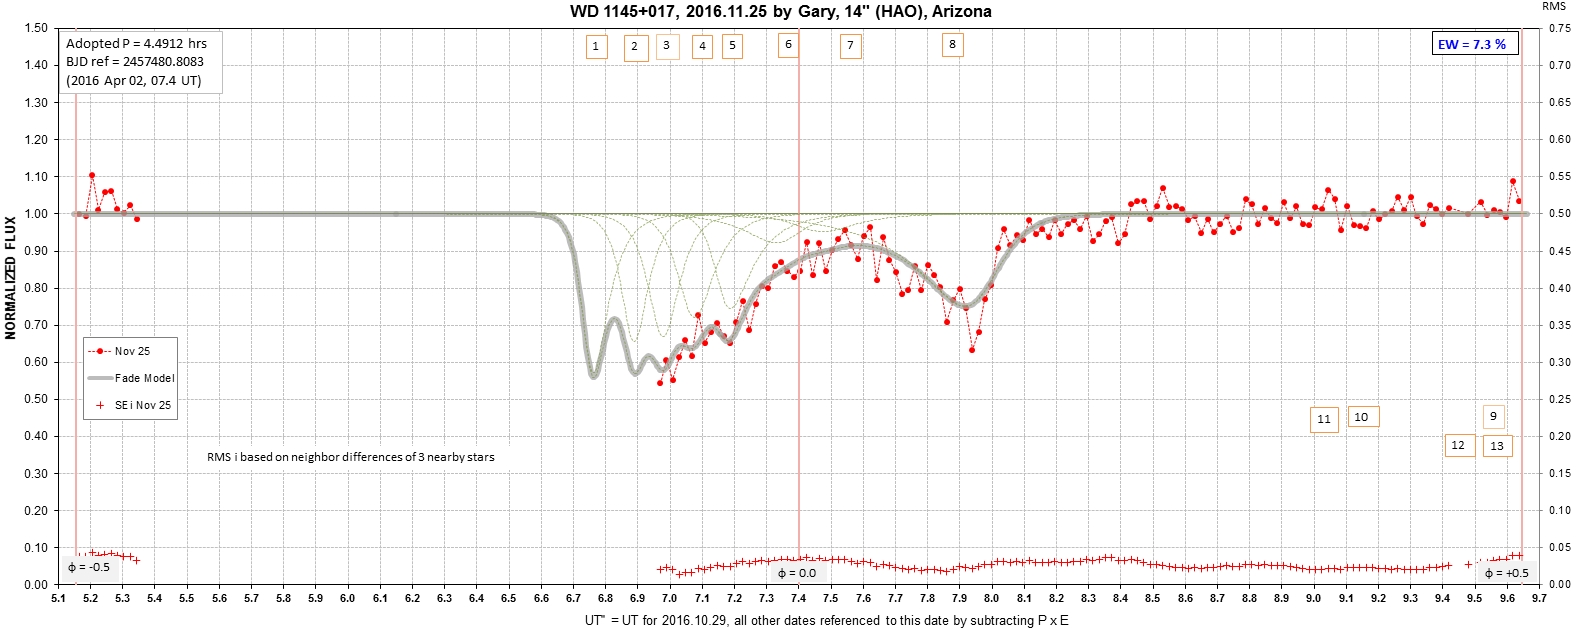
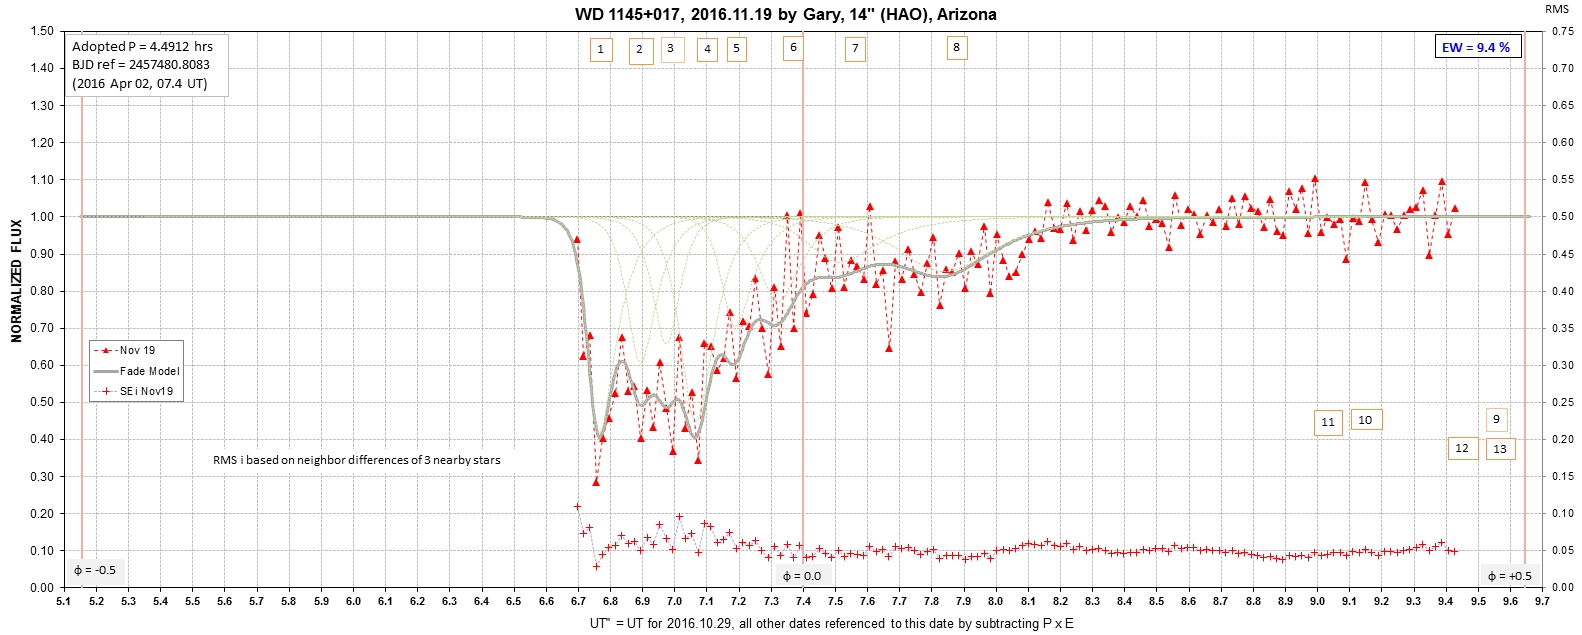
Figure 1a. Latest phase-fold LC.
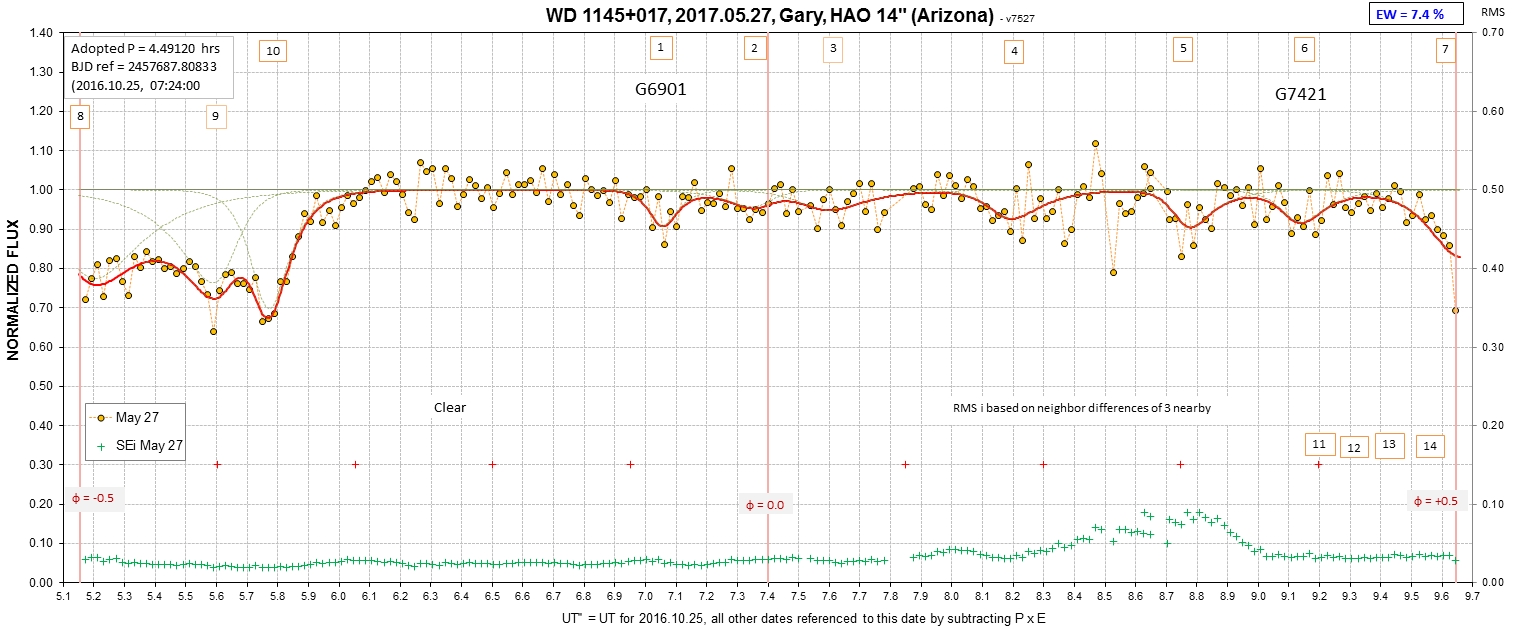
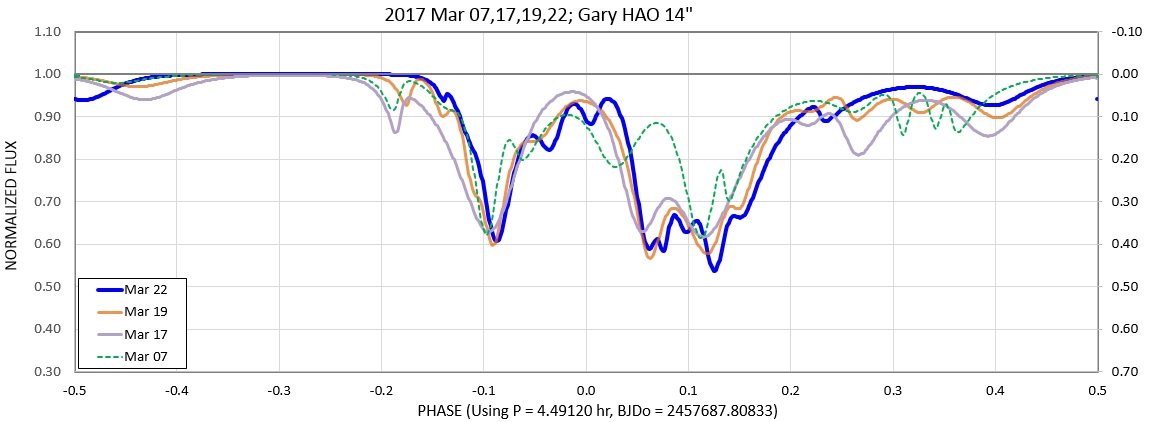
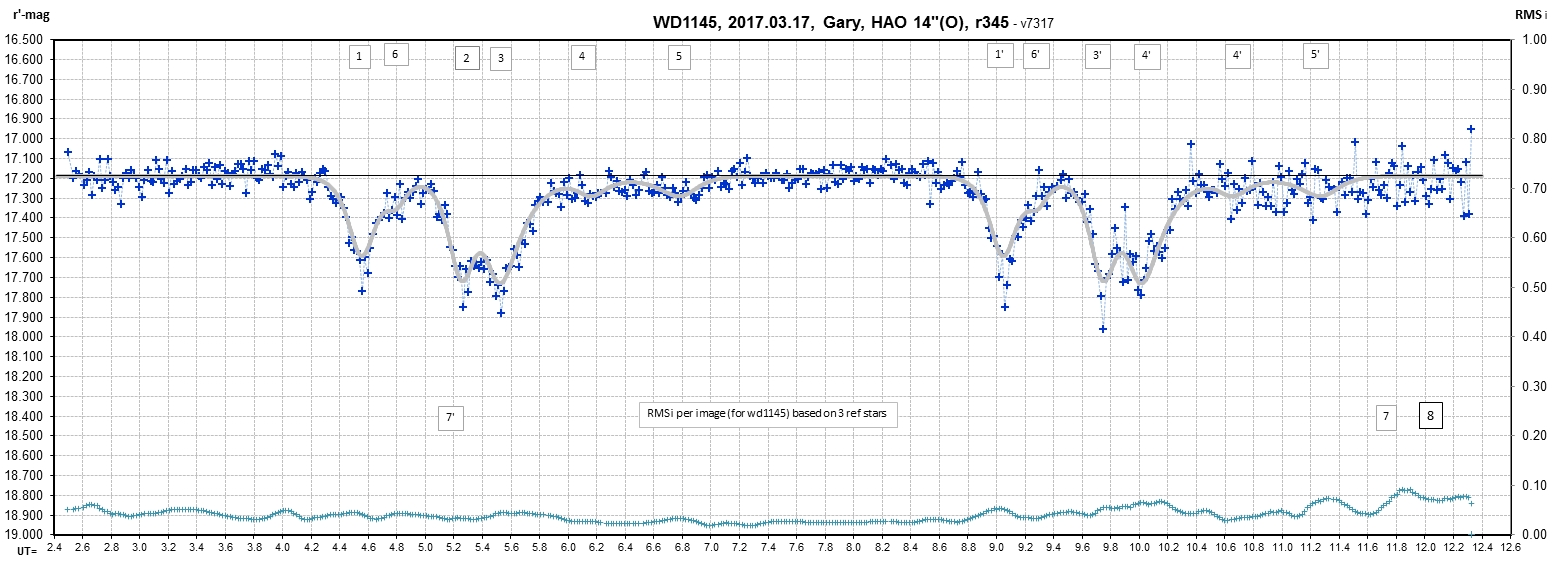
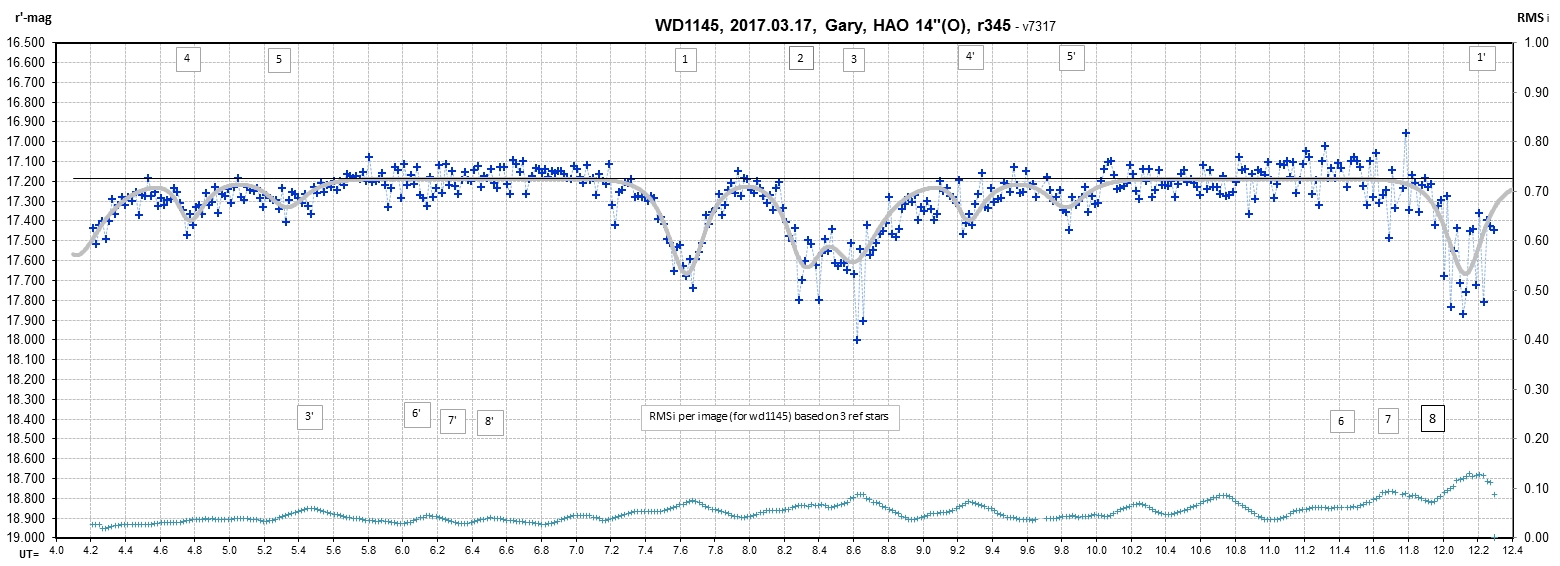
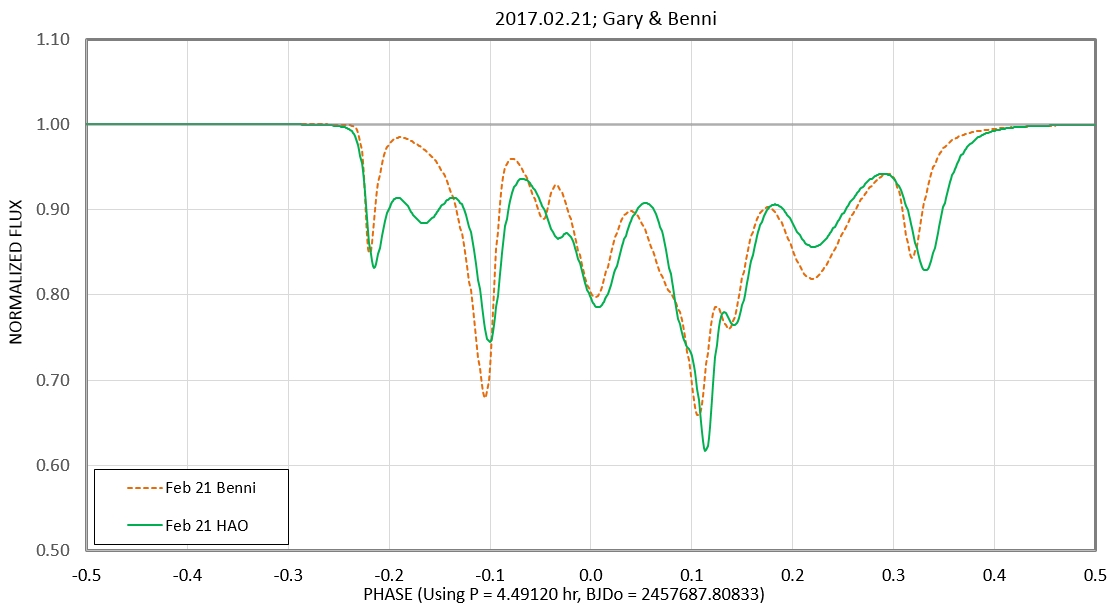
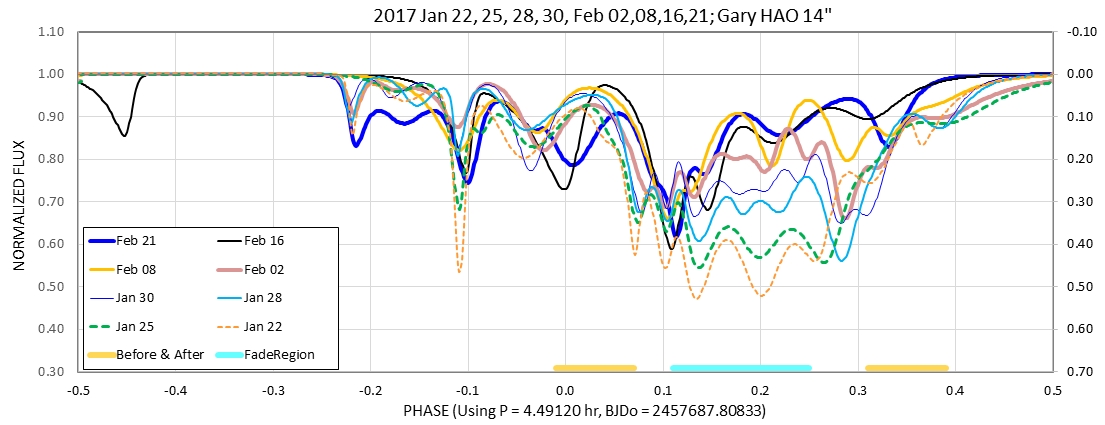
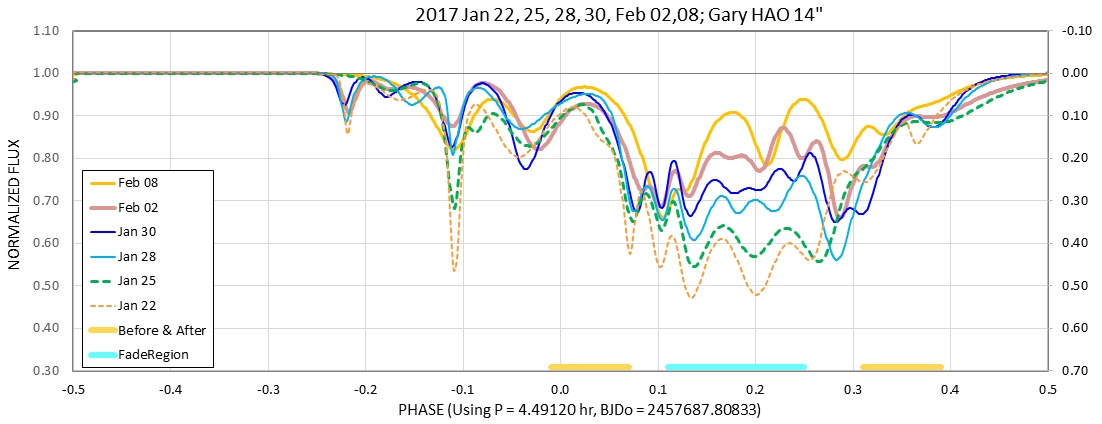
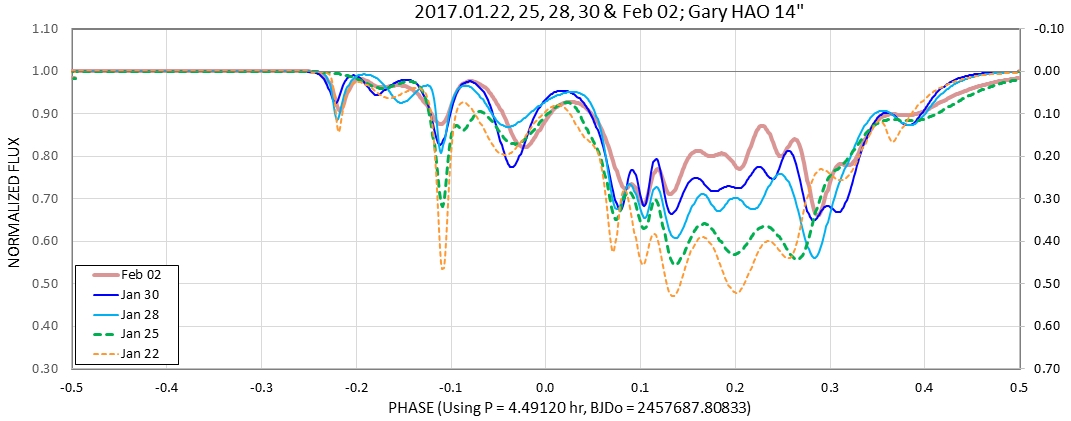
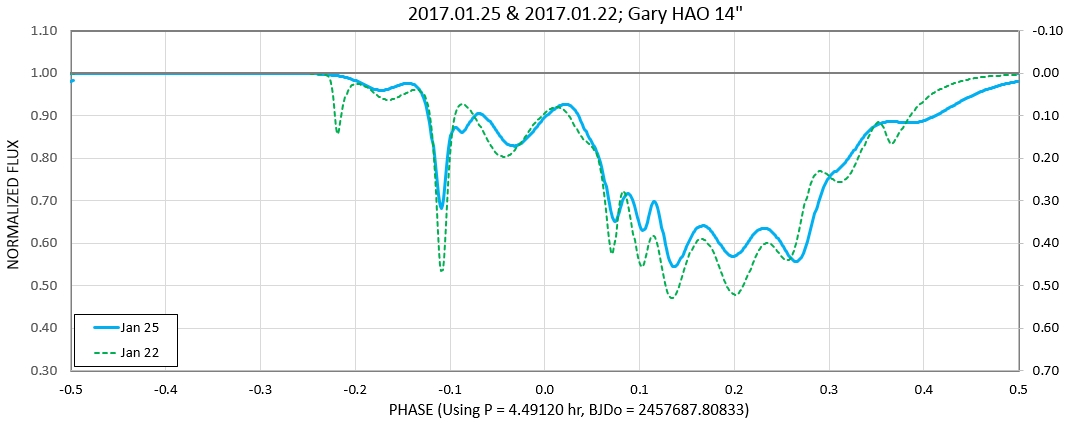
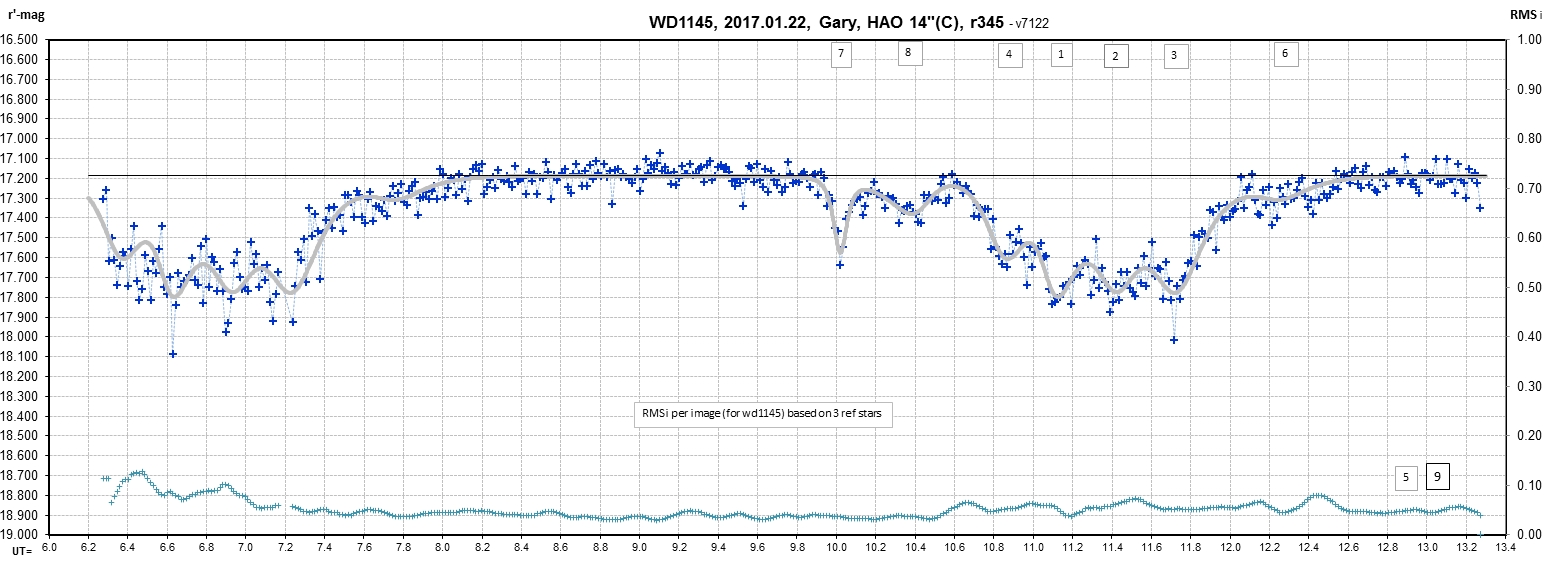
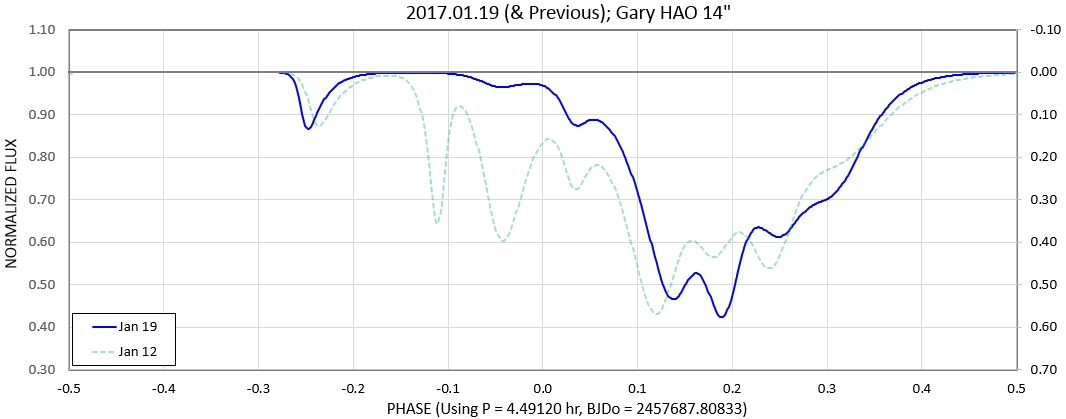
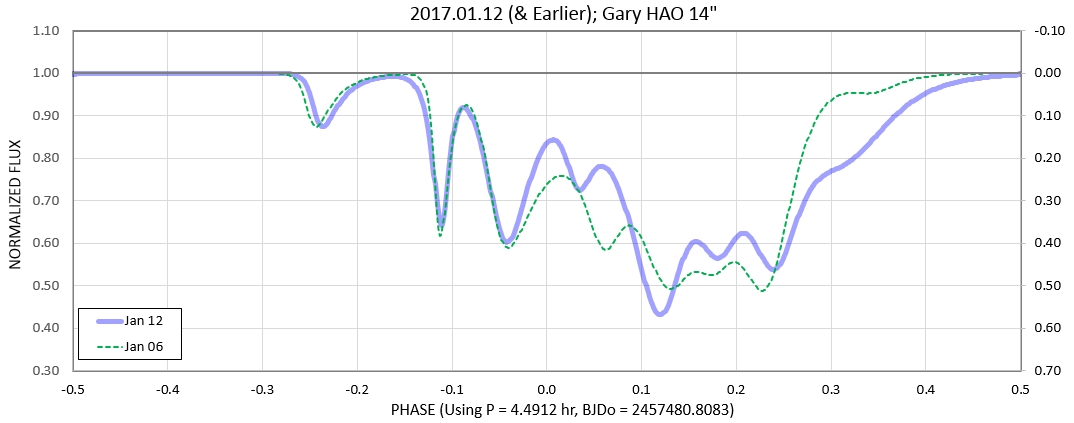
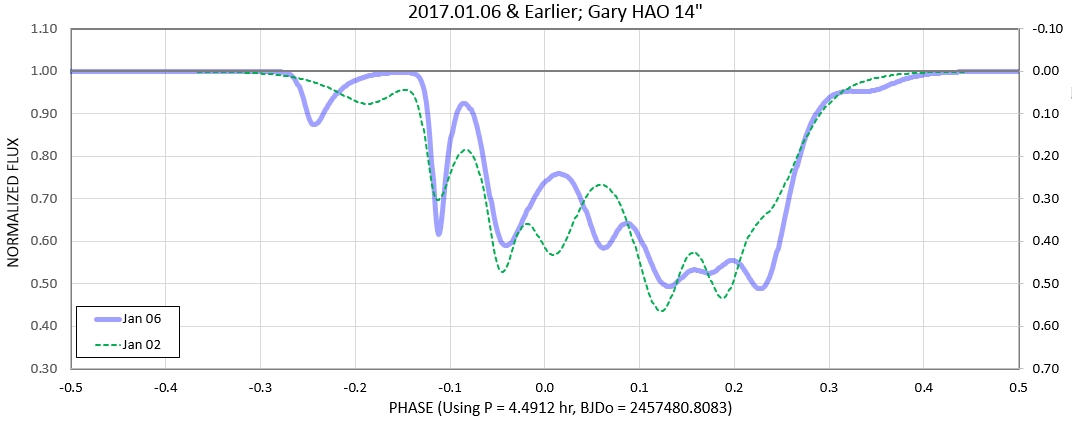
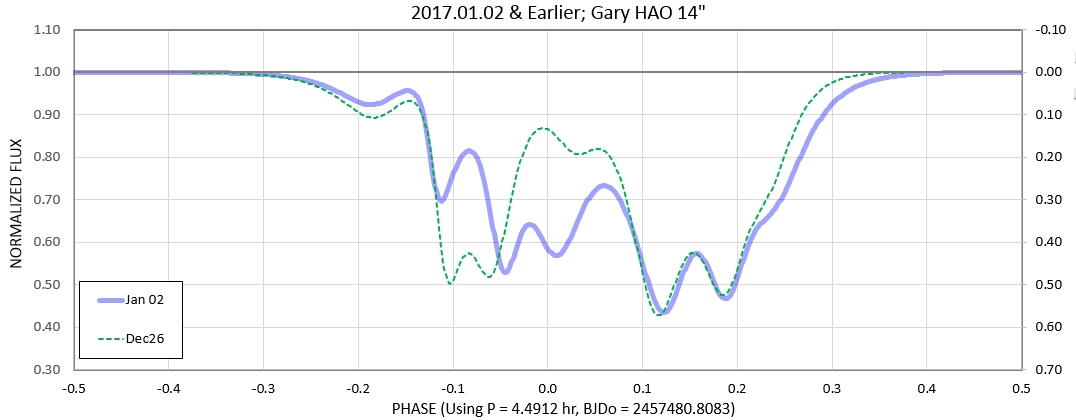
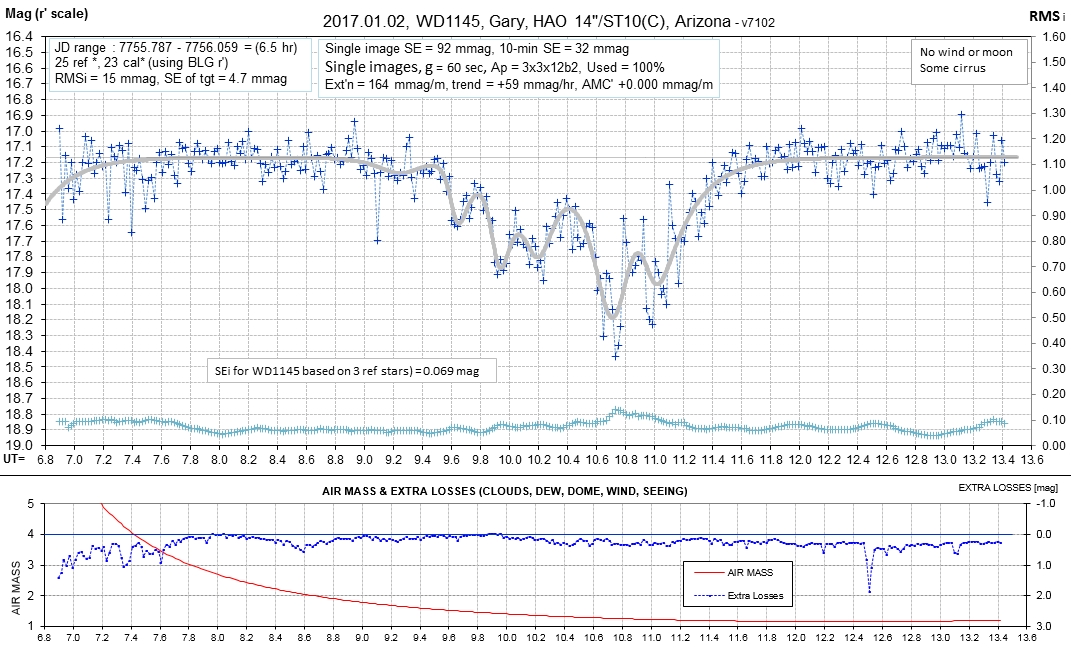
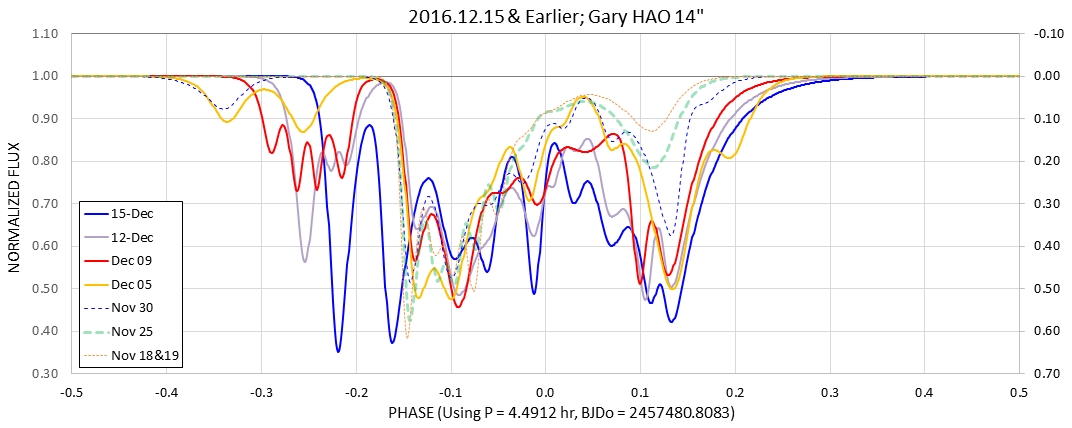
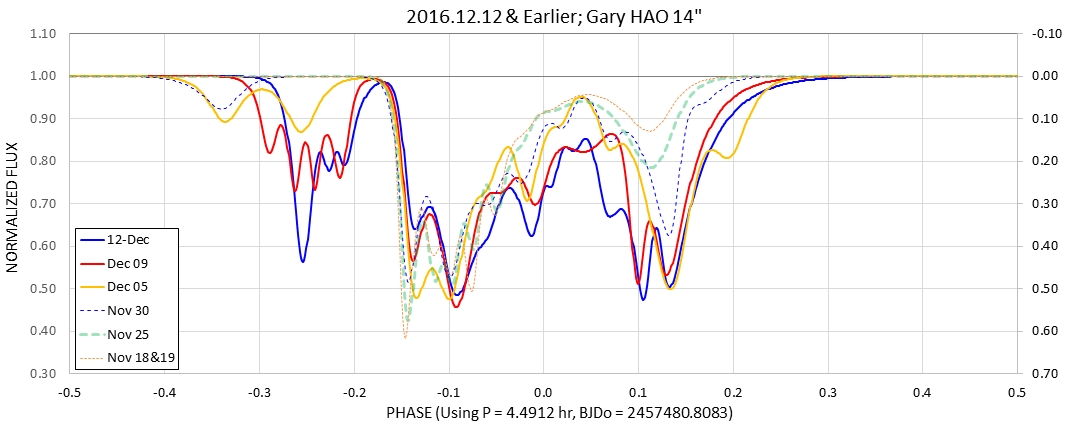
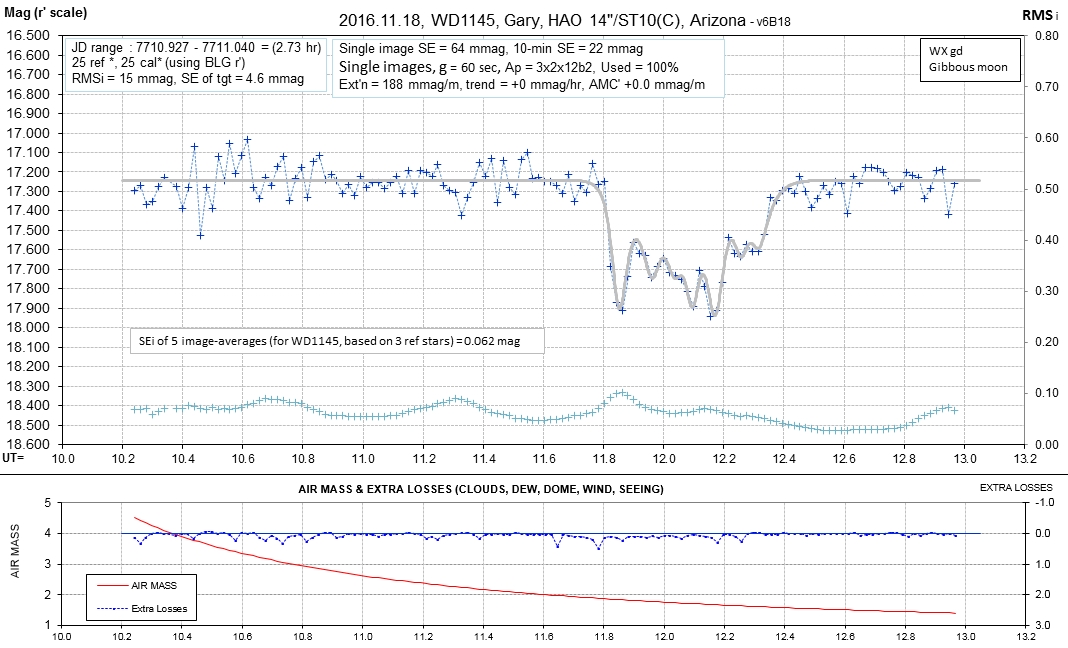
Figure 1b. Previous good-quality phase-folded LC.
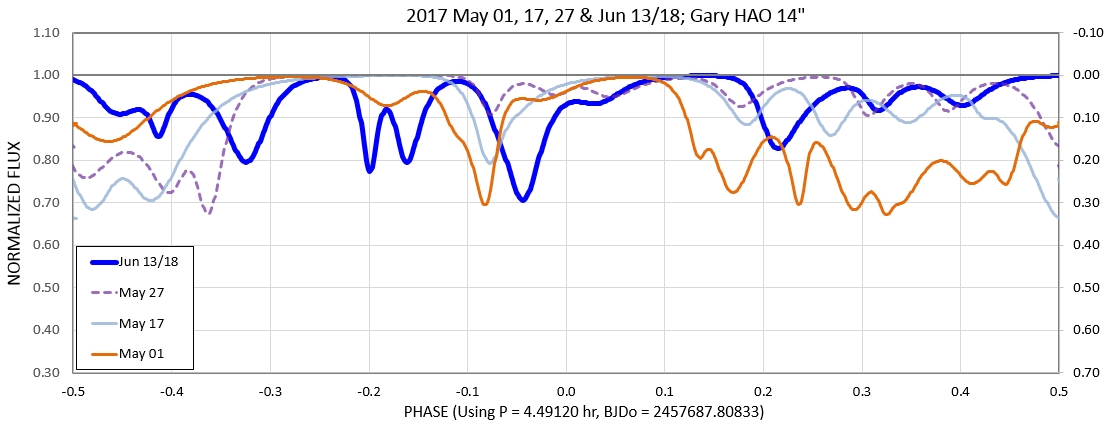
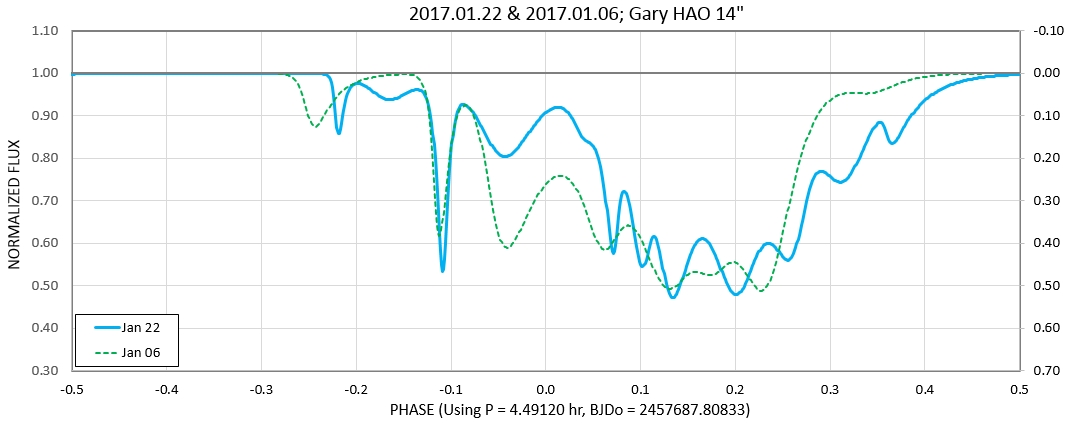
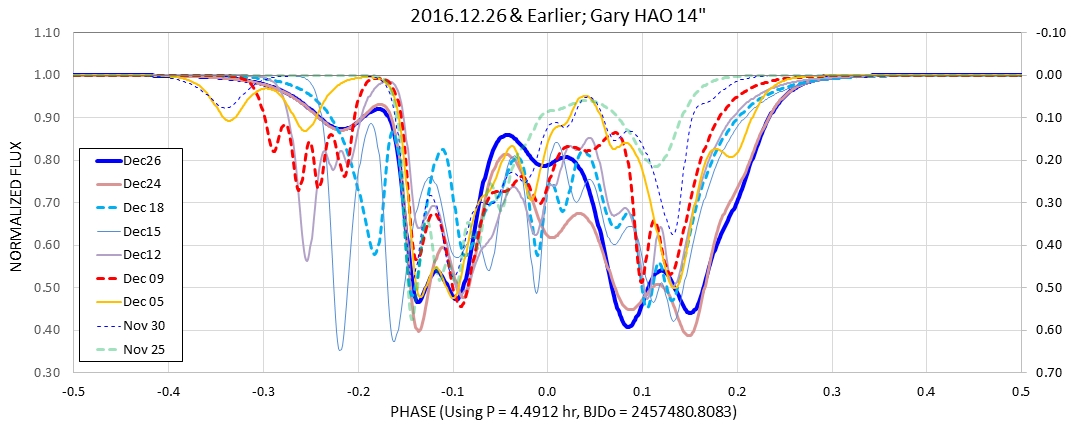
Notice the monotonic trend for fading within the phase region +0.11 to +0.25.
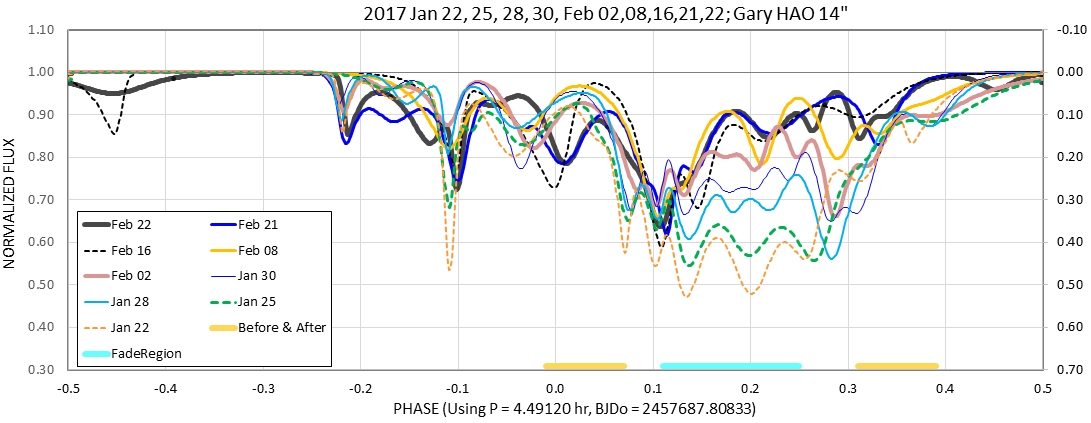
The phase region showing fades in the previous figure does indeed show a simultaneous change at all phase values within that region starting ~ Jan 21. [Needs update]
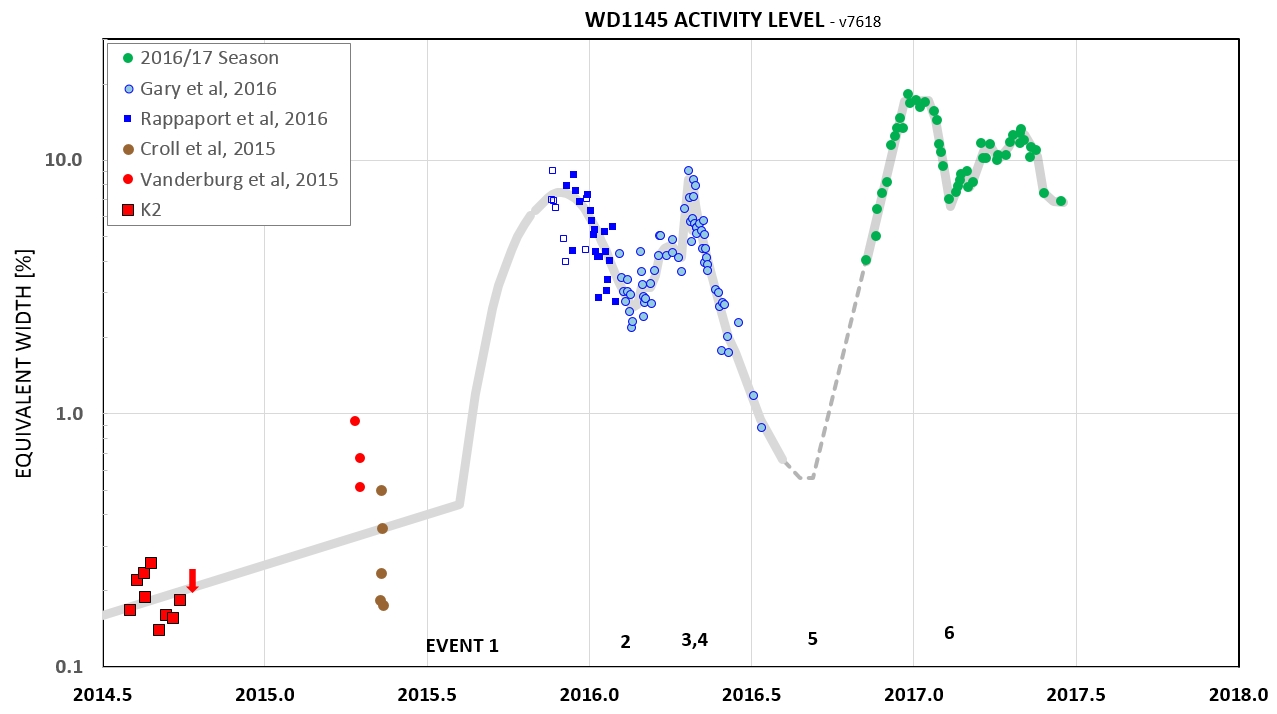
Figure 2. Activity level vs. date. Activity level is defined as the sum of "area under the curve" for all dips occurring during a 4.5-hour orbit. A 45-fold increase is apparent during parts of the 8 months of our amateur team observations during the 2015/16 observing season compared with the Kepler K2 observations 2 years earlier. This increase may have occurred after a hypothetical collision between a fragment and the "mother ship" asteroid in 2015 September (Event 1). Activity level declined steadily starting in 2016 April, and by the end of the first observing season (2015/16) activity had returned to a level almost as low as before the September 2015 event. However, the first few observations of the new observing season (starting 2016 Oct) shows an uptick of activity, reaching ~ 80 times the K2 level of activity (as of 2017 January). The rise in activity leveled off, and is now decreasing.
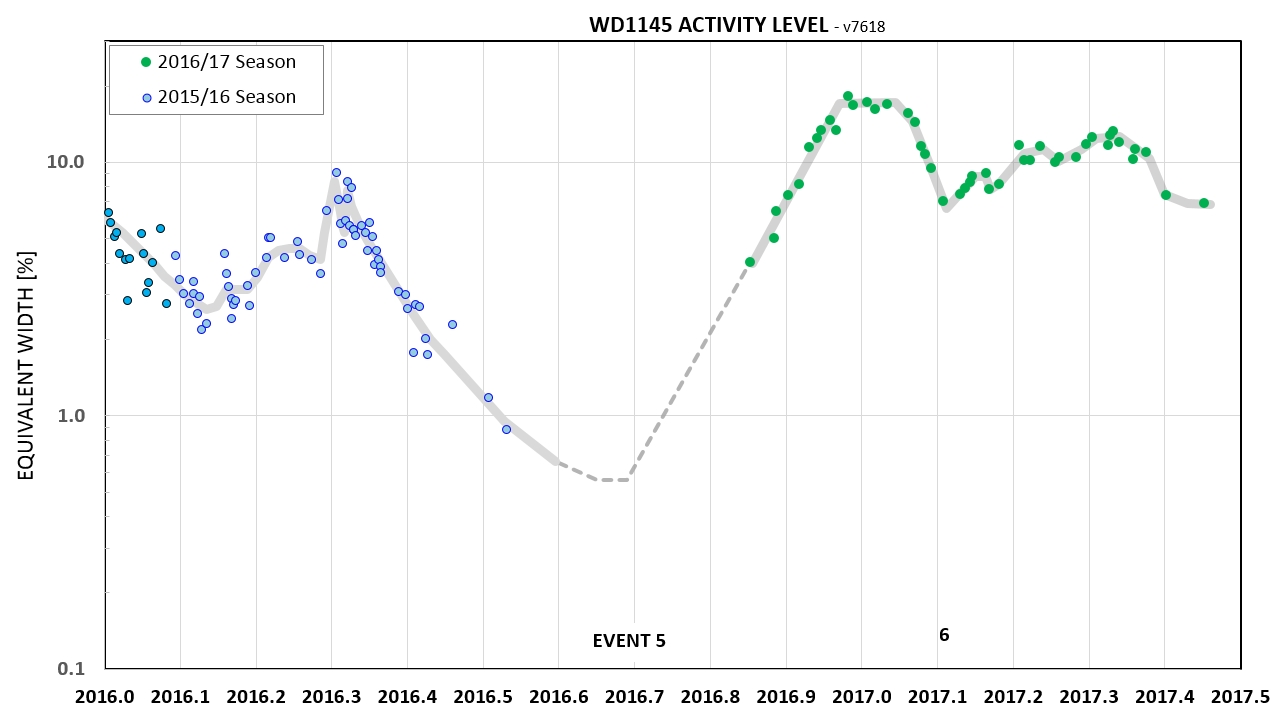
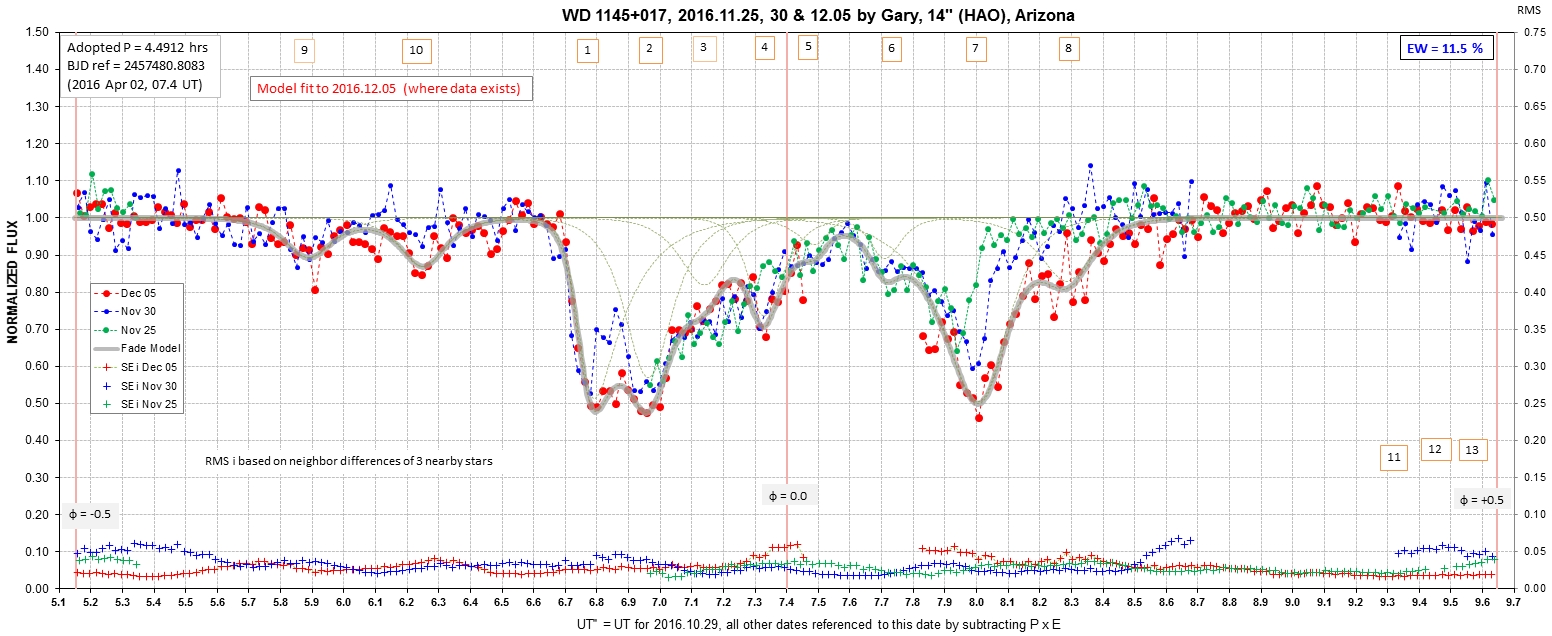
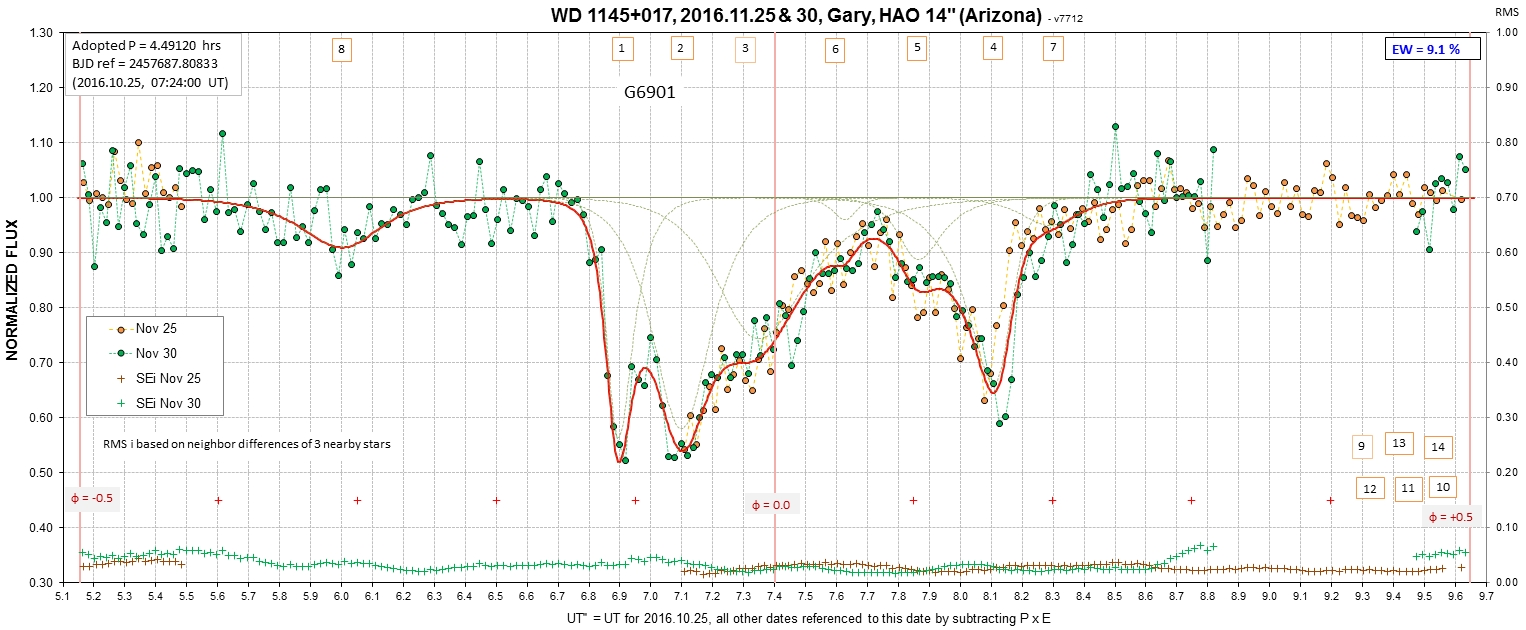
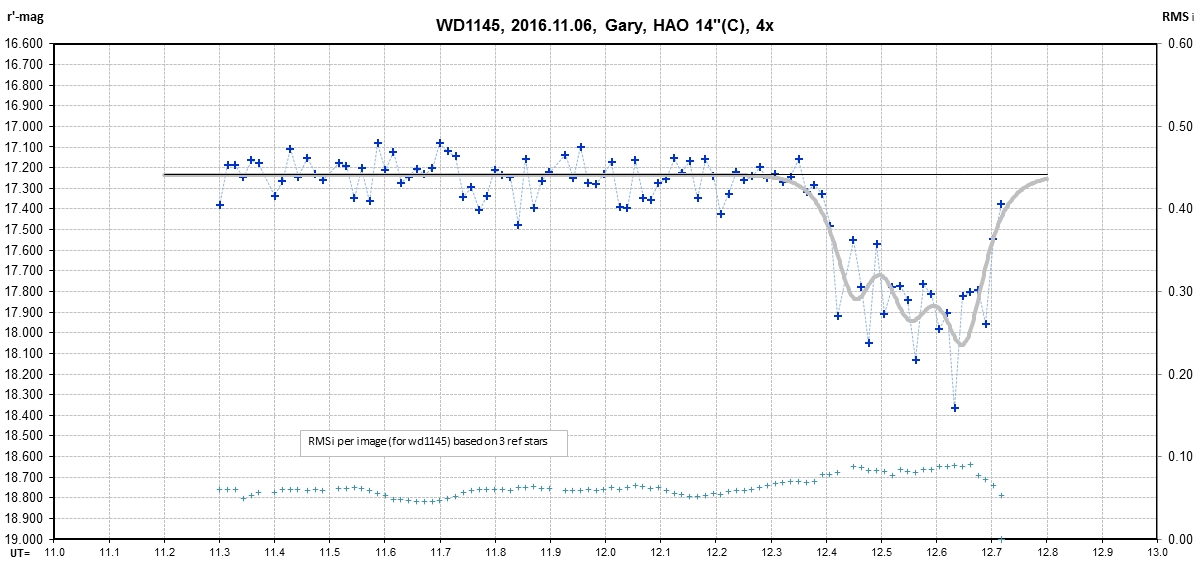
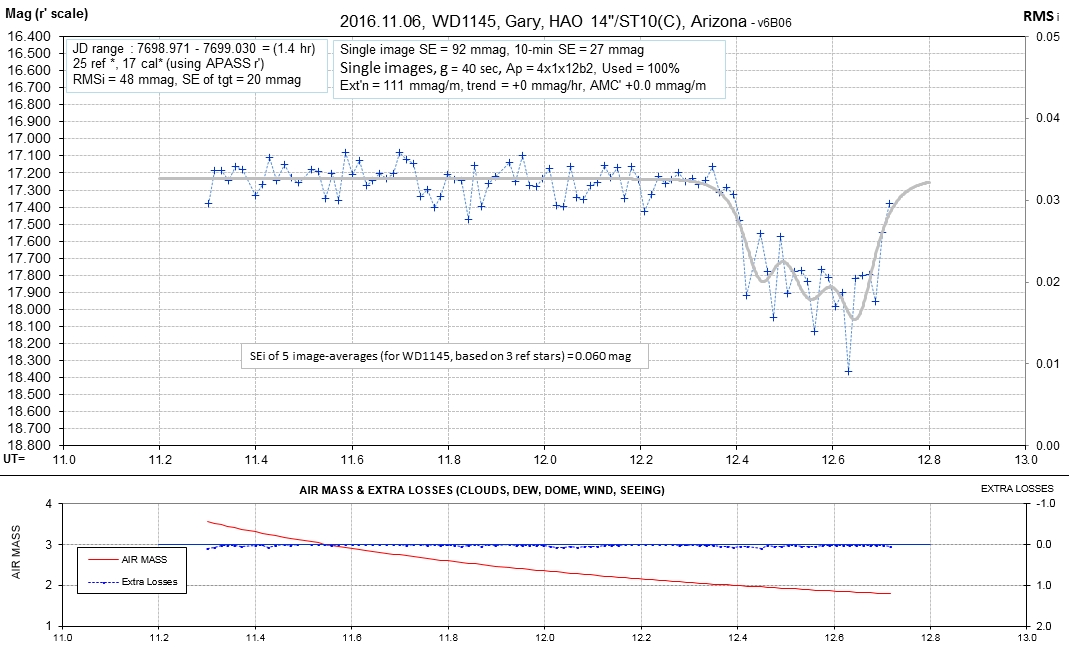
Figure 3. Expanding the date scale shows when event #5 may have occurred. It had to be between 2016.07.23 (the last measurement of the 2015/16 observing season) and 2016.11.06 (when it was first noticed, at a level of ~ 4%). The model shows event #5 with a "box" to indicate possible suggested onset dates (i.e., for the first group of dips). Event #6 has a well-established date of 2016.11.19 (the first green symbol).
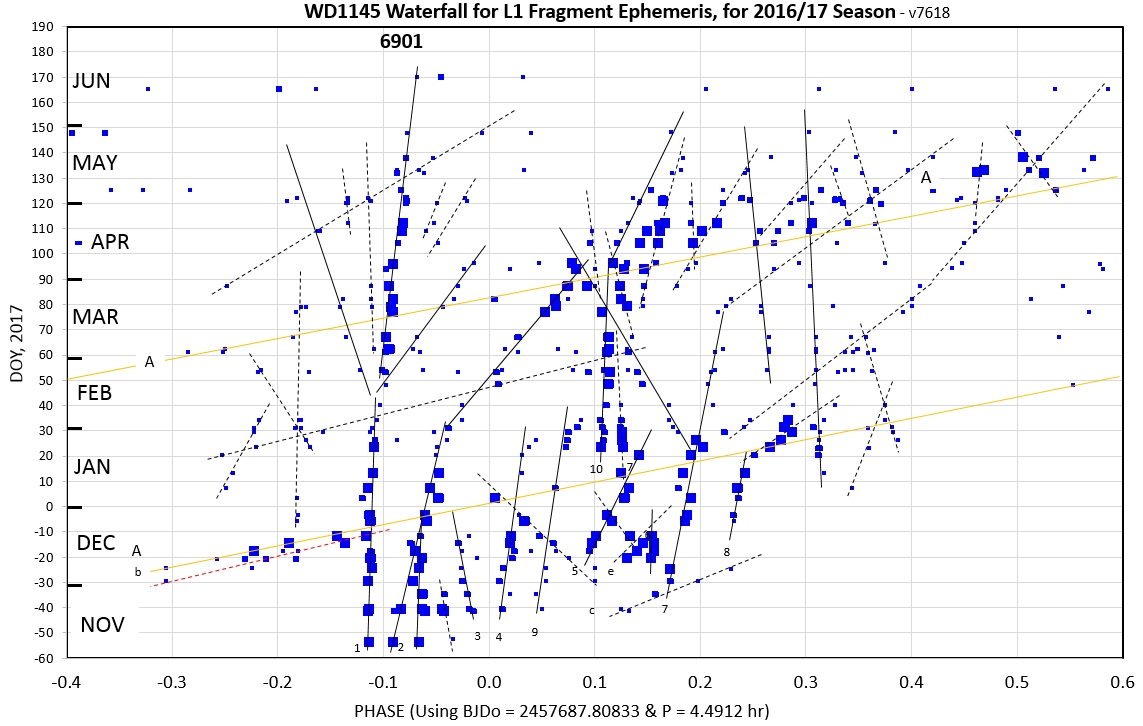
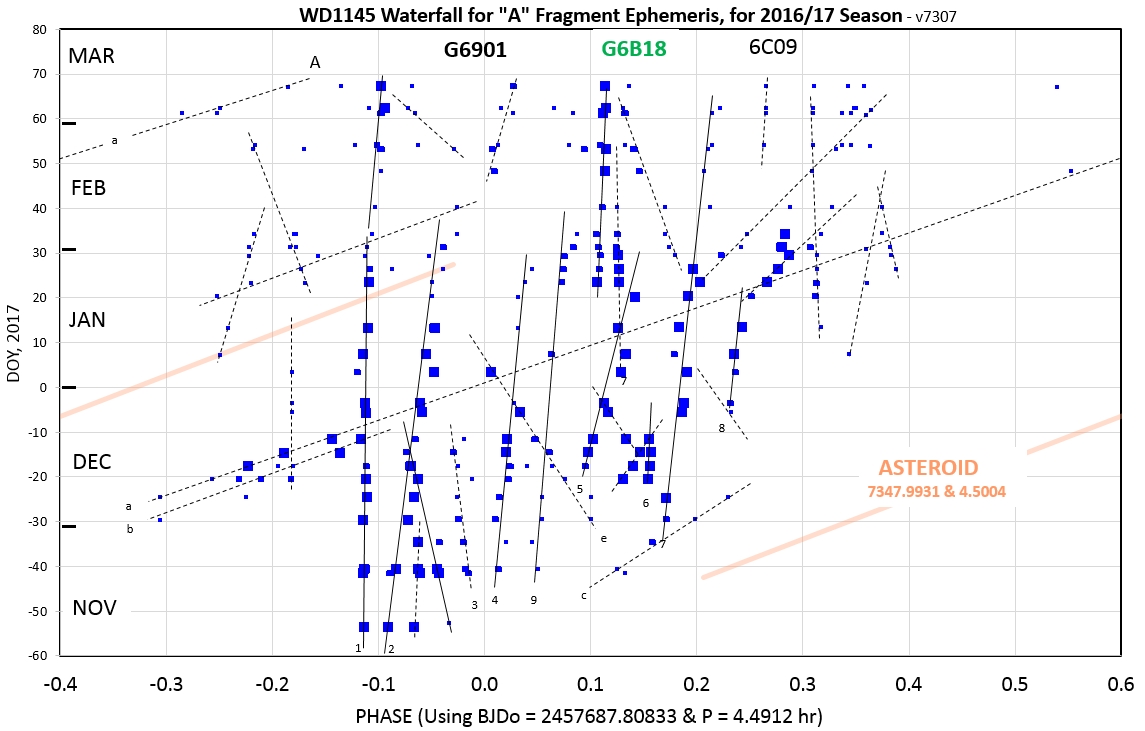
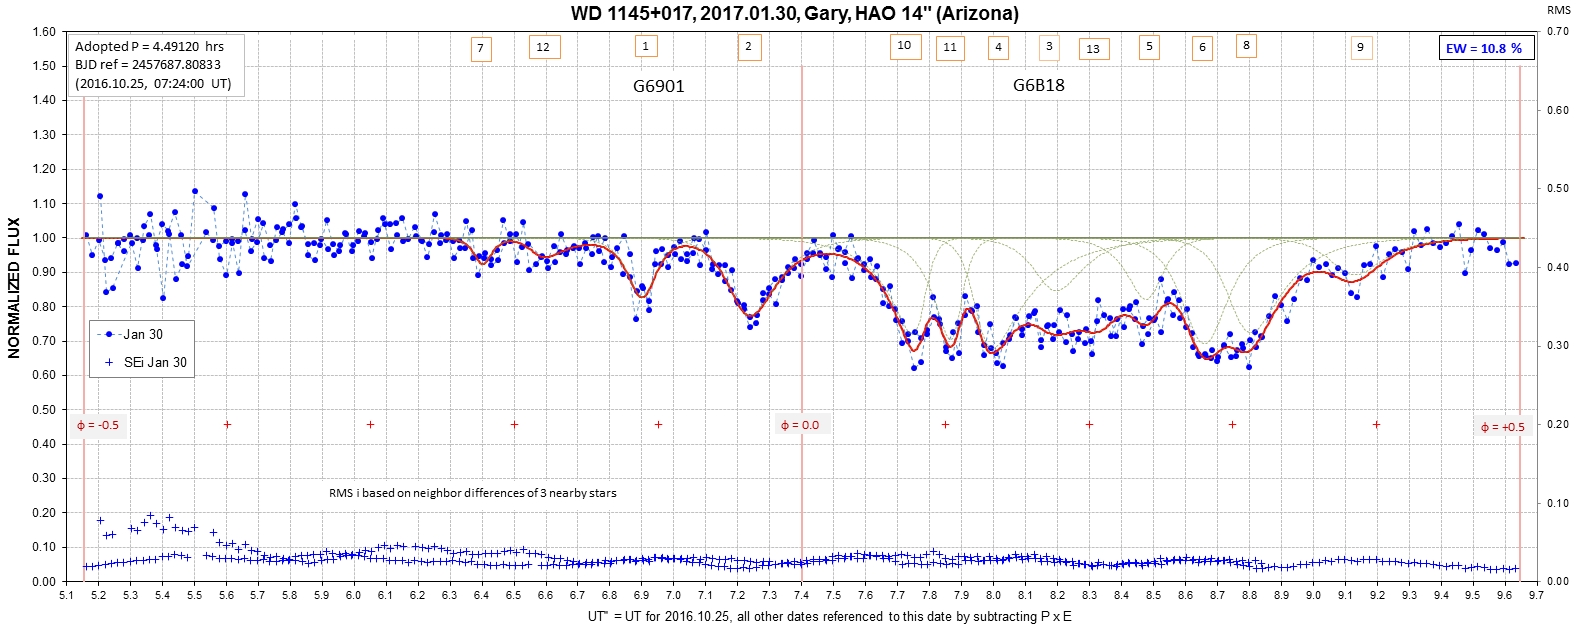
Waterfall diagram for 2016/17 season. Dip #1 has lasted 175 days (5.8 months). Dip "A" has the same period as what we used to refer to as the "mother asteroid" so maybe the "A" period is really for L2 fragments. That would make the bulk of dips coming from L1 fragments, with only occasional in-between dip periods associated with the asteroid "mother ship." There appears to be a collision, or break-up, of the fragment producing Dip#1 in mid-February, leading to 3 to 5 smaller fragments that produce smaller and occasional dips.
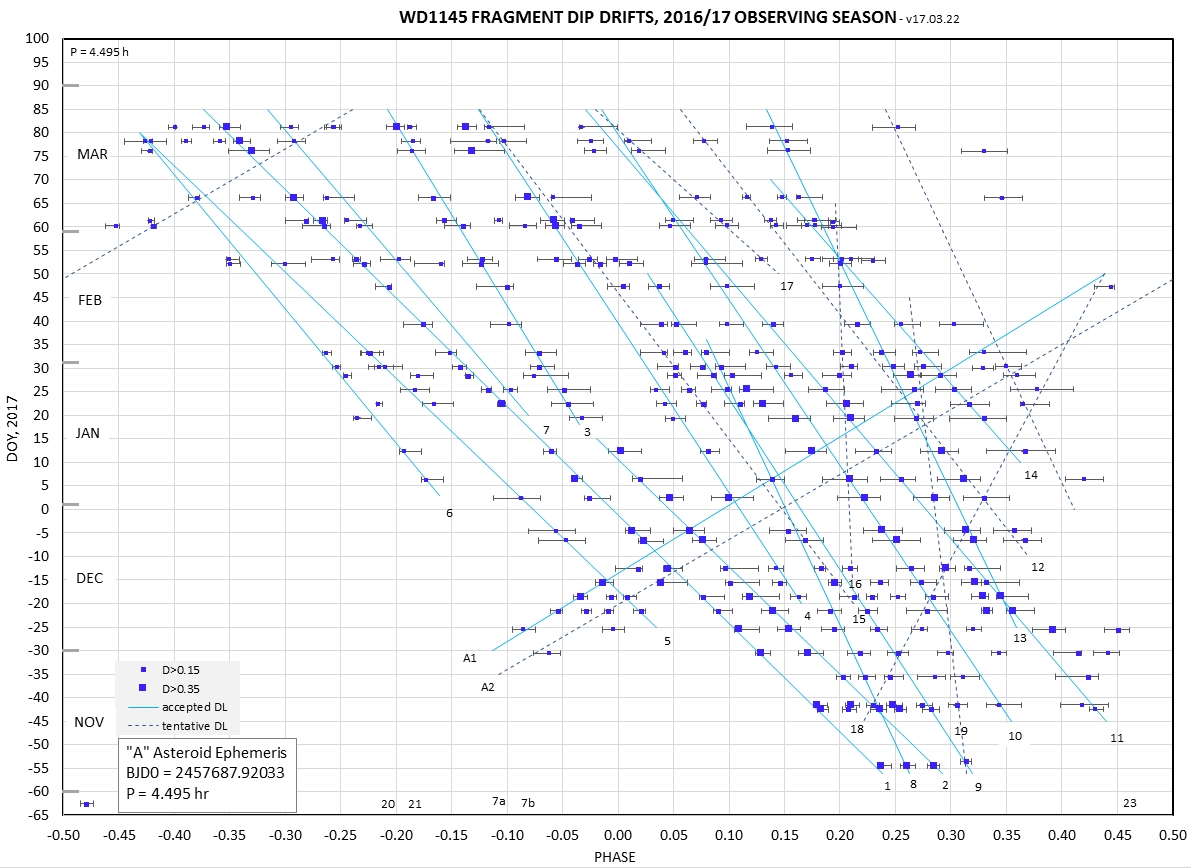
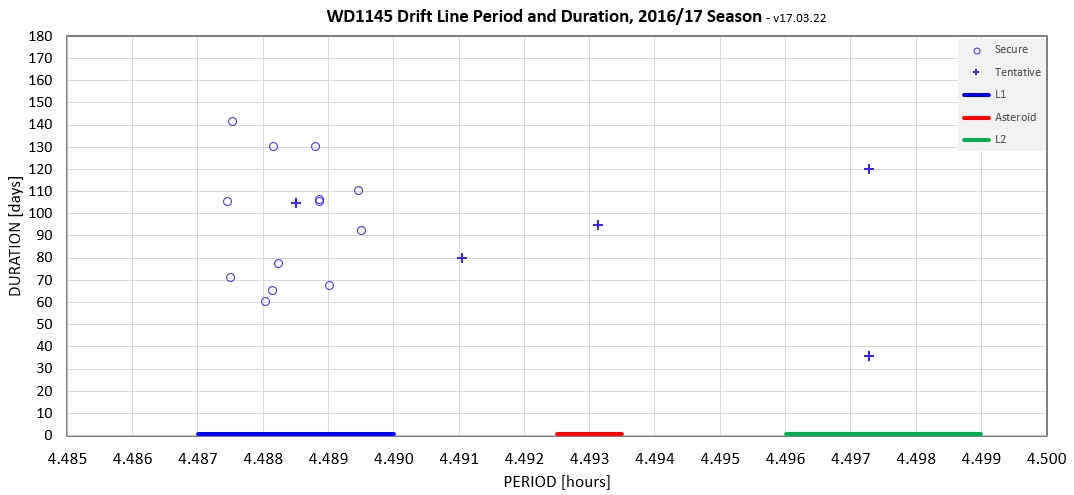
Another display format with objective solutions for drift line fitting. Adopted period corresponds to my estimate of the "A" asteroid (4.495 hr). Drift lines sloping to the left (going up in time) have periods shorter than the ephemeris period (my adopted "A" asteroid); drift lines sloping to the right have longer periods; drift lines with no slope (moving straight up) would have the same period as my adopted "A" asteroid. Most drift lines slope to the left because more fragments drift away from the L1 end of the asteroid because it is hot; very few drift lines slope to the right because very few fragments drift away from the L2 end because it is cool (perpetual shadow). Drift line 1 has lasted 137 days (4.5 months). [Needs to be updated]
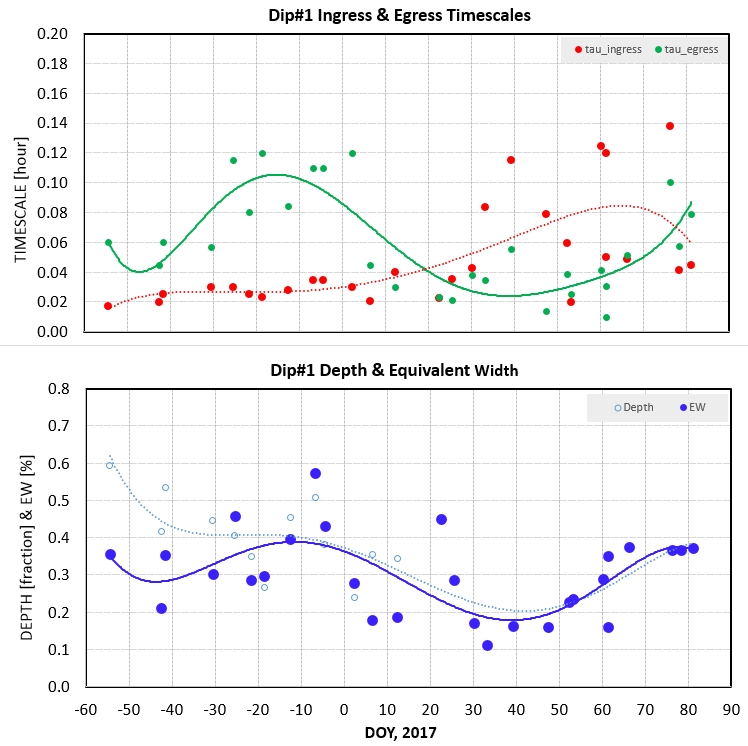
Properties of Drift Line #1 (cf. previous figure). It's fading, and currently has the lowest depth since it was first detected (2016 Nov 6). [Needs updating]
Most fragments are expected to come from the L1 end of the asteroid, so most dust clouds should have the L1 fragment periods. Fewer fragments should come from the L2 end because it is cooler (because it's in shadow). I don't know if the asteroid itself can produce dust clouds because of its gravity.
Links on this web page:
Some physical model thoughts
List of observing sessions
Observing session observations
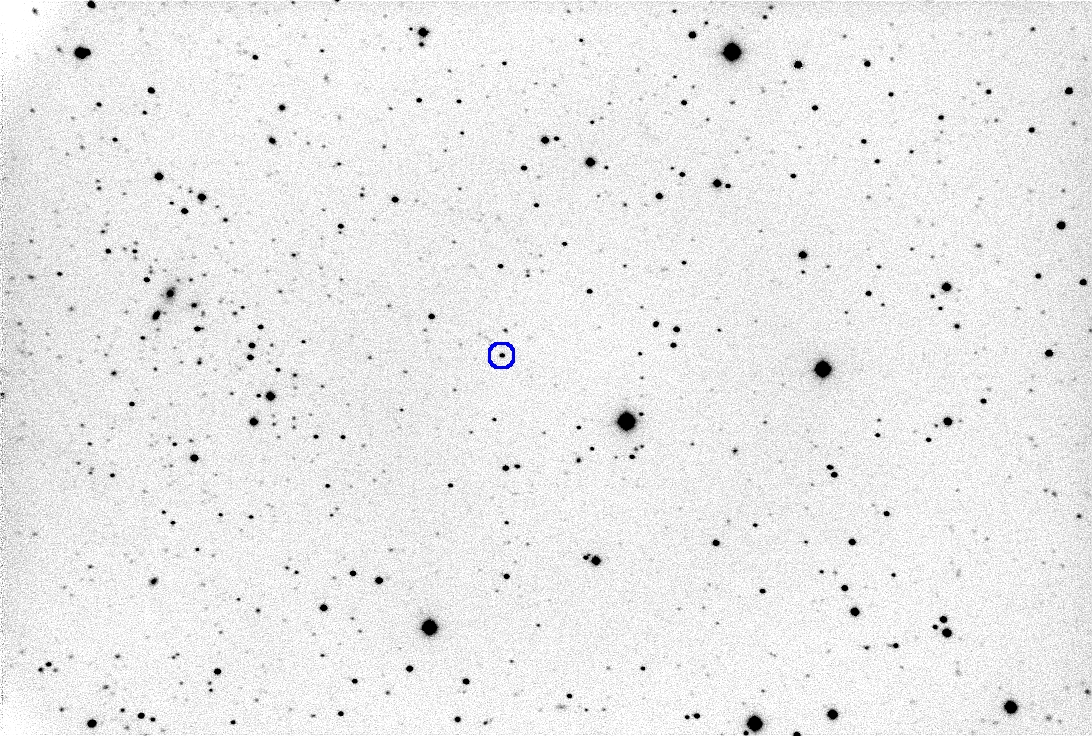
Finder image
Data exchange files
References & related links
My collaboration policy
Some Physical Model Thoughts and Appeal for "Sweet Spot" Telescope Observations
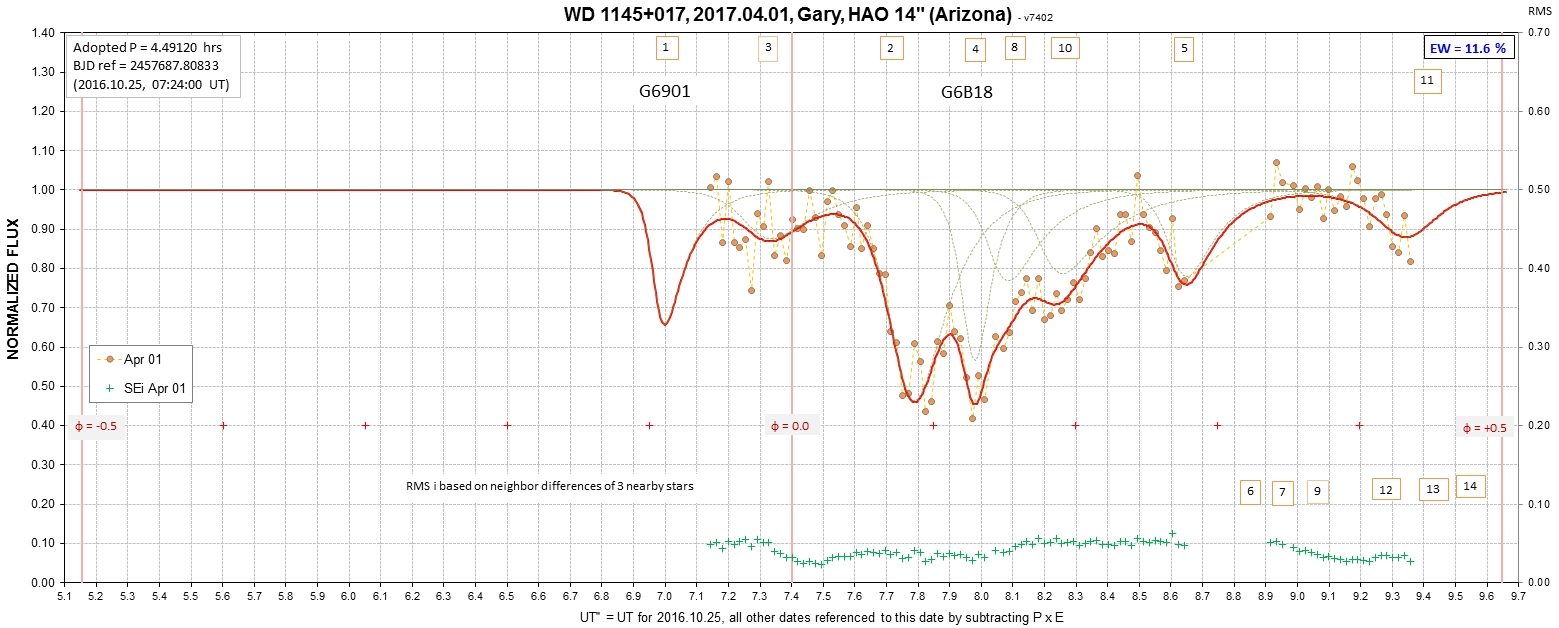
Figure 3 in the previous section shows an "activity slope" of 3.7 %/day starting with Event #6. Let's consider this to be characteristic of how fast a dust cloud's "total projected area" increases with time after a "collision" event. The term "total projected area" refers to the projected area of dust particles with circumferences larger than optical wavelengths (i.e., Mie scattering regime). Imagine that a "collision" event produces particles with a size distribution that ranges from microns to meters, for example. The small particles will be pushed outward from the WD by radiation pressure, so they will be in orbits with ever-longer periods, causing the dust cloud to expand in phase to larger values (i.e., a trailing tail). This is what we see for the second dip group in Fig. 4, above. Presumably, all particles will produce molecules of minerals due to sublimation, and these may recondense to Mie size small particles. The smallest source particles will evaporate first (due to sublimation), and thereby be removed from the original particle size distribution. The remaining larger particles will sublimate, and become smaller. It should be possible for detailed models of these processes to make use of the 3.7 %/day activity slope as an observational constraint.
We can also imagine that the first group of dips underwent this process starting at an earlier date (as suggested by Andrew Vanderburg, private communication). Note that the first dip group has a trailing tail appearance. Note further that this group has a stable "lead-off dip" that is sharp and stable in phase; this could be a dust cloud produced from a population of large particles whose orbits haven't been affected by radiation pressure.
Note that I haven't taken a position on whether the asteroid and its fragments are consolidated rock or rubble piles (like almost all solar system asteroids smaller than a certain size). If the parent body asteroid is a rubble pile, the "fragments" that break away (from the L1 end) would start out as a "clump of rubble," possibly held together initially by inter-molecular forces (in the same way that asteroids small enough to violate the 2.2-hour "spin barrier" are held together). These, in turn will be destined to come apart, especially if they rotate fast; fresh surfaces would then be exposed to heating on all sides. Sublimation will erode outer surfaces, and the strong gravitational field gradient will flex the rubble clump, causing it to expand further. The lowest density rubble clumps will break apart before the denser ones (i.e., at larger distances from the WD).
In this model we are dealing with fragments composed of "gravel" with an inherent size distribution. For fragments that are actually a "clump of rubble" instead of a solid rock it is easier to produce "events" of increased activity. This is because we no longer require actual "collisions" to initiate dust cloud production. Instead, all we require is that a "clump of rubble" be disturbed enough by the various forces acting on it to begin a process of coming apart. The coming apart will release "gravel" with a size distribution encompassing a wide range of sizes. The smallest particles will have the greatest surface area per mass ratio, and can be expected to dominate dust cloud production immediately after "clump of rubble" breakup. All particles will present "fresh surfaces" for sublimation. The argument about radiation pressure producing a trailing tail can be invoked. When a "clump of rubble" fragment begins to break apart it may produce chunks of rubble that slowly separate, turning the pile into a "rubble cloud." Less shading within a cloud will lead to more sublimation (Chiang, private communication). If the rubble clump breaks apart from spinning the smaller clumps, or rubble clouds, will separate from each other. Each such rubble cloud will produce dust clouds due to sublimation, and when these are of a size to block a few percent of WD light in their orbit the dips produced will form drift lines in a waterfall diagram that have slightly different slopes. Assuming the dust clouds last for several weeks, as they have been noted to do, the fade pattern will consist of several dips that spread apart week after week. Projection of the waterfall drift lines backward to a convergence date would allow determination of the rubble clump's break apart date.
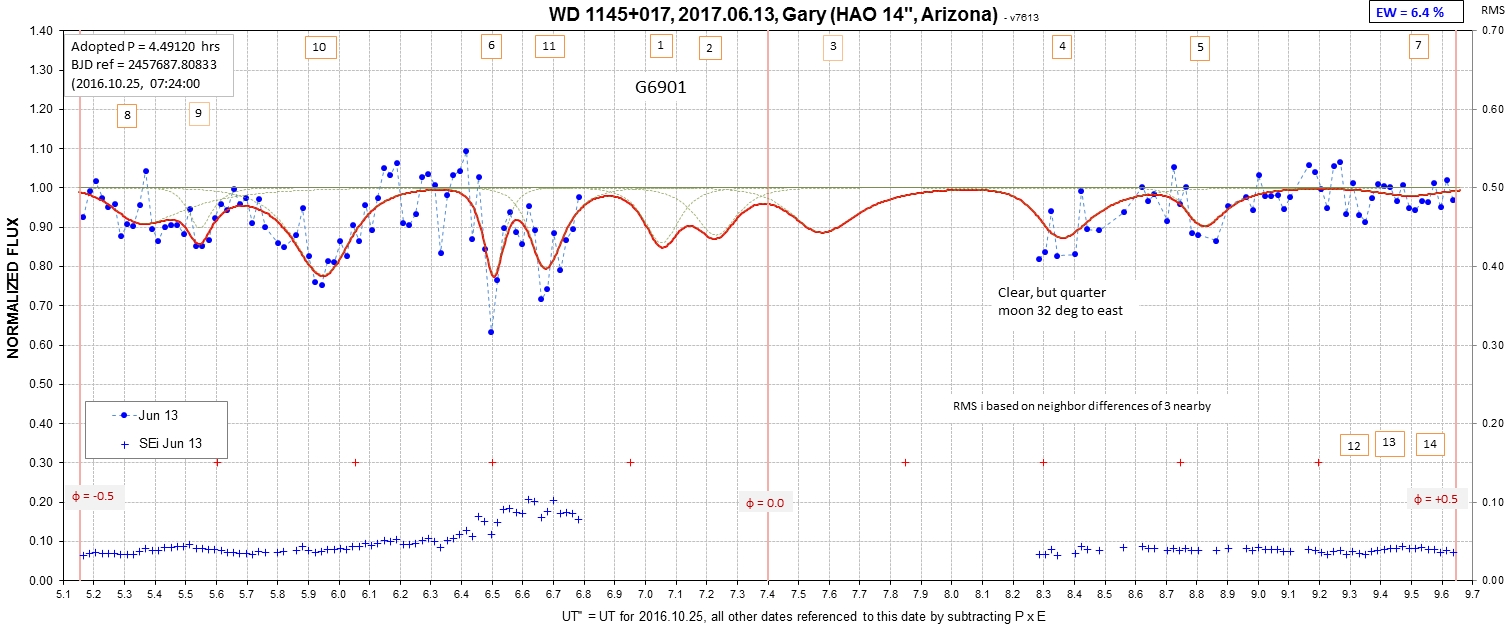
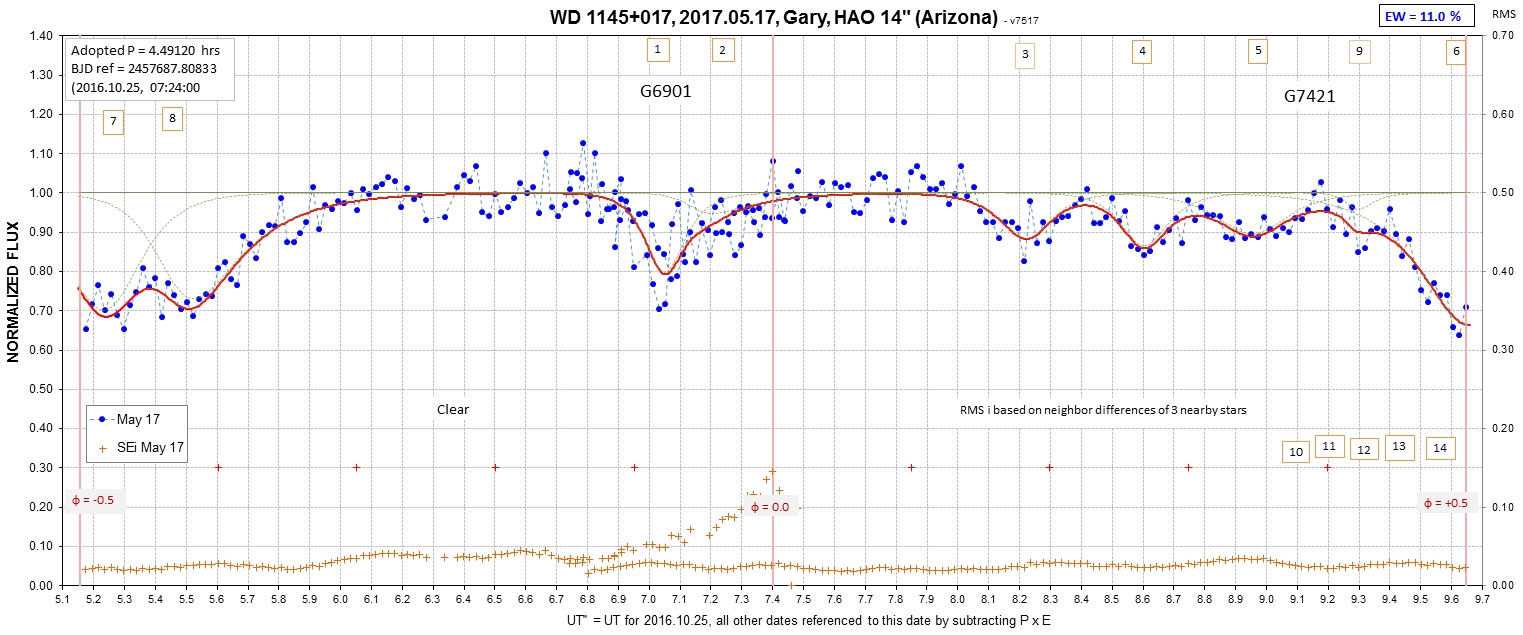
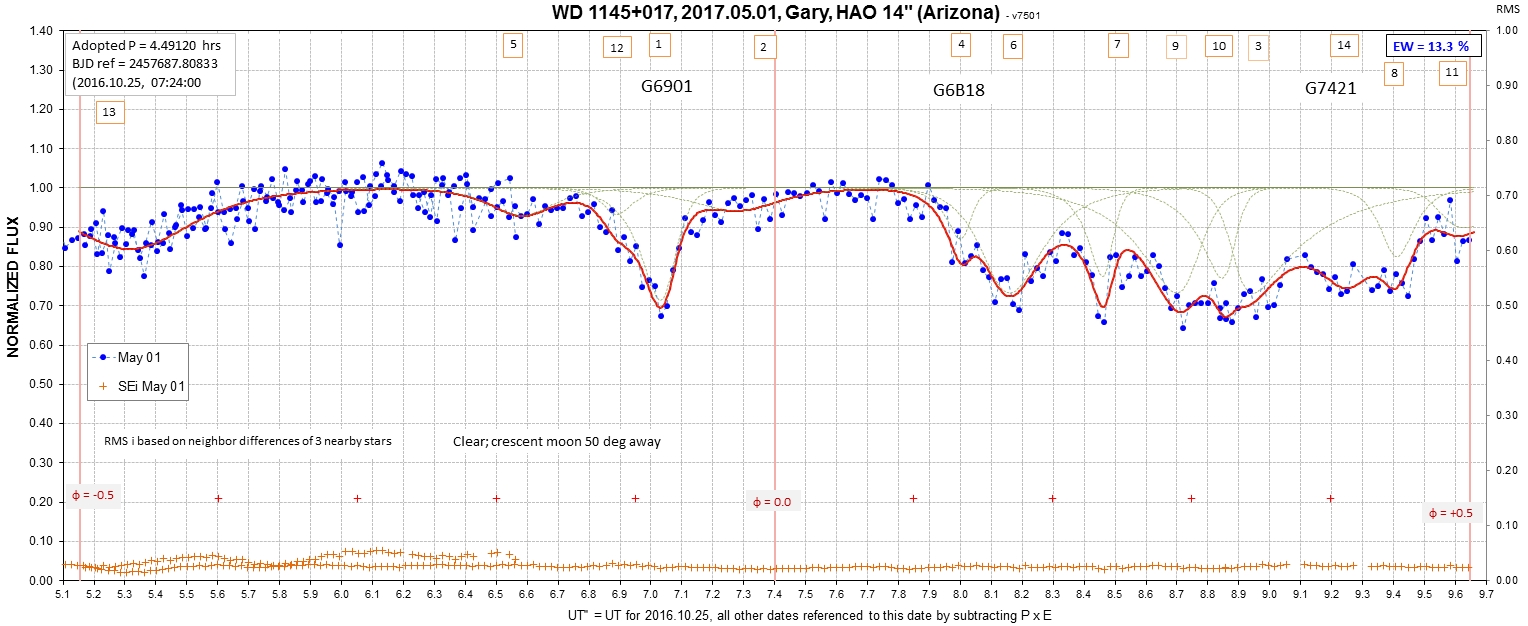
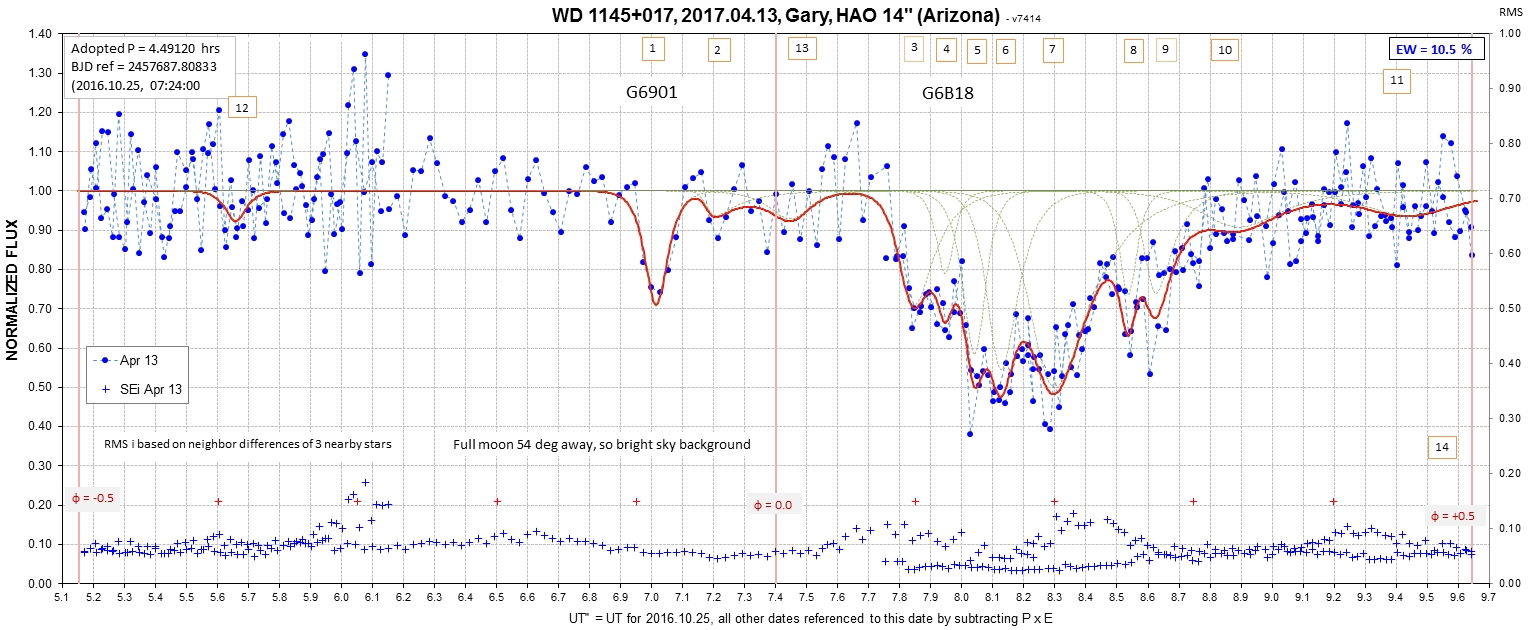
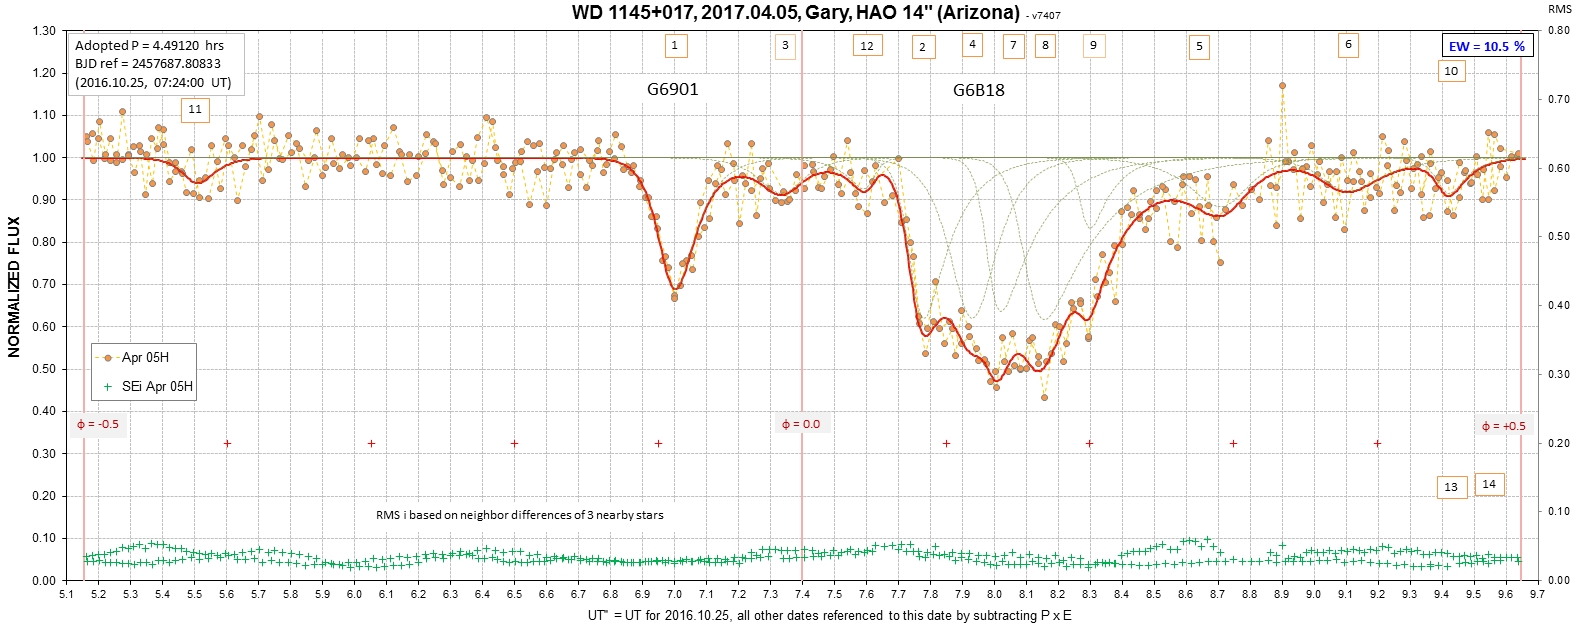
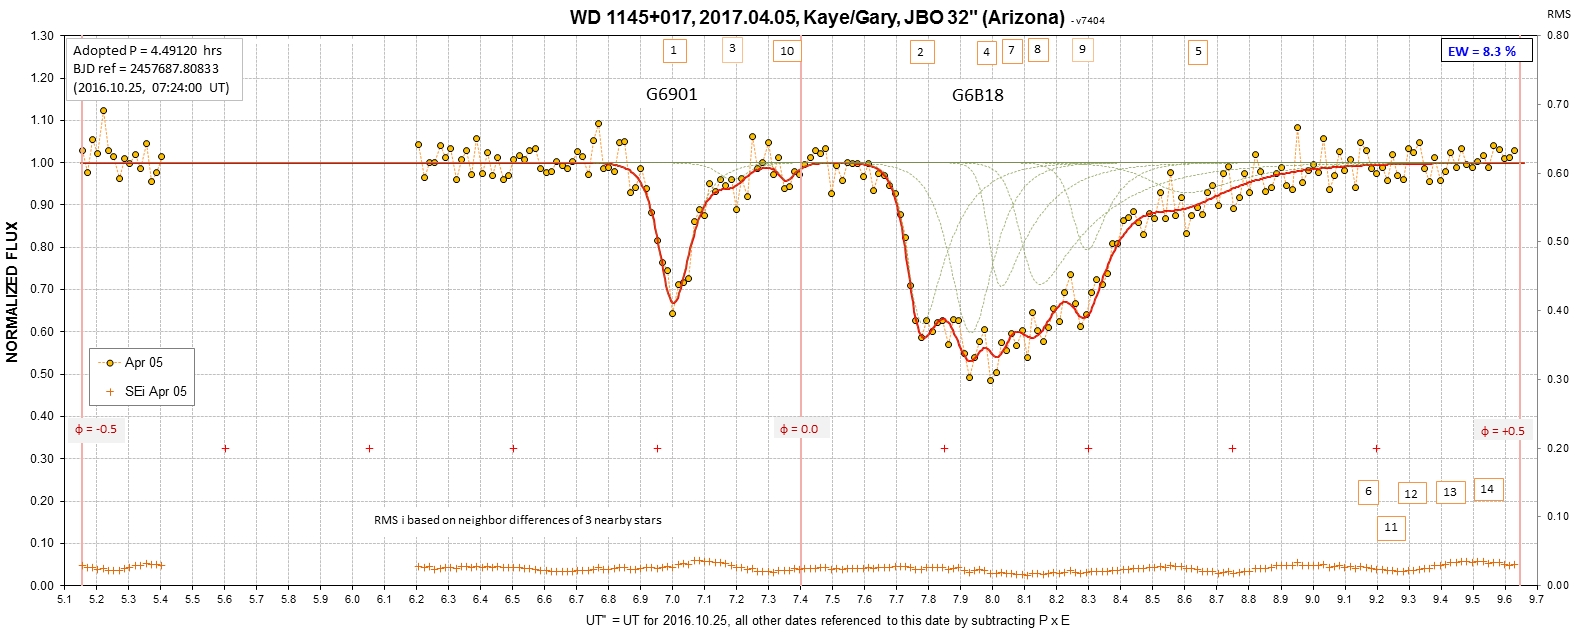
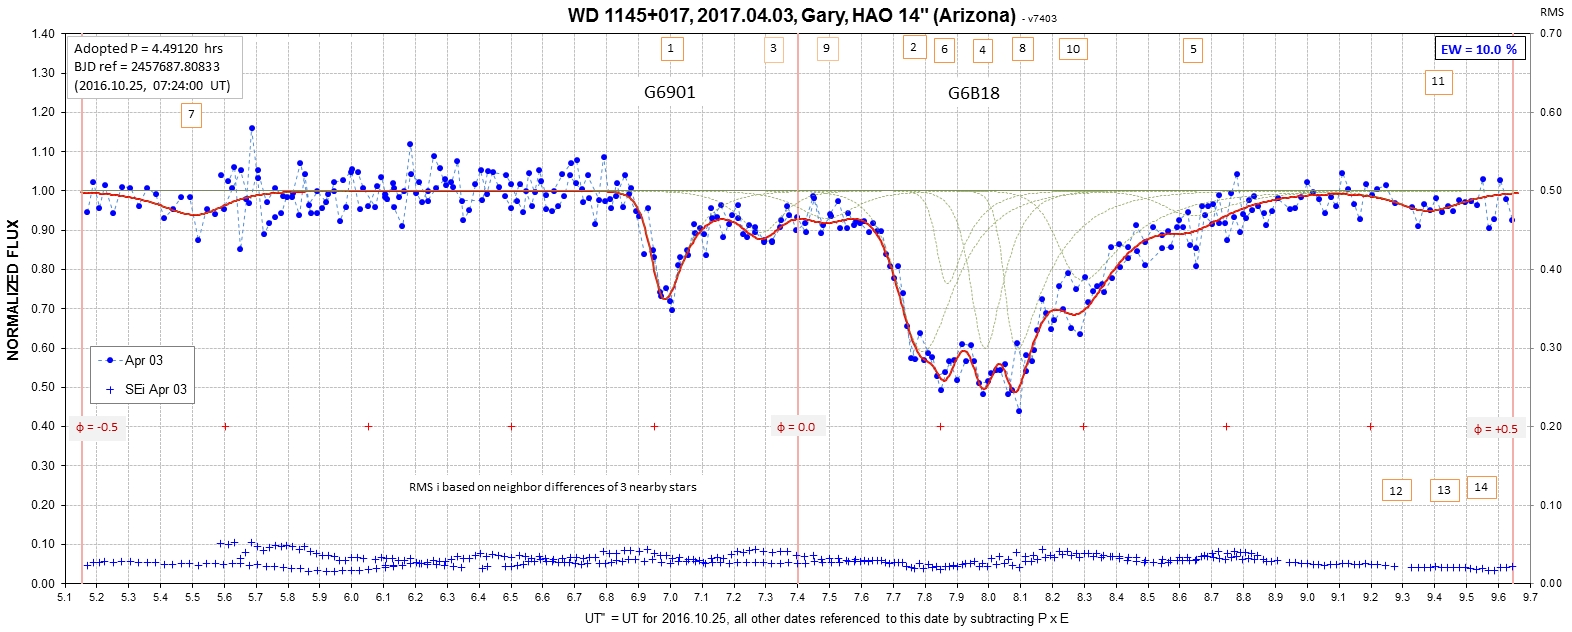
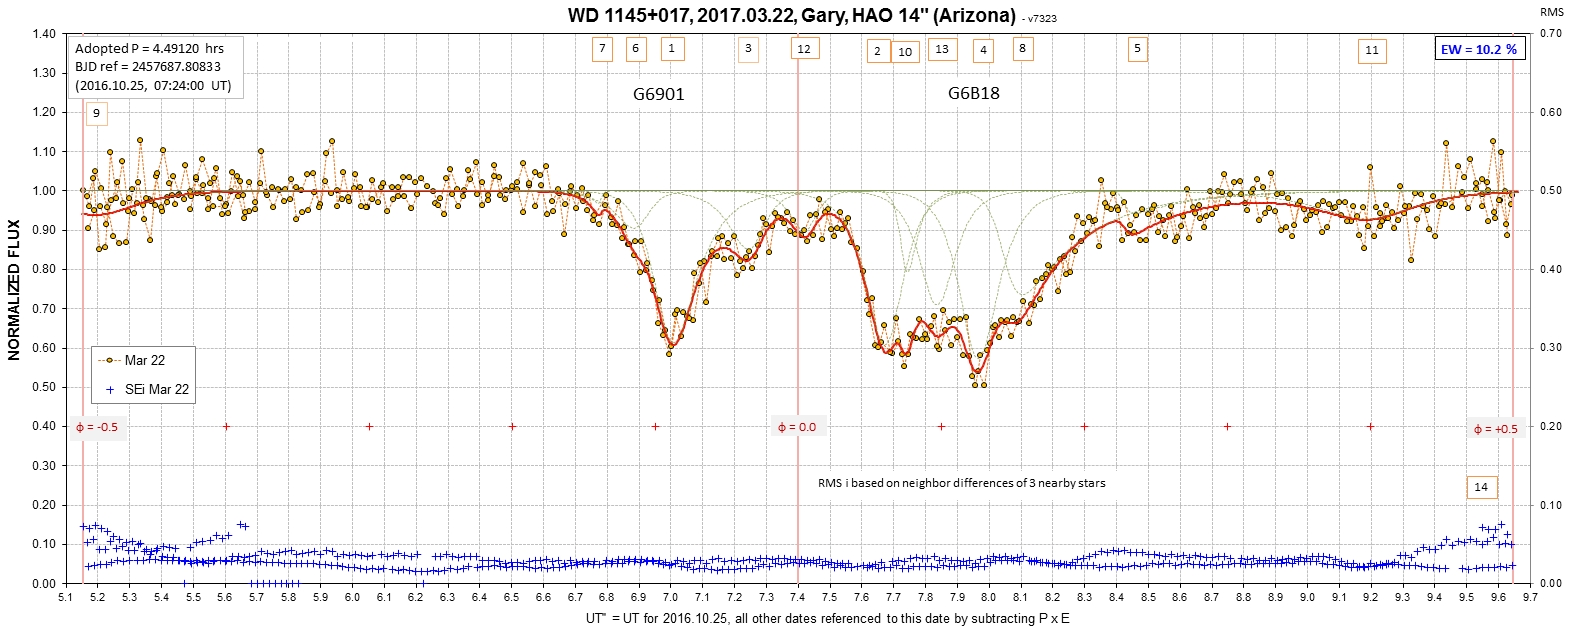
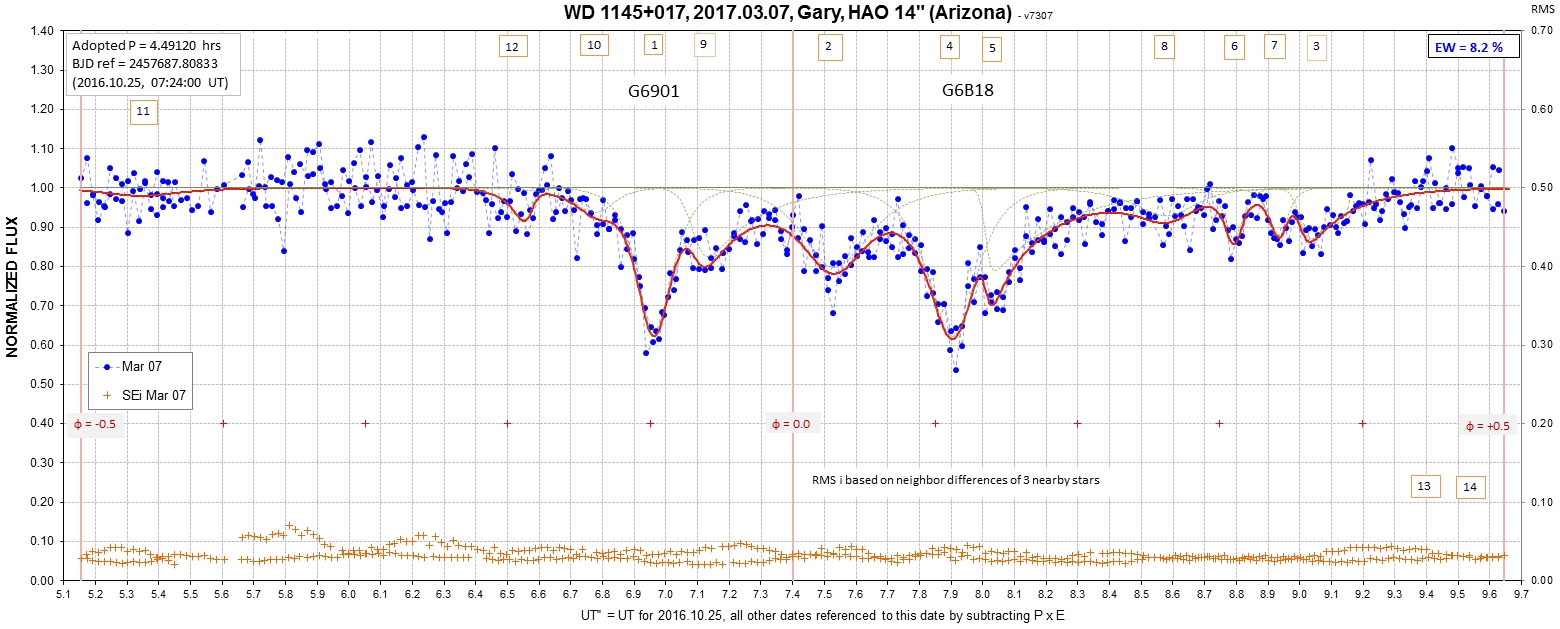
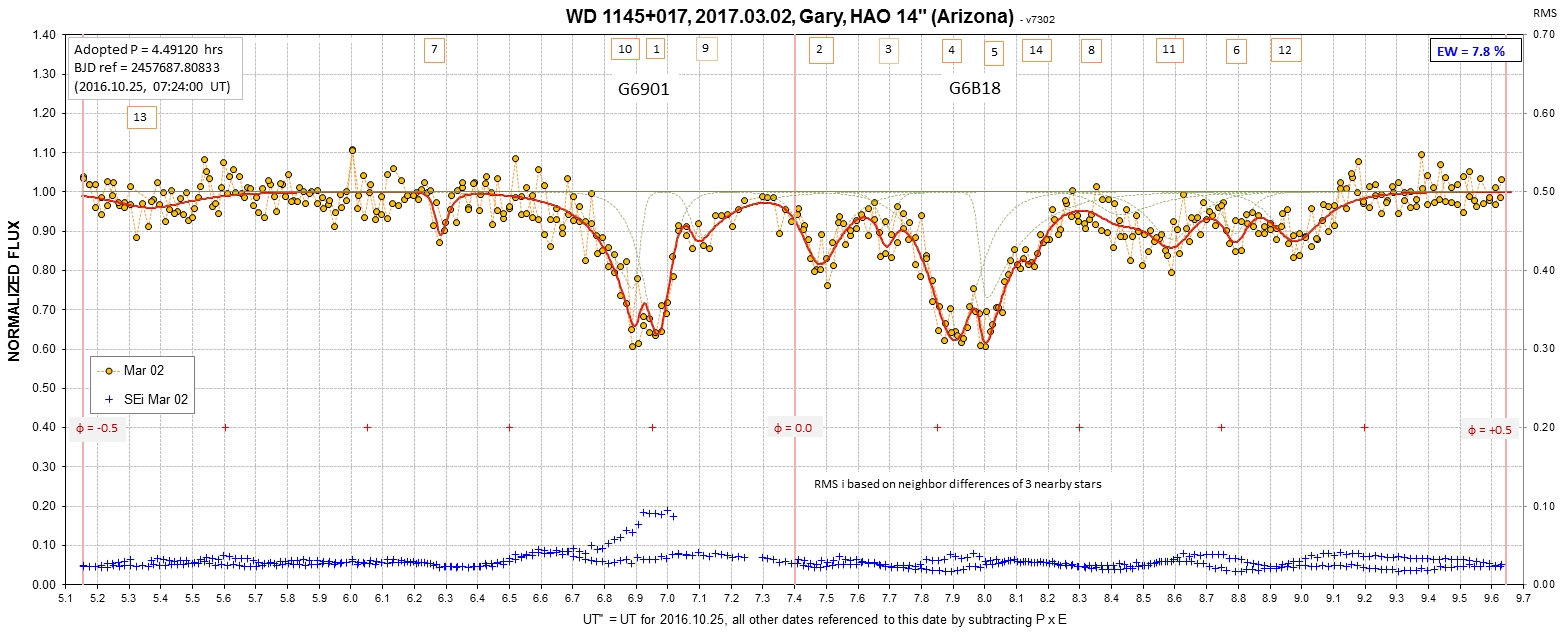
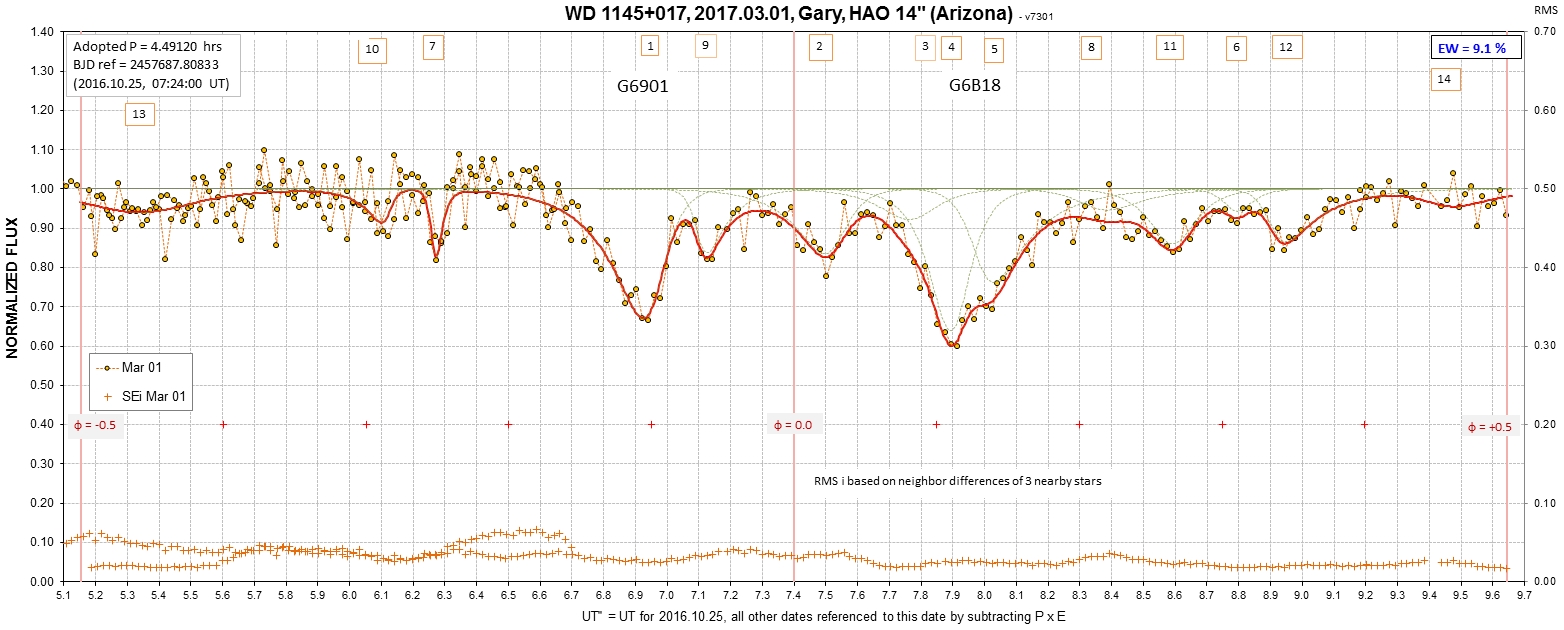
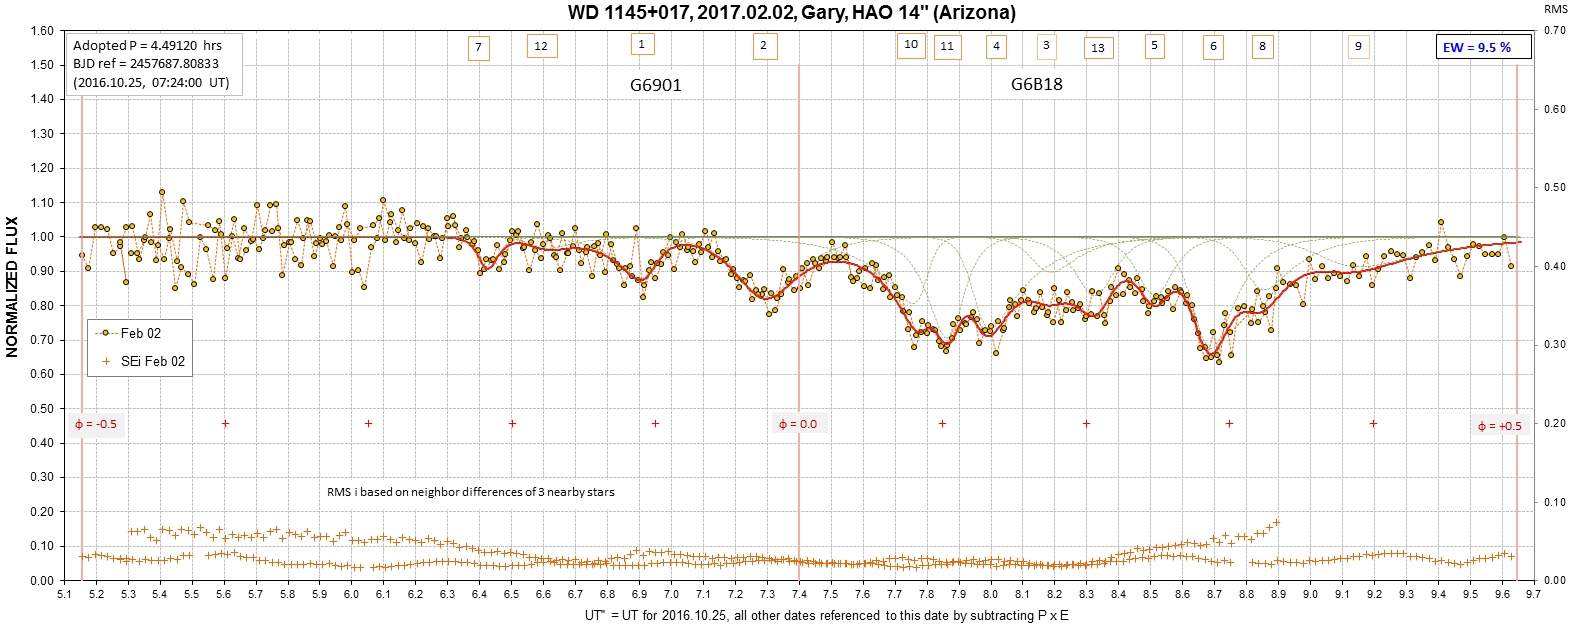
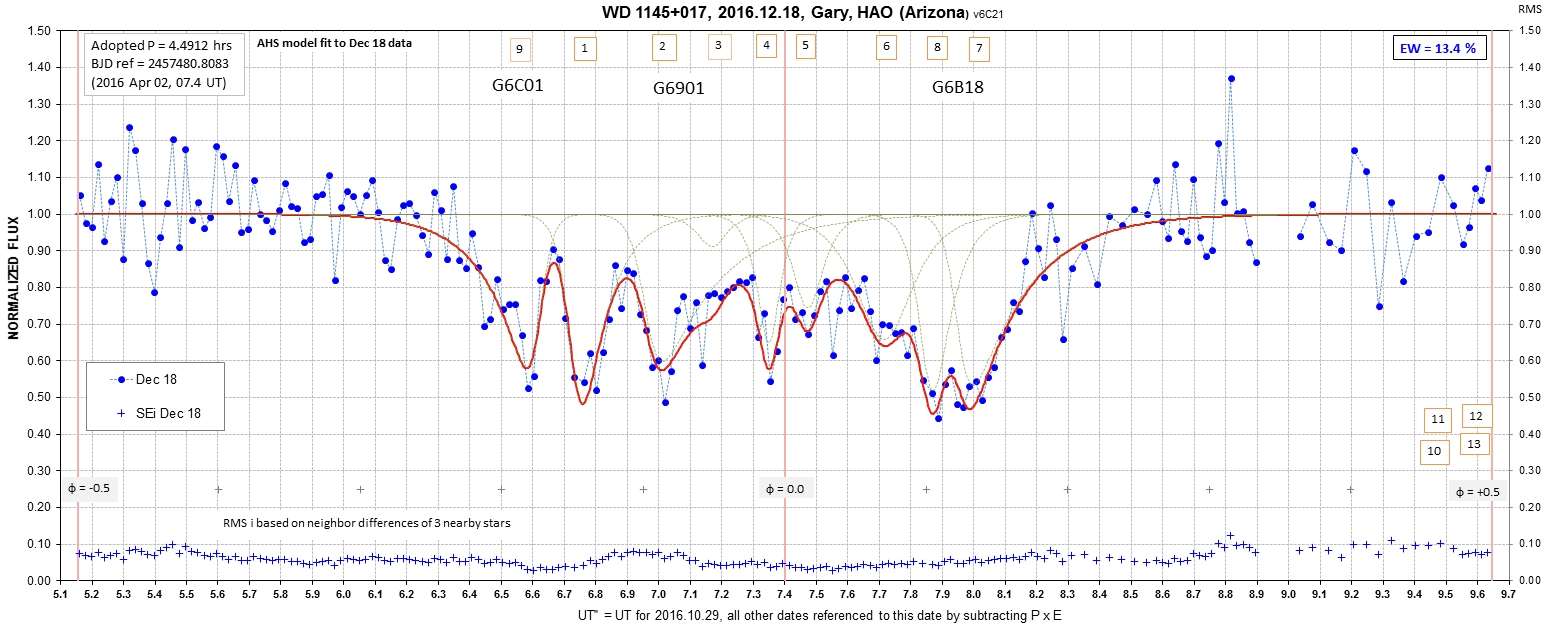
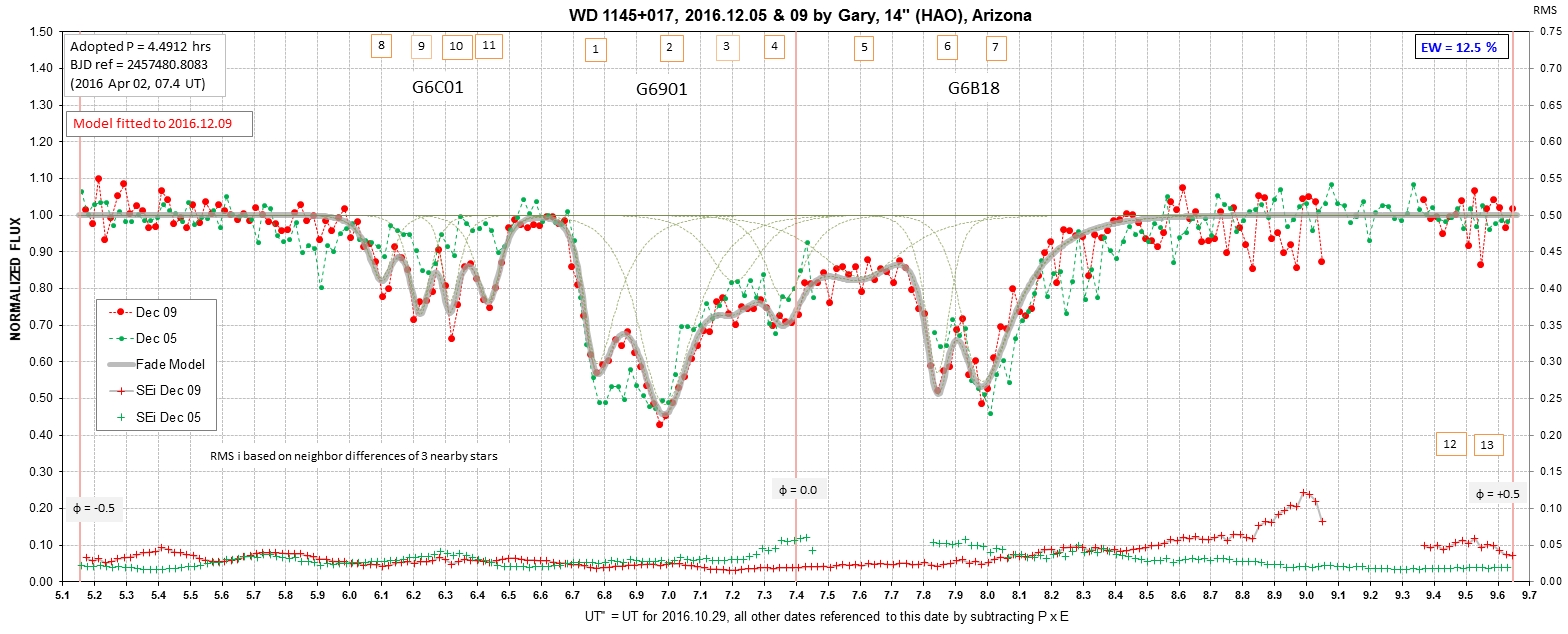
The above rubble pile "model" predicts that multi-wavelength measurements of dip depth will show that the trailing side of a group exhibits greater amounts of wavelength dependence of depth vs. wavelength (i.e., consists of a smaller population of dust). We need 2- or 3-color simultaneous LCs during the two dip groups, G6901 and G6B18.
Arguments like the ones above will possibly be used by modelers when there is sufficient observational evidence to work with.
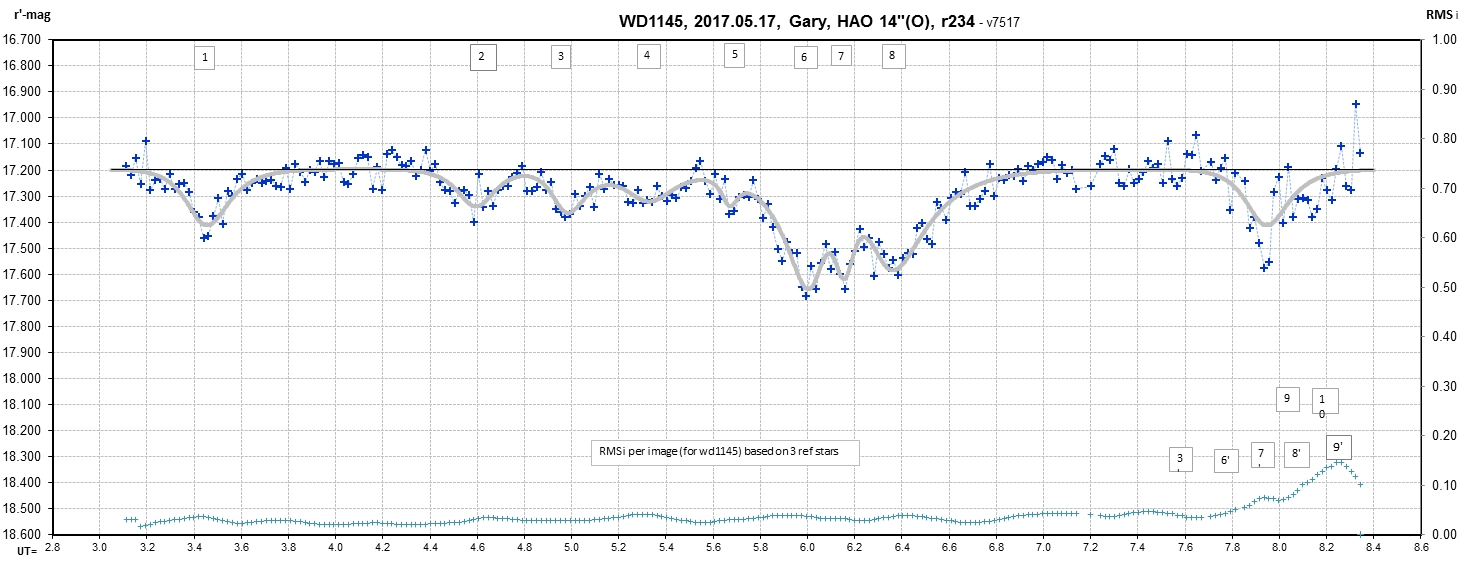
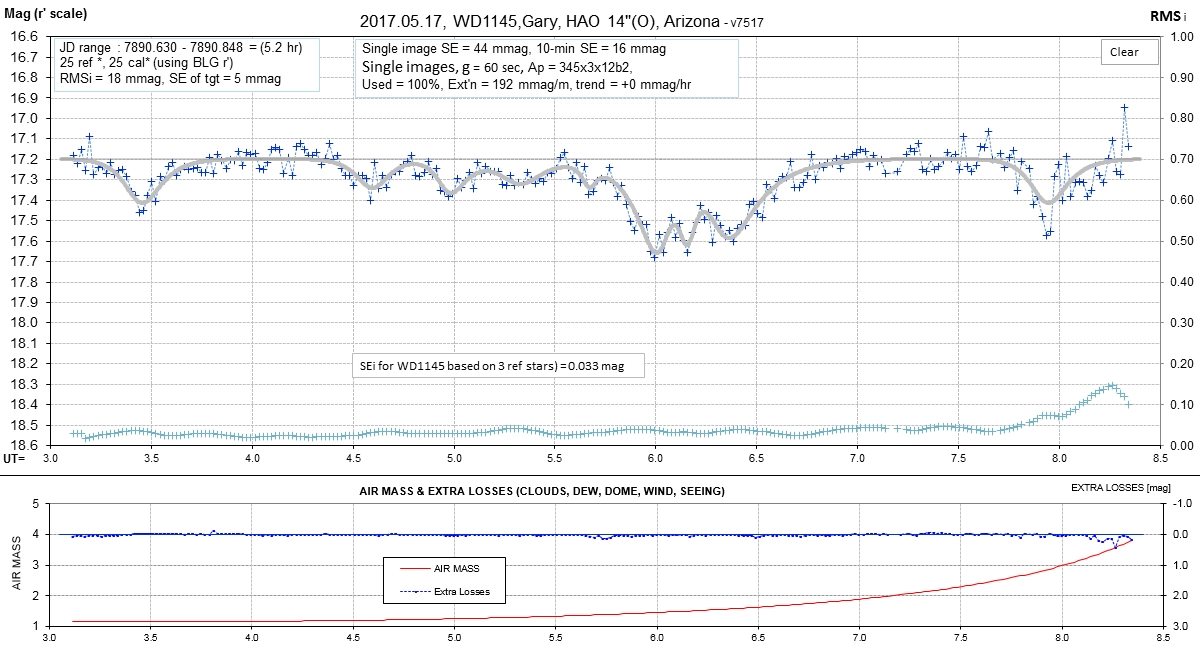
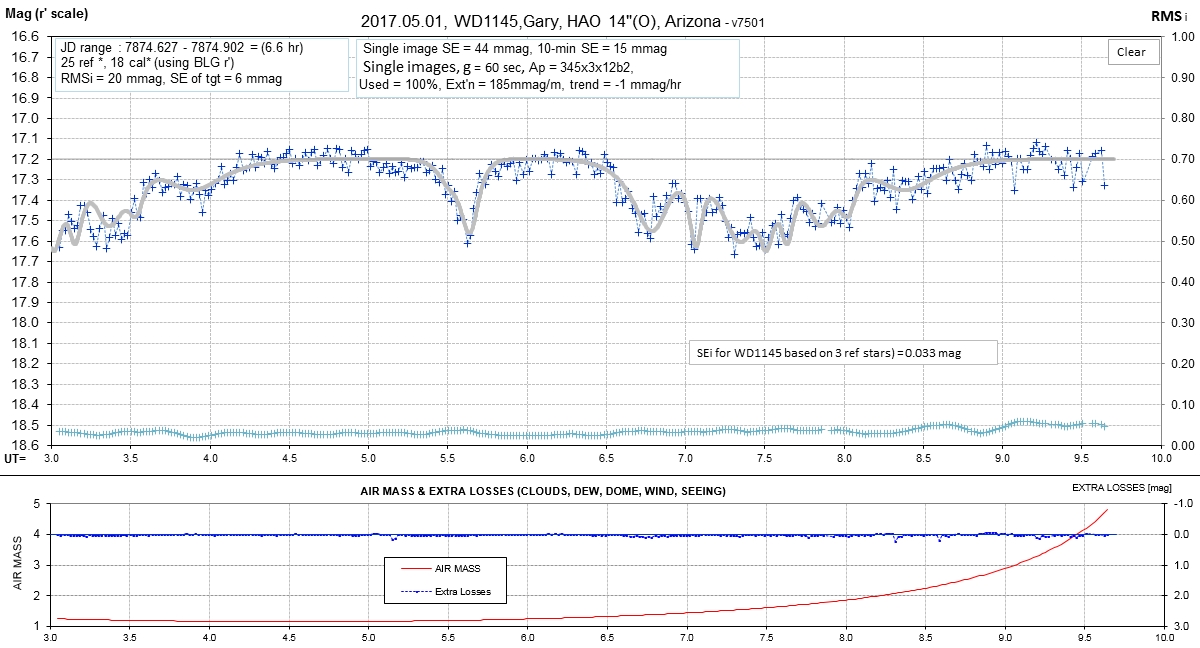
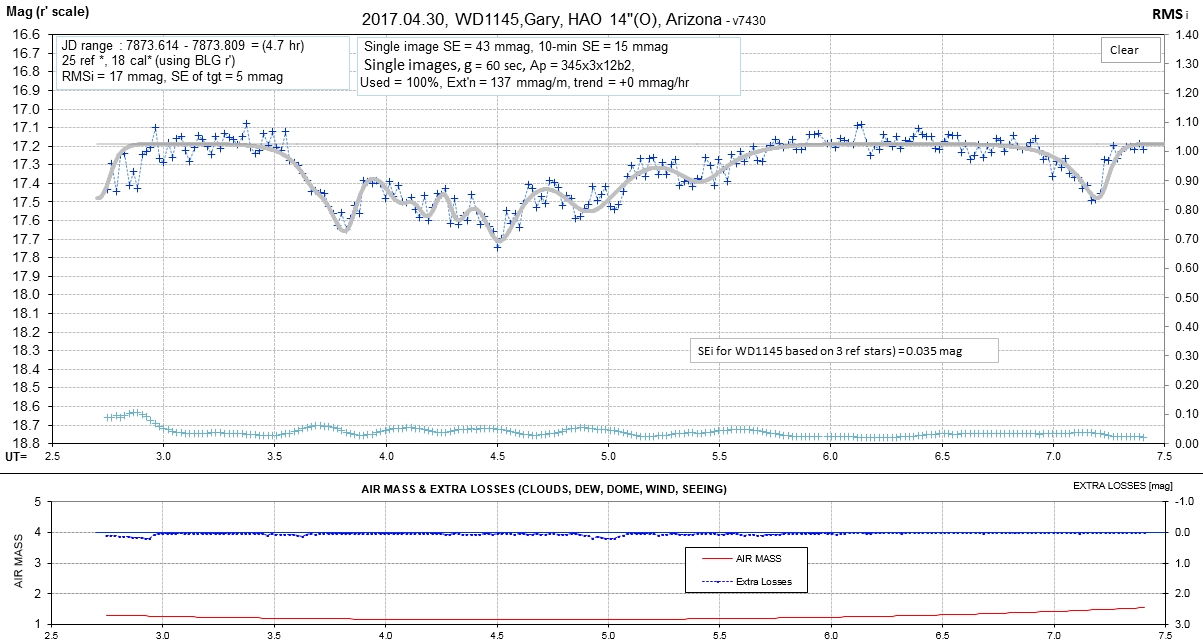
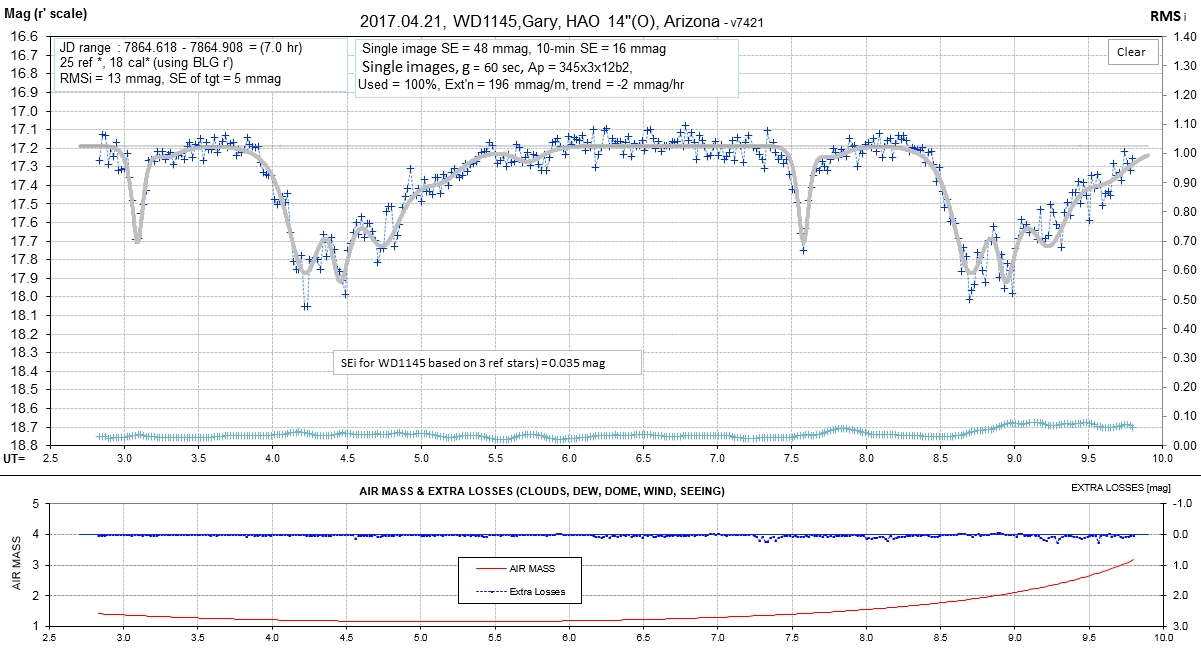
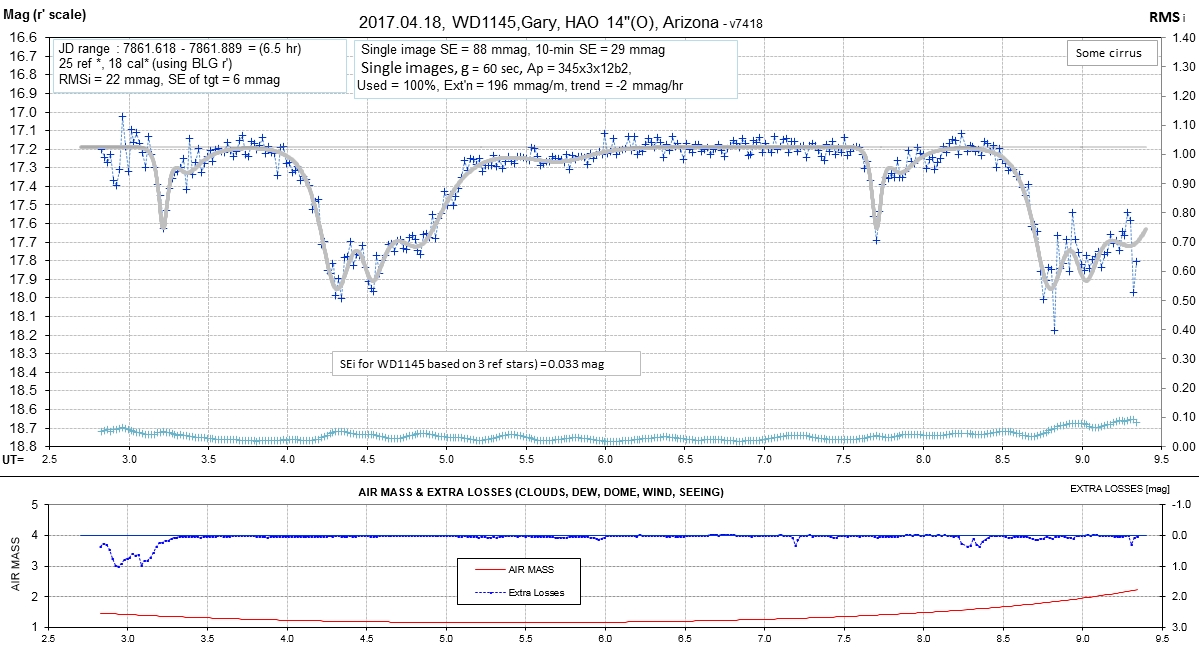
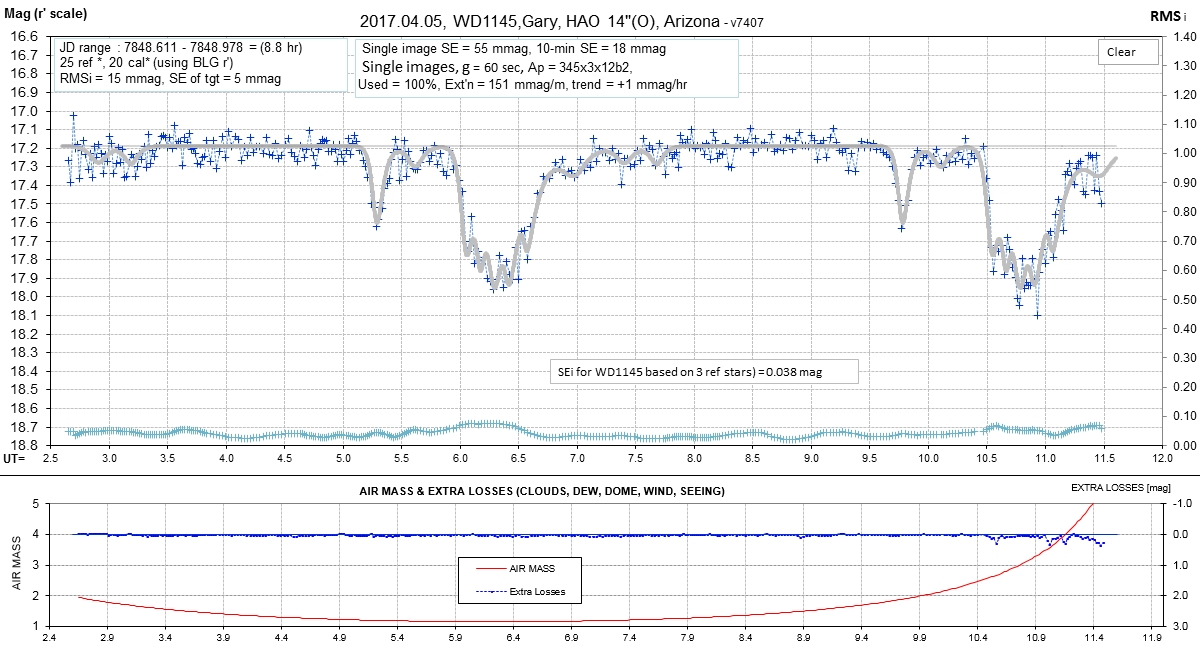
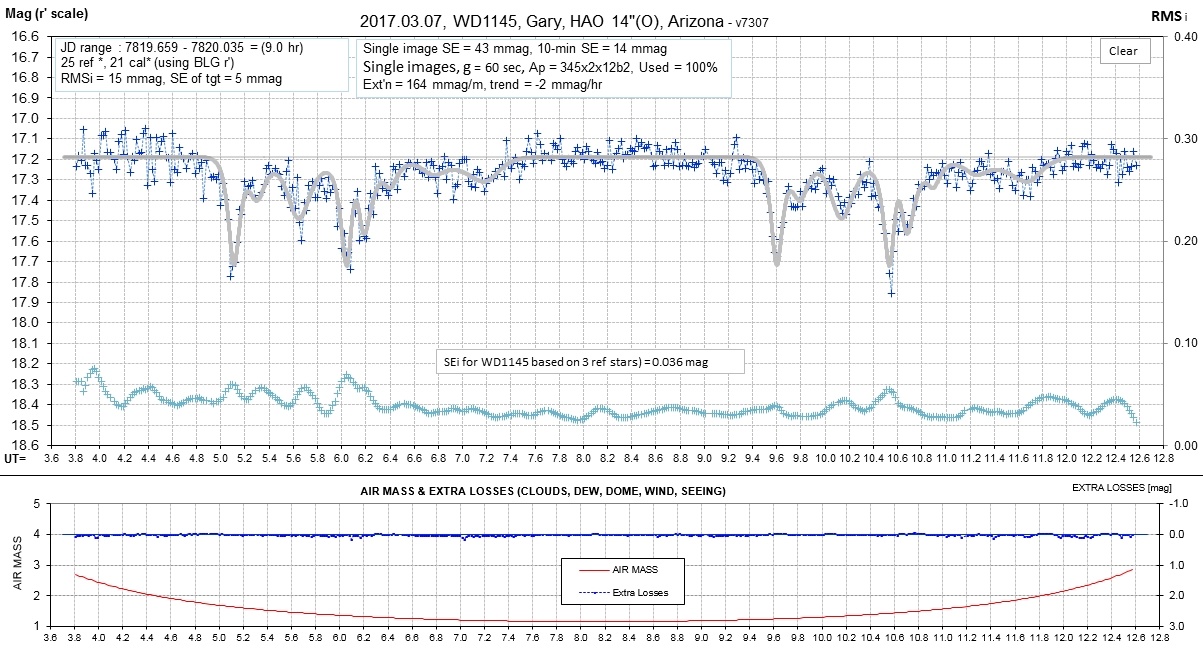
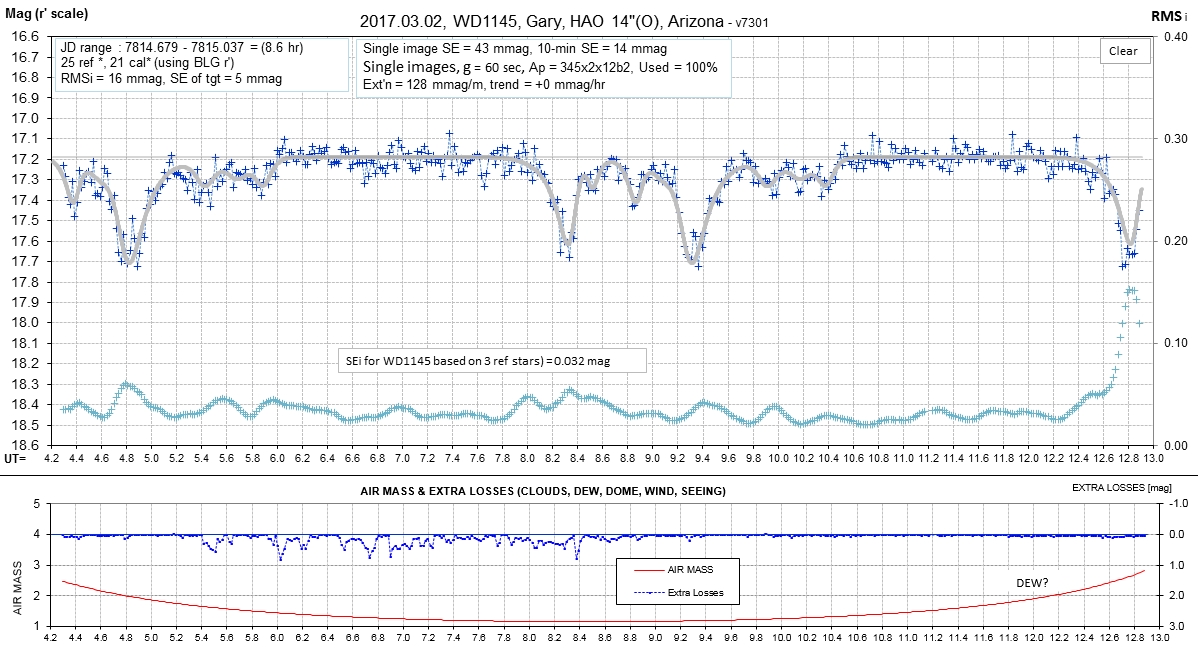
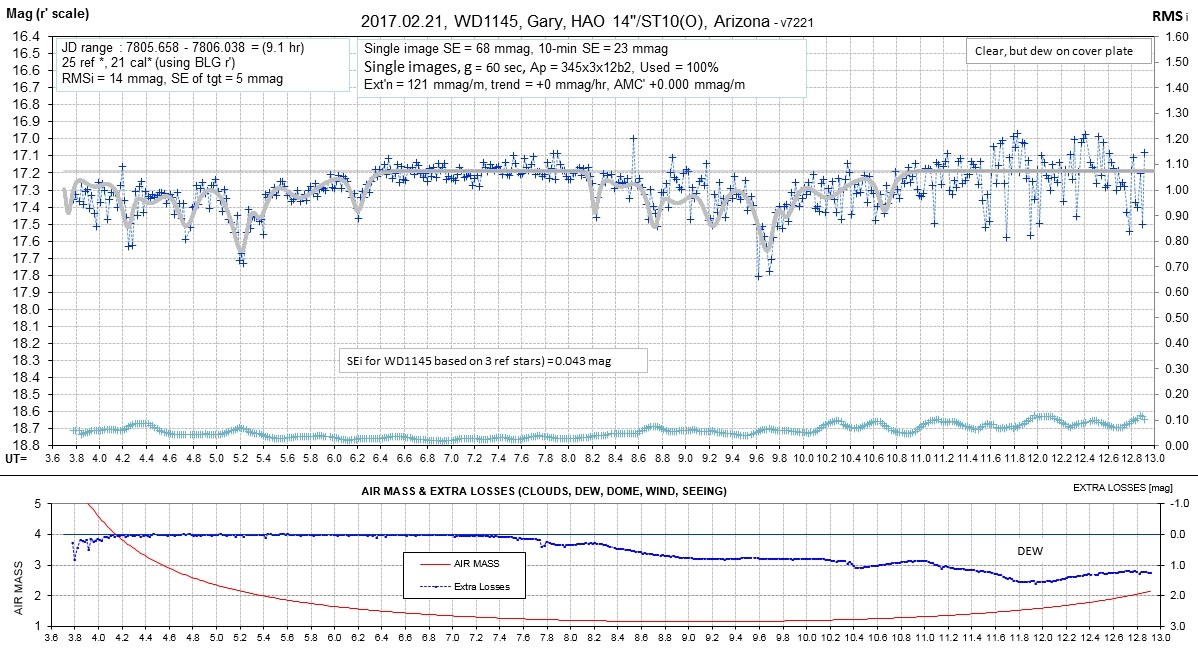
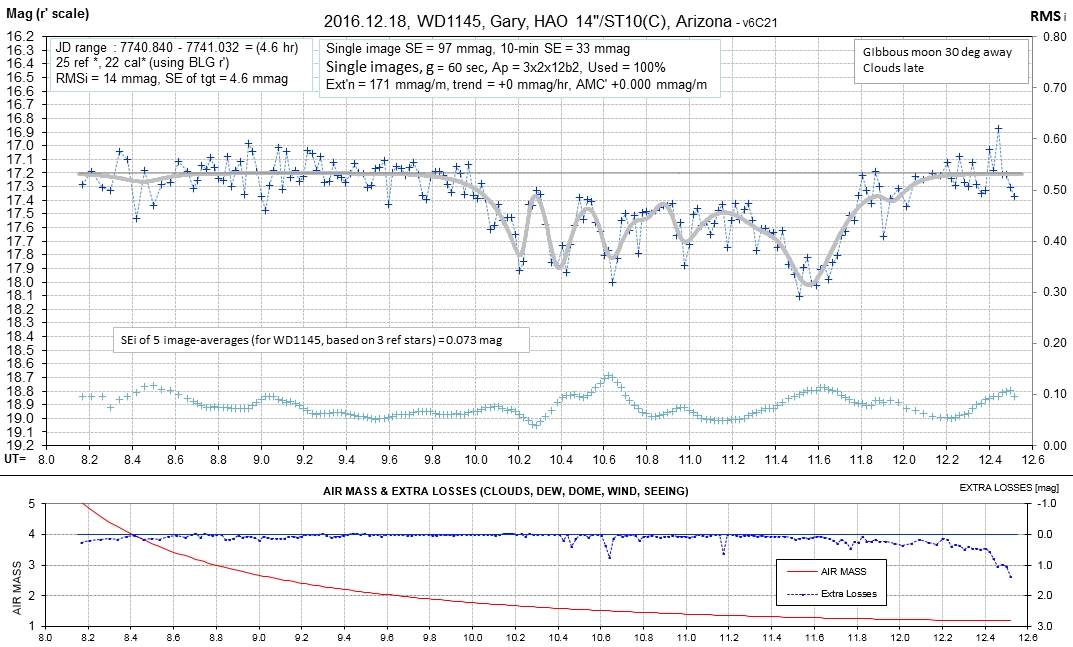
We need better photometric monitoring than I can provide with an amateur 14-inch telescope. I'm limited to 1-minute exposures with SNR that is only sufficient for characterizing 5% dips that last for 10 minutes or longer. Brief observations with large telescopes reveal the presence of 1% dip structure with 10-second temporal variations. There's a "sweet spot" for telescope size that will allow good SNR while permitting full orbit (4.5-hour) observing sessions at weekly intervals. I think that sweet spot aperture is 1 to 2 meters. This is an appeal for someone to take the lead in obtaining telescope time with a 1 to 2-meter telescope for weekly 5-hour observing sessions for the duration of the 2016/17 observing season (now to June).
Activity has decreased to ~7% after reaching an all-time high of ~ 17% (flux lost due to dust clouds, averaged over an orbit). The "high phase" set of several dips continue to march to higher phases. My favorite dip, Dip#1, is fading to almost nothing; it has lasted at least 6.7 months (and probably 8.4 months). At least one dip drifts with a period the same as the A asteroid, and it may have 3 or 4 companions drifting with the same period (all other dips have very slow drift rates with respect to the A asteroid fragments). It seems to have disappeared a few weeks ago.
Figure 1a. Latest phase-fold LC.
Figure 1b. Previous good-quality phase-folded LC.
Notice the monotonic trend for fading within the phase region +0.11 to +0.25.
The phase region showing fades in the previous figure does indeed show a simultaneous change at all phase values within that region starting ~ Jan 21. [Needs update]
Figure 2. Activity level vs. date. Activity level is defined as the sum of "area under the curve" for all dips occurring during a 4.5-hour orbit. A 45-fold increase is apparent during parts of the 8 months of our amateur team observations during the 2015/16 observing season compared with the Kepler K2 observations 2 years earlier. This increase may have occurred after a hypothetical collision between a fragment and the "mother ship" asteroid in 2015 September (Event 1). Activity level declined steadily starting in 2016 April, and by the end of the first observing season (2015/16) activity had returned to a level almost as low as before the September 2015 event. However, the first few observations of the new observing season (starting 2016 Oct) shows an uptick of activity, reaching ~ 80 times the K2 level of activity (as of 2017 January). The rise in activity leveled off, and is now decreasing.
Figure 3. Expanding the date scale shows when event #5 may have occurred. It had to be between 2016.07.23 (the last measurement of the 2015/16 observing season) and 2016.11.06 (when it was first noticed, at a level of ~ 4%). The model shows event #5 with a "box" to indicate possible suggested onset dates (i.e., for the first group of dips). Event #6 has a well-established date of 2016.11.19 (the first green symbol).
Waterfall diagram for 2016/17 season. Dip #1 has lasted 175 days (5.8 months). Dip "A" has the same period as what we used to refer to as the "mother asteroid" so maybe the "A" period is really for L2 fragments. That would make the bulk of dips coming from L1 fragments, with only occasional in-between dip periods associated with the asteroid "mother ship." There appears to be a collision, or break-up, of the fragment producing Dip#1 in mid-February, leading to 3 to 5 smaller fragments that produce smaller and occasional dips.
Another display format with objective solutions for drift line fitting. Adopted period corresponds to my estimate of the "A" asteroid (4.495 hr). Drift lines sloping to the left (going up in time) have periods shorter than the ephemeris period (my adopted "A" asteroid); drift lines sloping to the right have longer periods; drift lines with no slope (moving straight up) would have the same period as my adopted "A" asteroid. Most drift lines slope to the left because more fragments drift away from the L1 end of the asteroid because it is hot; very few drift lines slope to the right because very few fragments drift away from the L2 end because it is cool (perpetual shadow). Drift line 1 has lasted 137 days (4.5 months). [Needs to be updated]
Properties of Drift Line #1 (cf. previous figure). It's fading, and currently has the lowest depth since it was first detected (2016 Nov 6). [Needs updating]
Most fragments are expected to come from the L1 end of the asteroid, so most dust clouds should have the L1 fragment periods. Fewer fragments should come from the L2 end because it is cooler (because it's in shadow). I don't know if the asteroid itself can produce dust clouds because of its gravity.
Links on this web page:
Some physical model thoughts
List of observing sessions
Observing session observations
Finder image
Data exchange files
References & related links
My collaboration policy
Some Physical Model Thoughts and Appeal for "Sweet Spot" Telescope Observations
Figure 3 in the previous section shows an "activity slope" of 3.7 %/day starting with Event #6. Let's consider this to be characteristic of how fast a dust cloud's "total projected area" increases with time after a "collision" event. The term "total projected area" refers to the projected area of dust particles with circumferences larger than optical wavelengths (i.e., Mie scattering regime). Imagine that a "collision" event produces particles with a size distribution that ranges from microns to meters, for example. The small particles will be pushed outward from the WD by radiation pressure, so they will be in orbits with ever-longer periods, causing the dust cloud to expand in phase to larger values (i.e., a trailing tail). This is what we see for the second dip group in Fig. 4, above. Presumably, all particles will produce molecules of minerals due to sublimation, and these may recondense to Mie size small particles. The smallest source particles will evaporate first (due to sublimation), and thereby be removed from the original particle size distribution. The remaining larger particles will sublimate, and become smaller. It should be possible for detailed models of these processes to make use of the 3.7 %/day activity slope as an observational constraint.
We can also imagine that the first group of dips underwent this process starting at an earlier date (as suggested by Andrew Vanderburg, private communication). Note that the first dip group has a trailing tail appearance. Note further that this group has a stable "lead-off dip" that is sharp and stable in phase; this could be a dust cloud produced from a population of large particles whose orbits haven't been affected by radiation pressure.
Note that I haven't taken a position on whether the asteroid and its fragments are consolidated rock or rubble piles (like almost all solar system asteroids smaller than a certain size). If the parent body asteroid is a rubble pile, the "fragments" that break away (from the L1 end) would start out as a "clump of rubble," possibly held together initially by inter-molecular forces (in the same way that asteroids small enough to violate the 2.2-hour "spin barrier" are held together). These, in turn will be destined to come apart, especially if they rotate fast; fresh surfaces would then be exposed to heating on all sides. Sublimation will erode outer surfaces, and the strong gravitational field gradient will flex the rubble clump, causing it to expand further. The lowest density rubble clumps will break apart before the denser ones (i.e., at larger distances from the WD).
In this model we are dealing with fragments composed of "gravel" with an inherent size distribution. For fragments that are actually a "clump of rubble" instead of a solid rock it is easier to produce "events" of increased activity. This is because we no longer require actual "collisions" to initiate dust cloud production. Instead, all we require is that a "clump of rubble" be disturbed enough by the various forces acting on it to begin a process of coming apart. The coming apart will release "gravel" with a size distribution encompassing a wide range of sizes. The smallest particles will have the greatest surface area per mass ratio, and can be expected to dominate dust cloud production immediately after "clump of rubble" breakup. All particles will present "fresh surfaces" for sublimation. The argument about radiation pressure producing a trailing tail can be invoked. When a "clump of rubble" fragment begins to break apart it may produce chunks of rubble that slowly separate, turning the pile into a "rubble cloud." Less shading within a cloud will lead to more sublimation (Chiang, private communication). If the rubble clump breaks apart from spinning the smaller clumps, or rubble clouds, will separate from each other. Each such rubble cloud will produce dust clouds due to sublimation, and when these are of a size to block a few percent of WD light in their orbit the dips produced will form drift lines in a waterfall diagram that have slightly different slopes. Assuming the dust clouds last for several weeks, as they have been noted to do, the fade pattern will consist of several dips that spread apart week after week. Projection of the waterfall drift lines backward to a convergence date would allow determination of the rubble clump's break apart date.
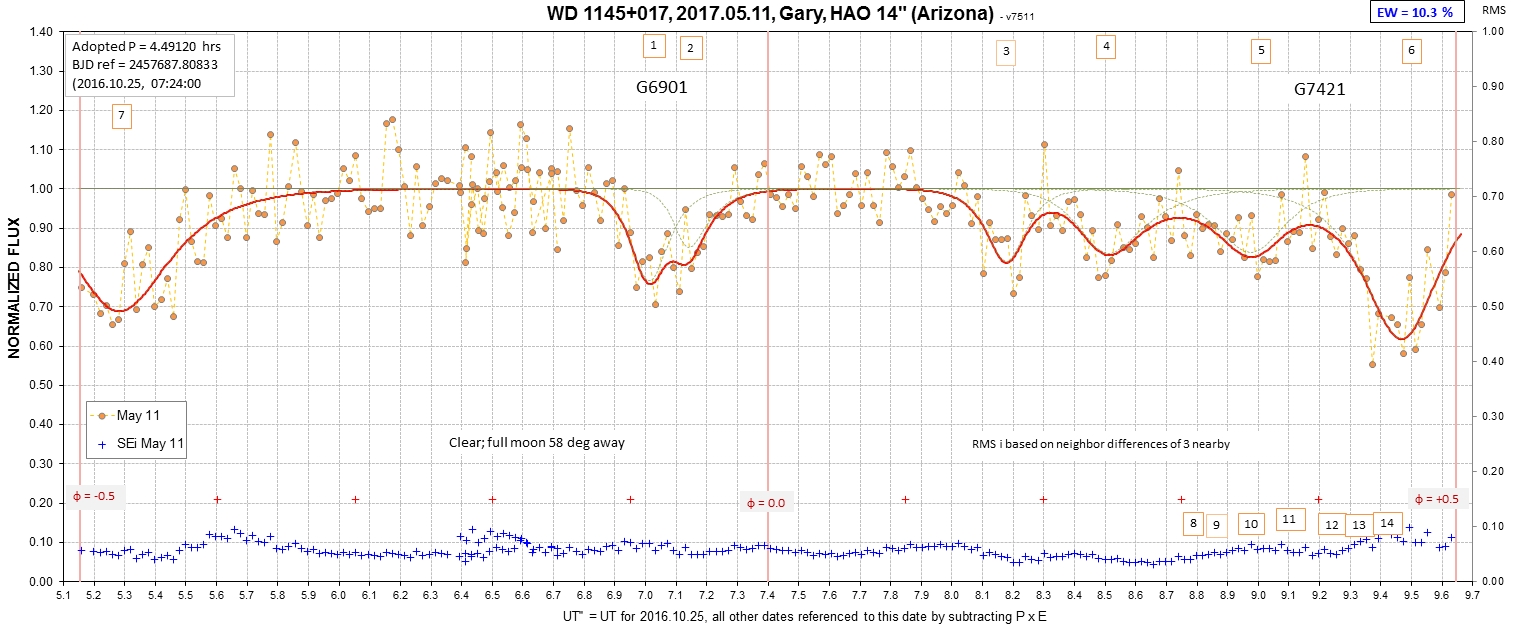
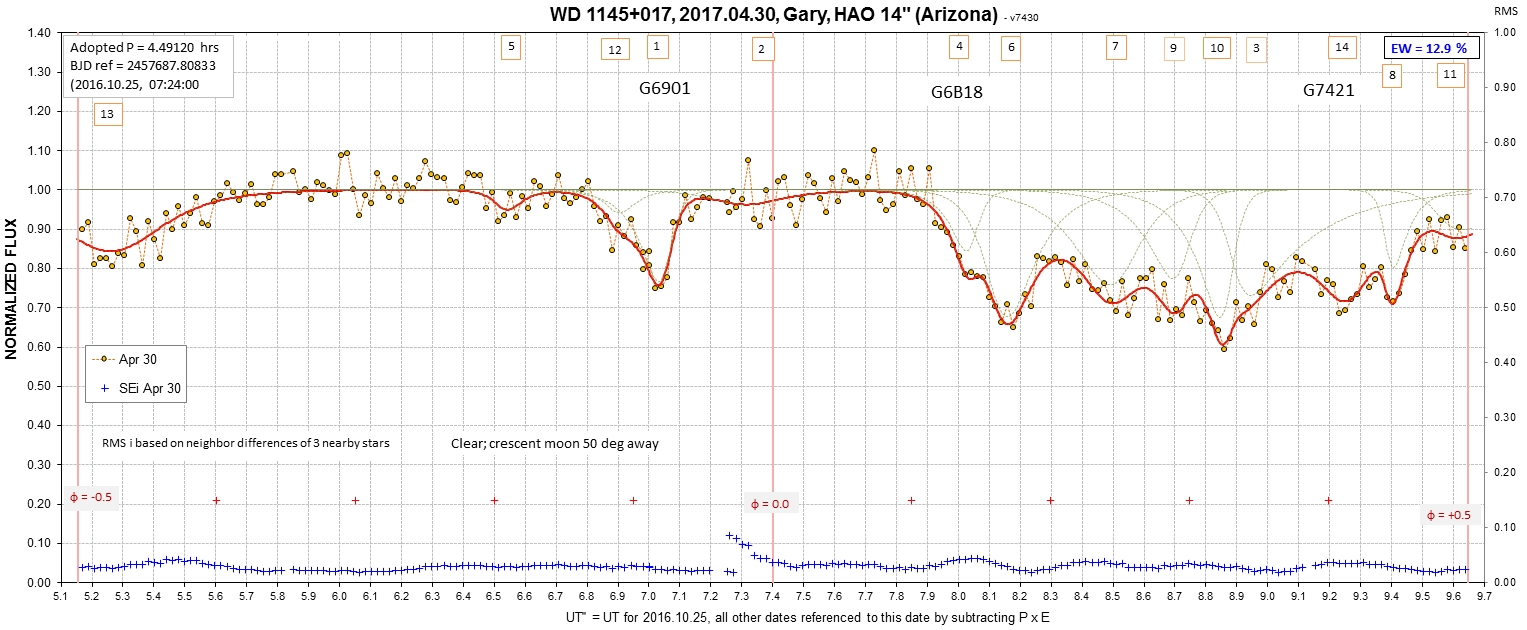
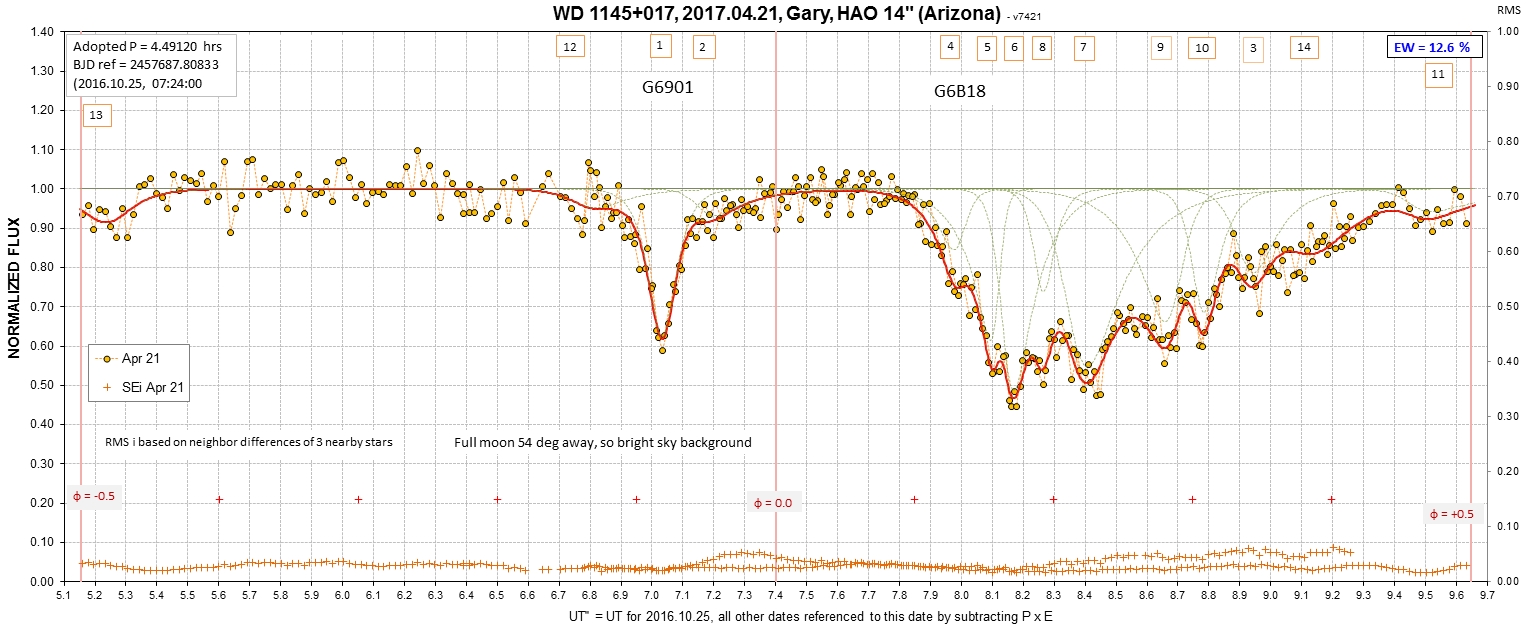
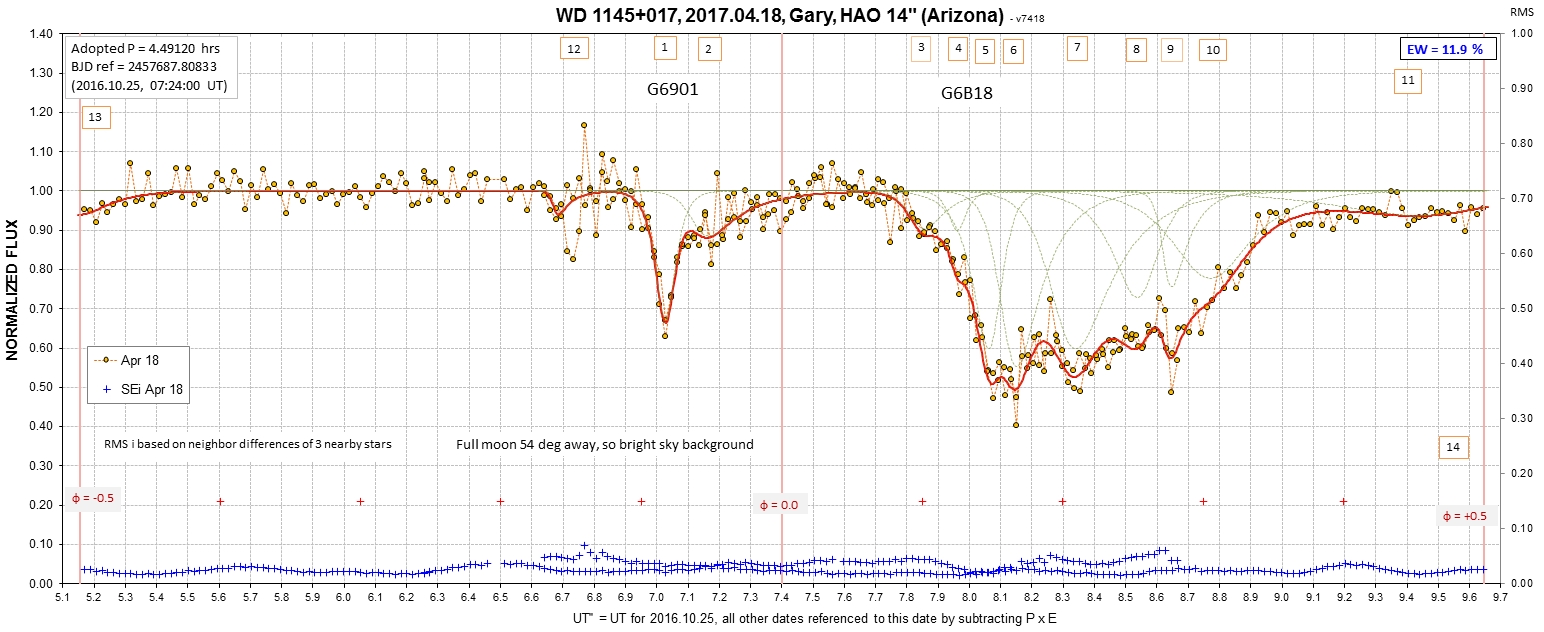
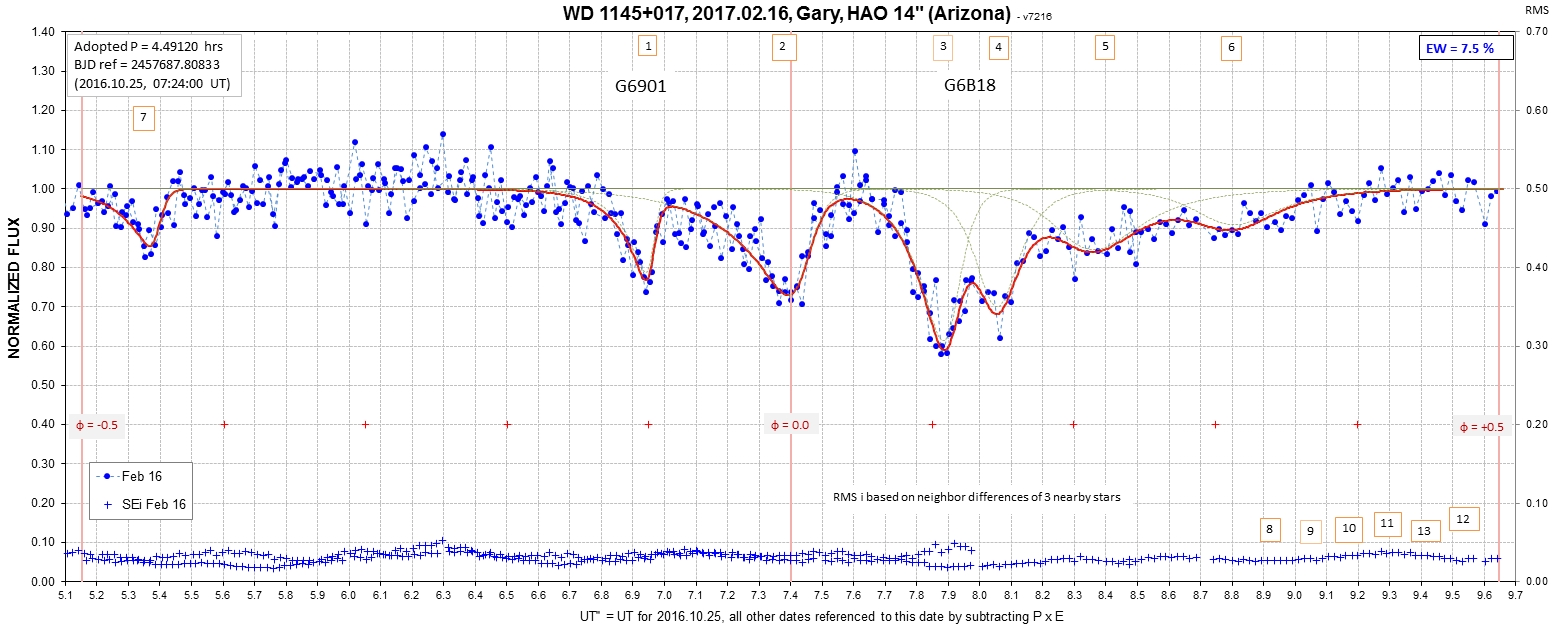
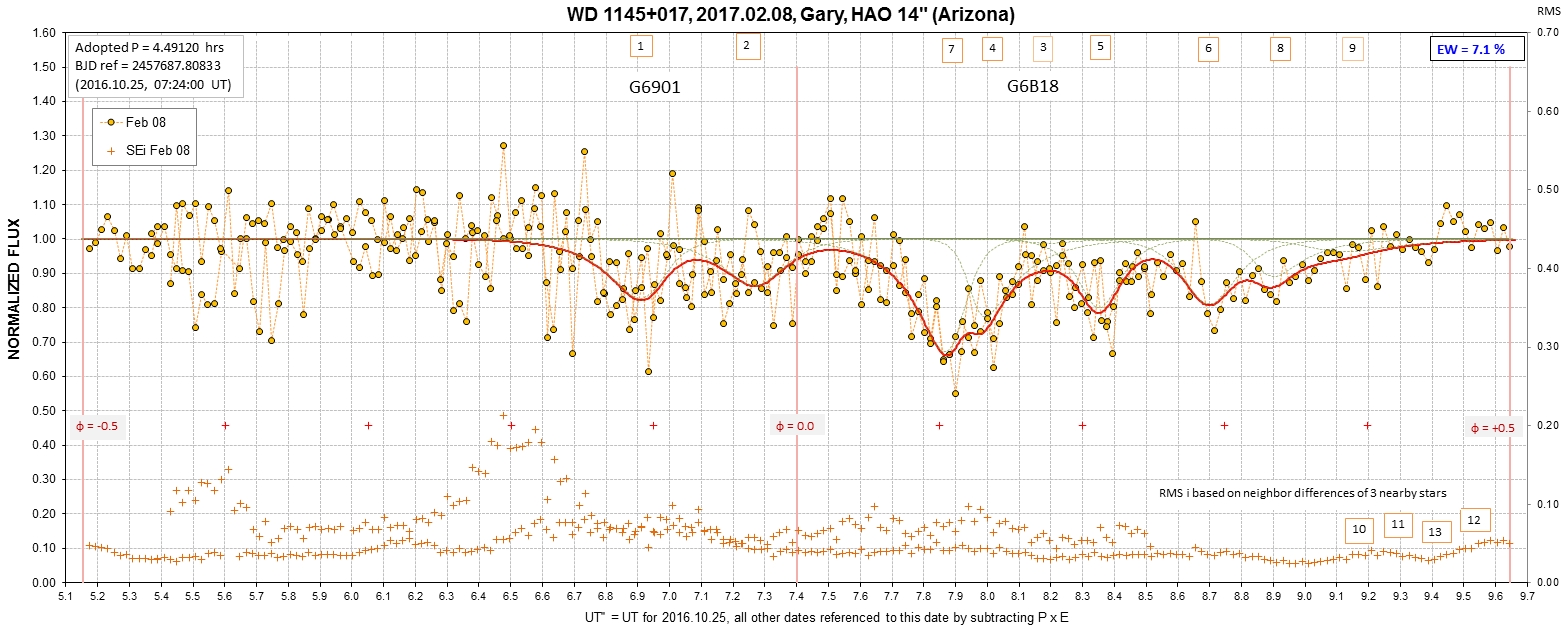
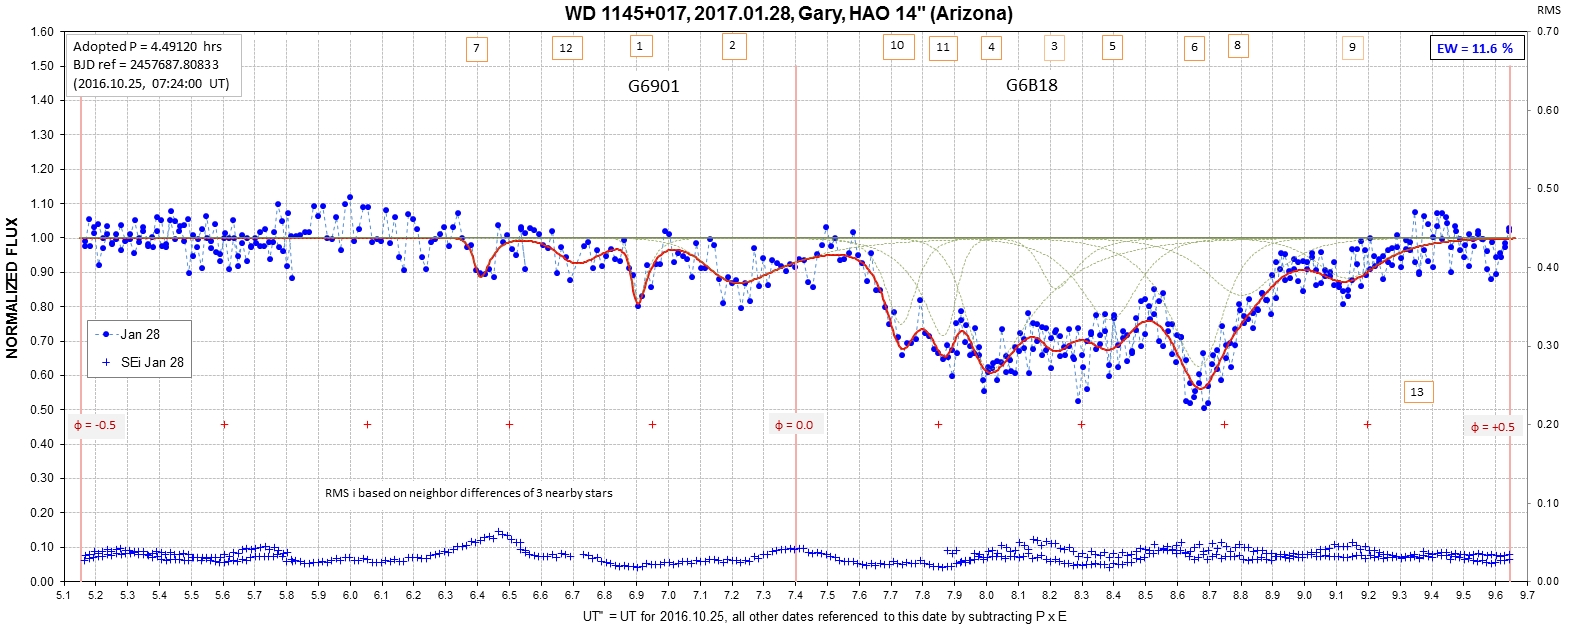
The above rubble pile "model" predicts that multi-wavelength measurements of dip depth will show that the trailing side of a group exhibits greater amounts of wavelength dependence of depth vs. wavelength (i.e., consists of a smaller population of dust). We need 2- or 3-color simultaneous LCs during the two dip groups, G6901 and G6B18.
Arguments like the ones above will possibly be used by modelers when there is sufficient observational evidence to work with.
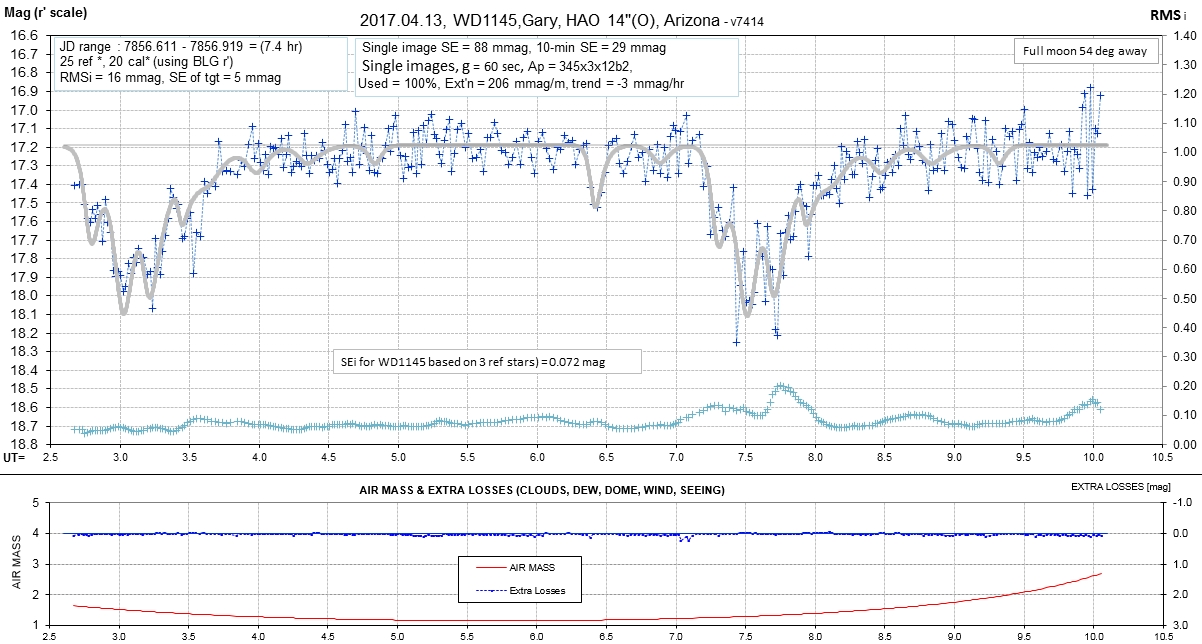
We need better photometric monitoring than I can provide with an amateur 14-inch telescope. I'm limited to 1-minute exposures with SNR that is only sufficient for characterizing 5% dips that last for 10 minutes or longer. Brief observations with large telescopes reveal the presence of 1% dip structure with 10-second temporal variations. There's a "sweet spot" for telescope size that will allow good SNR while permitting full orbit (4.5-hour) observing sessions at weekly intervals. I think that sweet spot aperture is 1 to 2 meters. This is an appeal for someone to take the lead in obtaining telescope time with a 1 to 2-meter telescope for weekly 5-hour observing sessions for the duration of the 2016/17 observing season (now to June).