J0328-1219 Photometry Observations, Web Site #1
 by Amateur Bruce L. Gary Using a 16" Telescope at the Hereford Arizona Observatory (HAO)
Bruce L. Gary, Last updated: 2021.12.12, 01 UT

This web page is meant to be an archive of my light curve observations for "Observing Season #1" of white dwarf J0328 using the HAO backyard observatory 16" Ritchey-Chretien AstroTech telescope with a SBIG XME-10 CCD, unfiltered (link). Most of my web pages are meant for documenting observations and analysis results for myself (it's easier than using a filing cabinet). My web pages can sometimes serve to help with collaborations when I join with others to study the same star. My Web Site #2 is located at http://www.brucegary.net/J0328-2/; it includes my observations during the second observing season, starting on 2021.11.28.  

Status Summary


Figure 1. Waterfall plot showing presence of dips as a function of date and phase for all HAO data.


Figure 2. Combining LCs for late January and early February (5 nights).


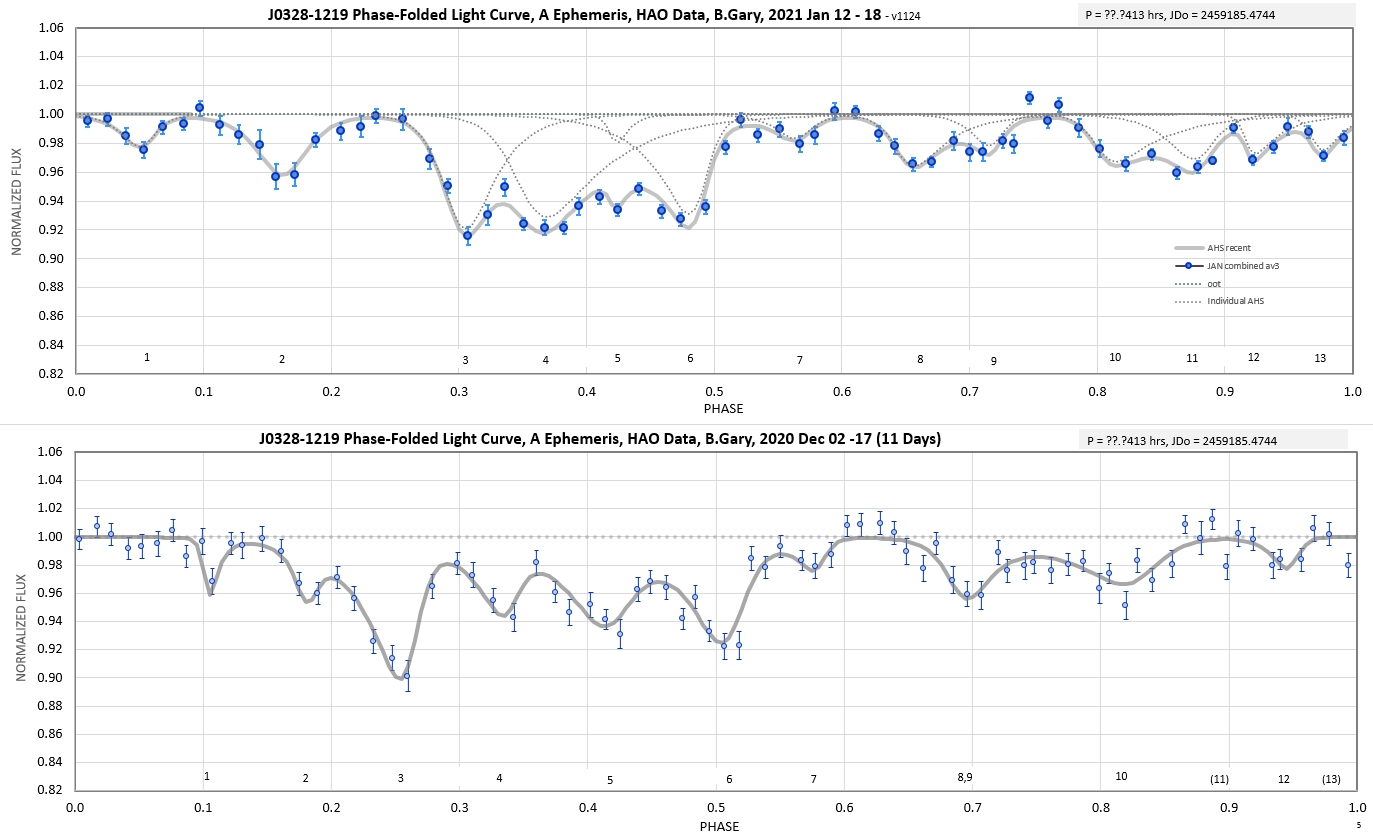
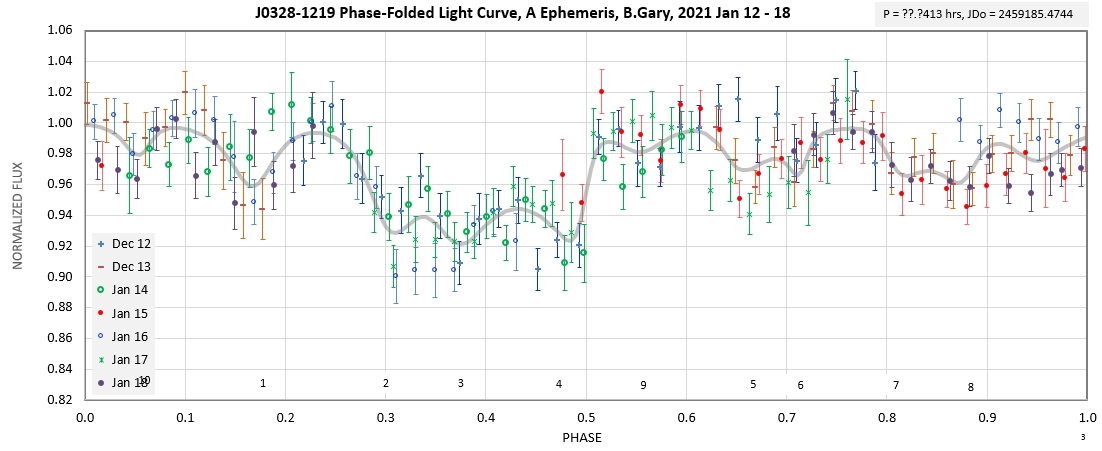
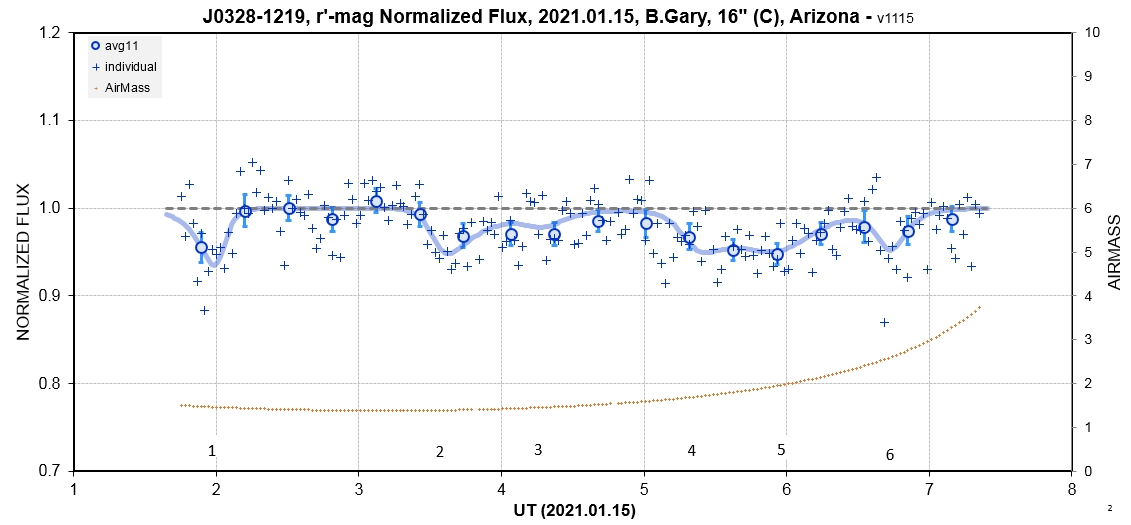
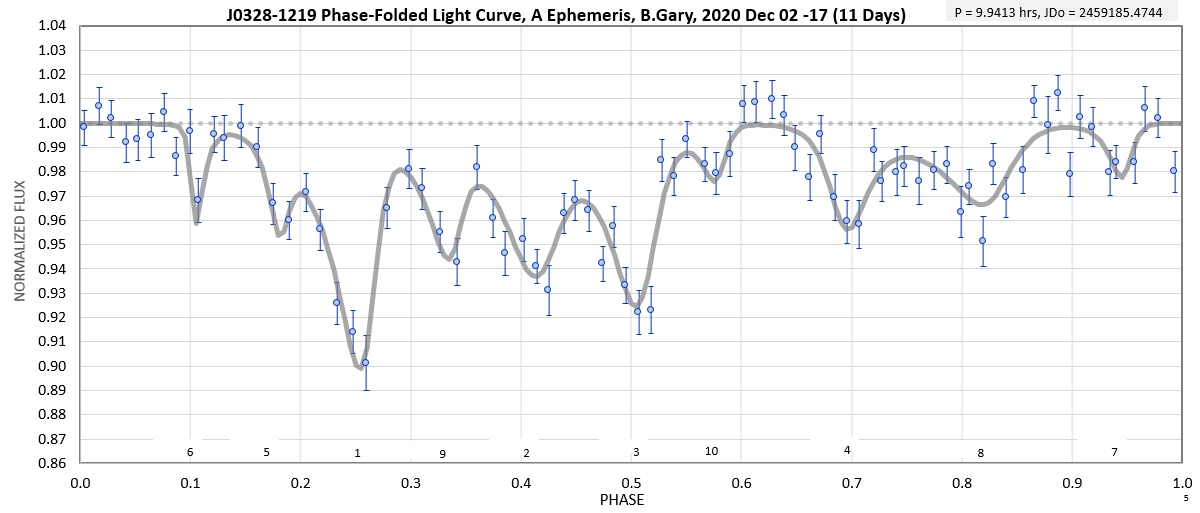
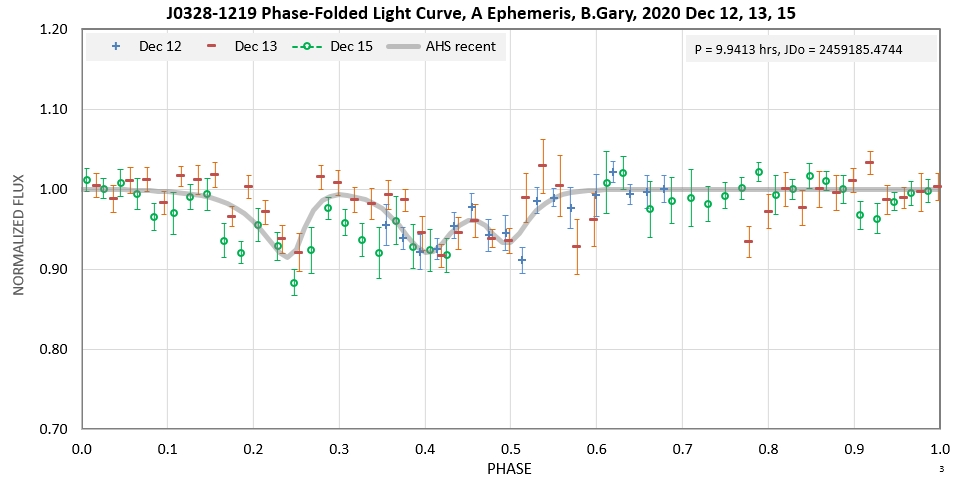
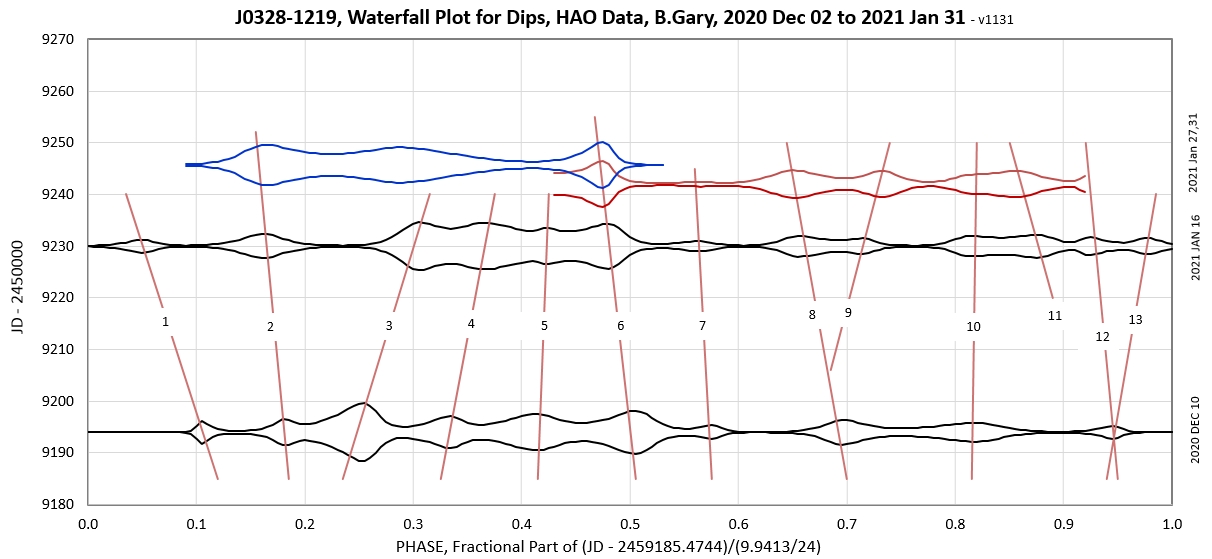
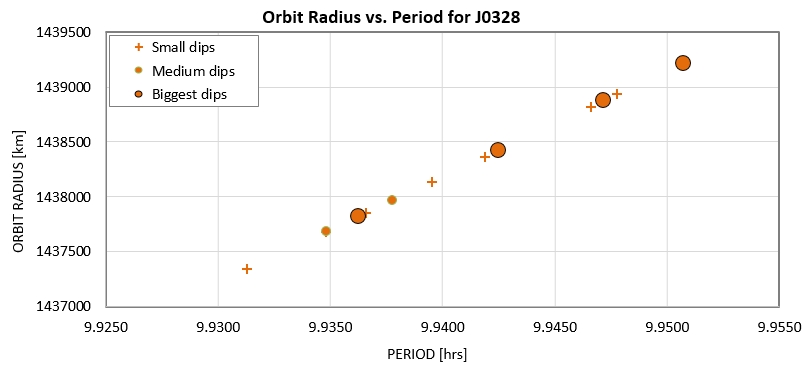
Figure 3.
Combining LCs for early December (6 nights) and early January (5 nights), showing 10 dips in both data sets plus one dip that is present in only the December data (Dip 3).

Notice the similarities and some differences between December and January. Some dust clouds are in slightly different orbits compared to other dust clouds (based on their different phase movements). What happened to Dip #11 that was present in December but completely missing in January? A new dip appeared in January at phase 0.65. This behavior is similar to what happens at WD1145.

Note: I'm not showing the period used for phase folding because this might detract from the paper that a professional astronomy group is preparing. (After publication I'll add
P info to these graphs.)


General Information

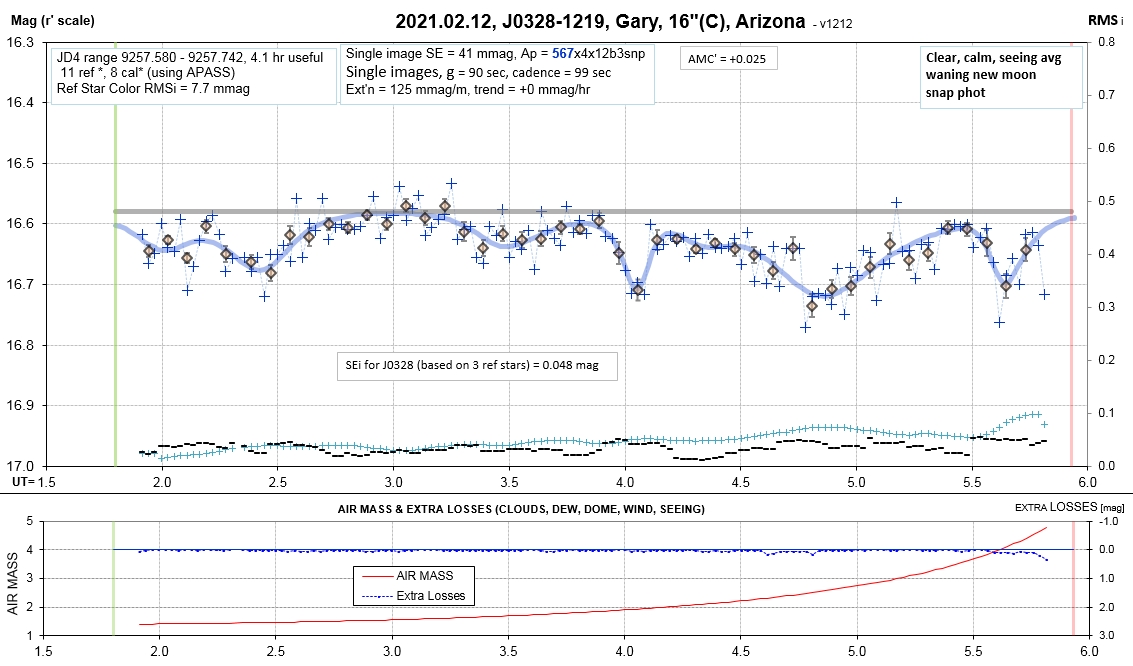
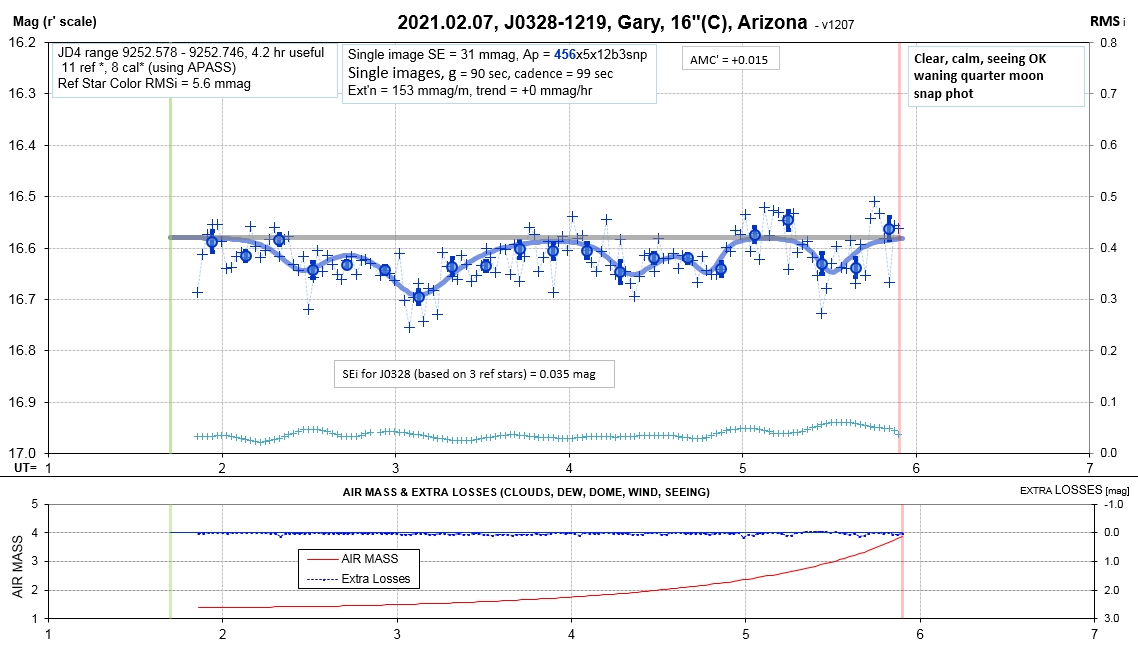
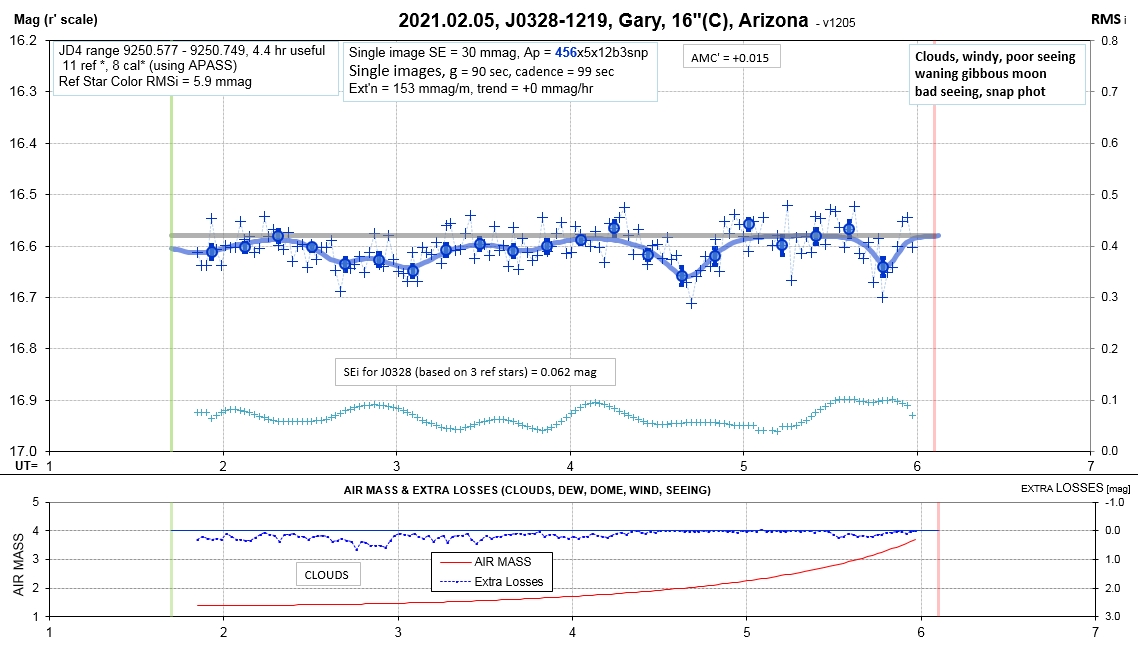
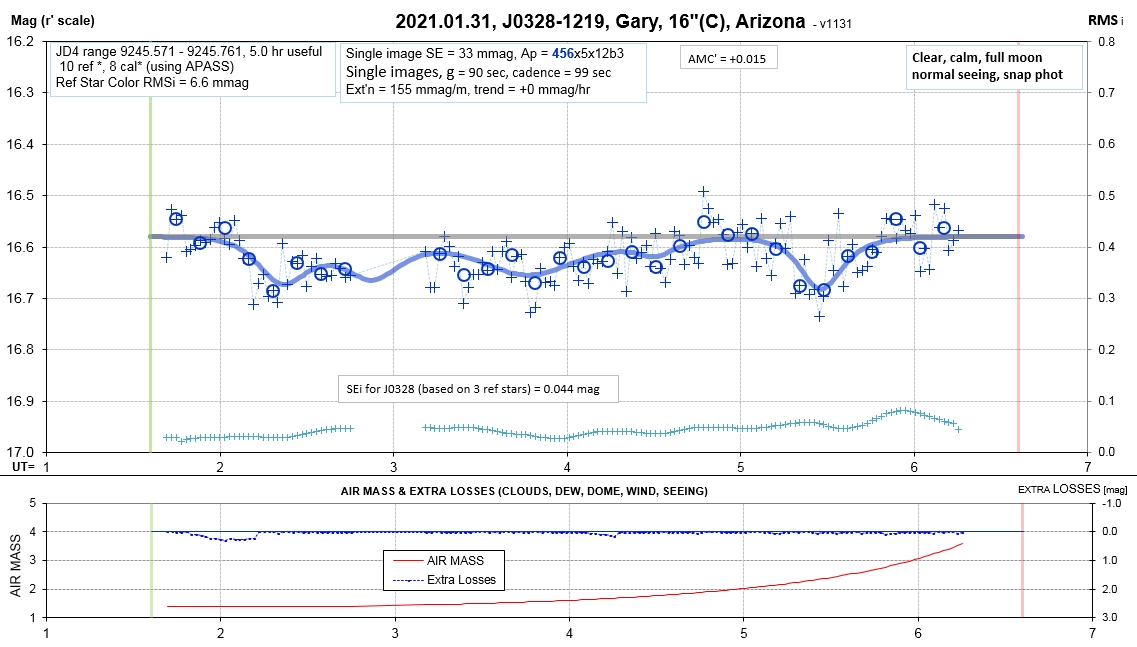
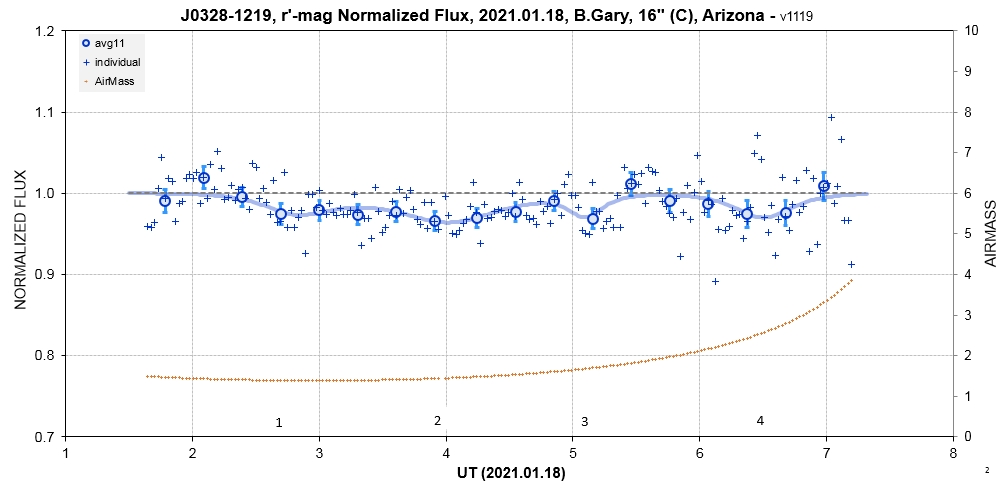
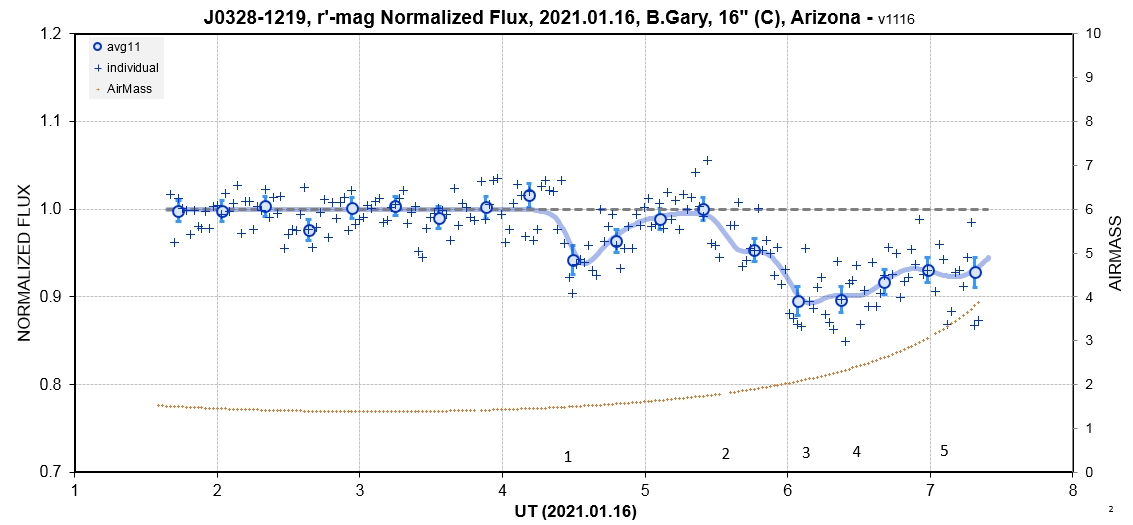
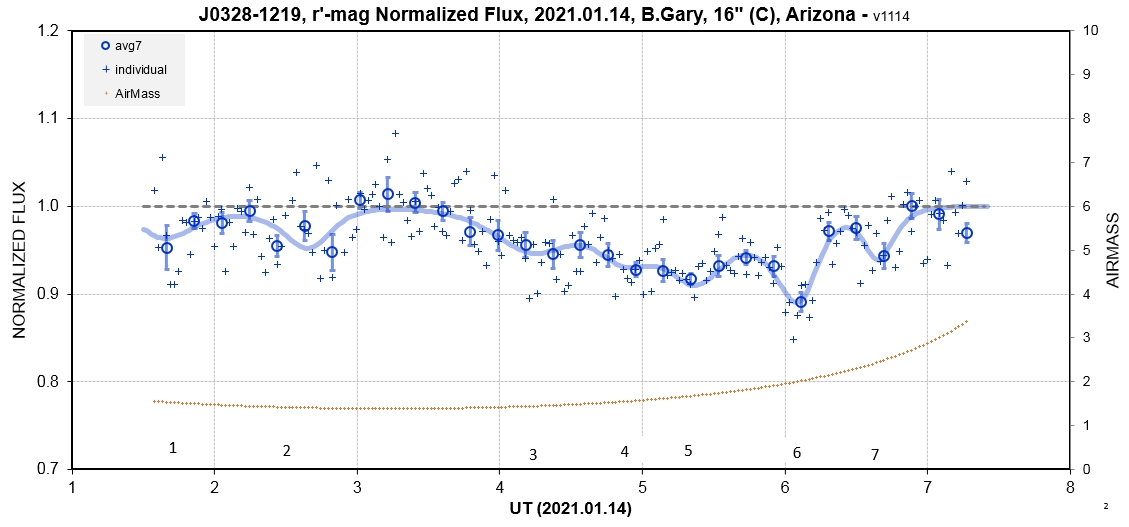
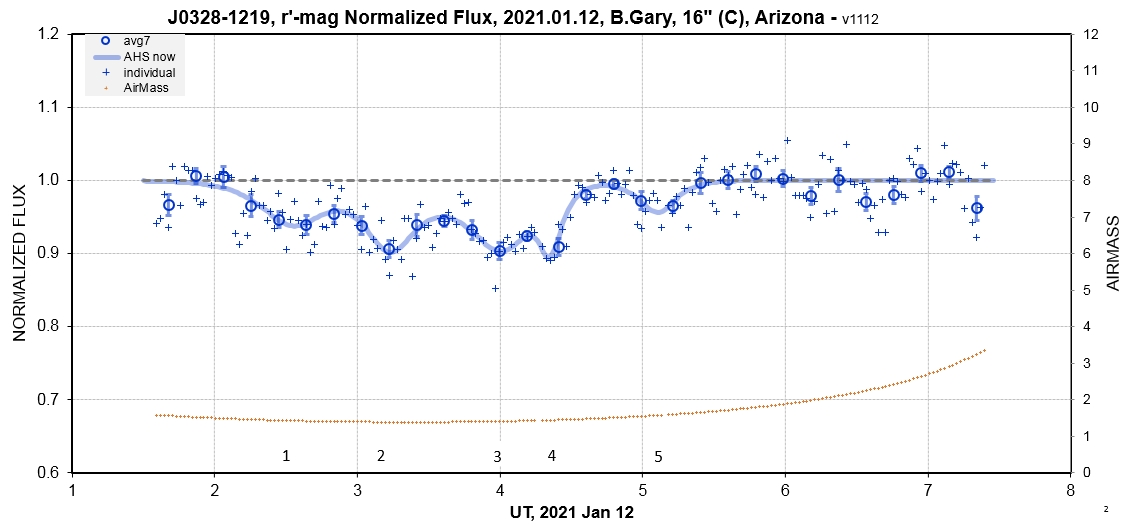
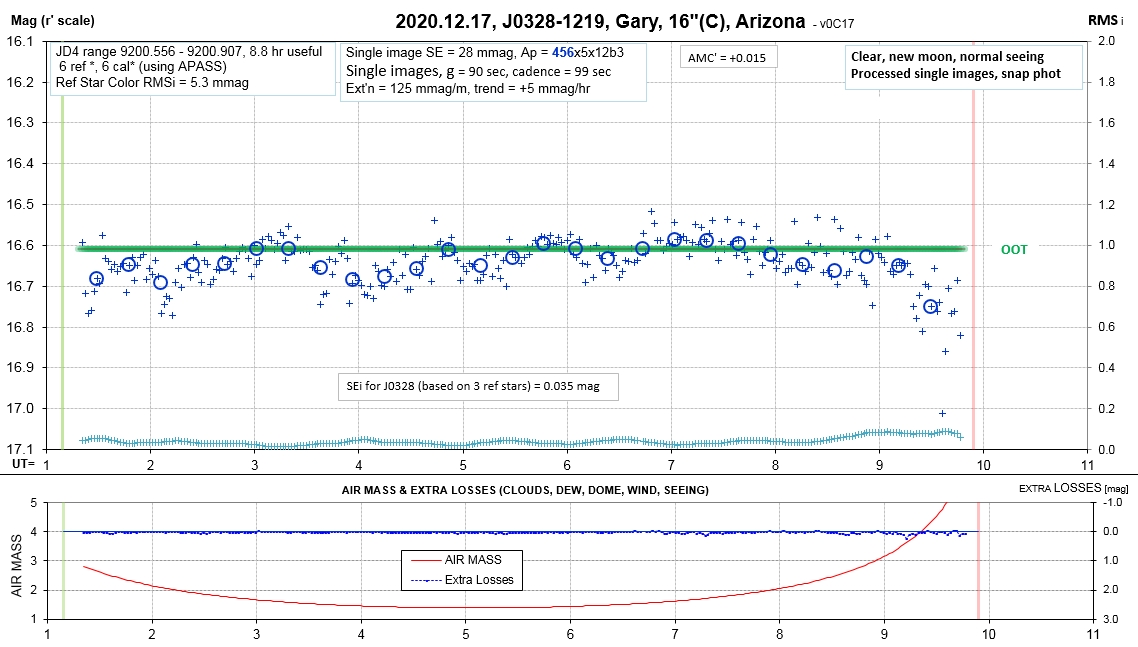
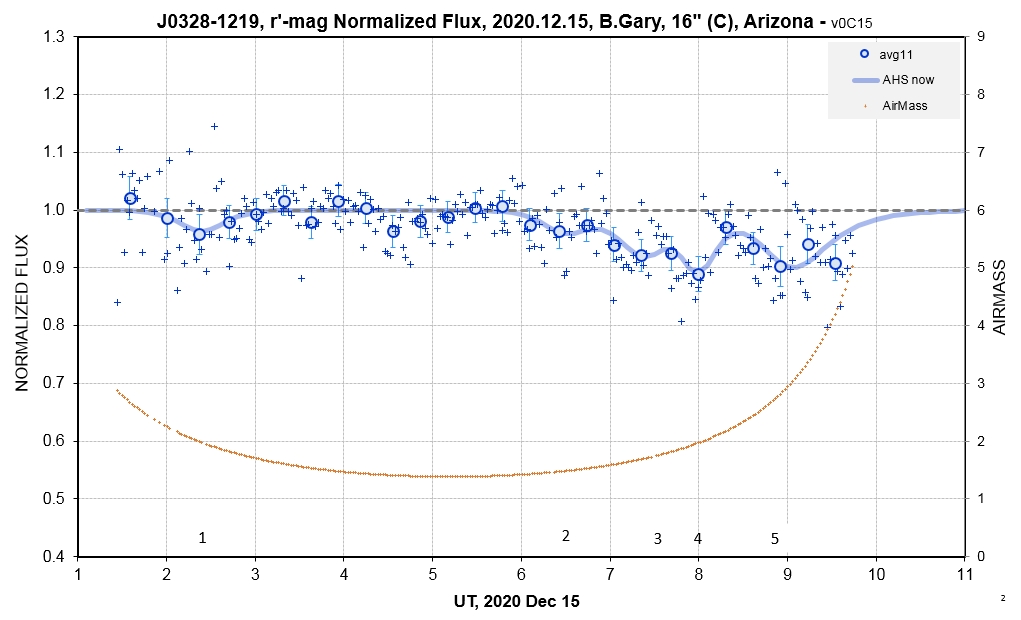
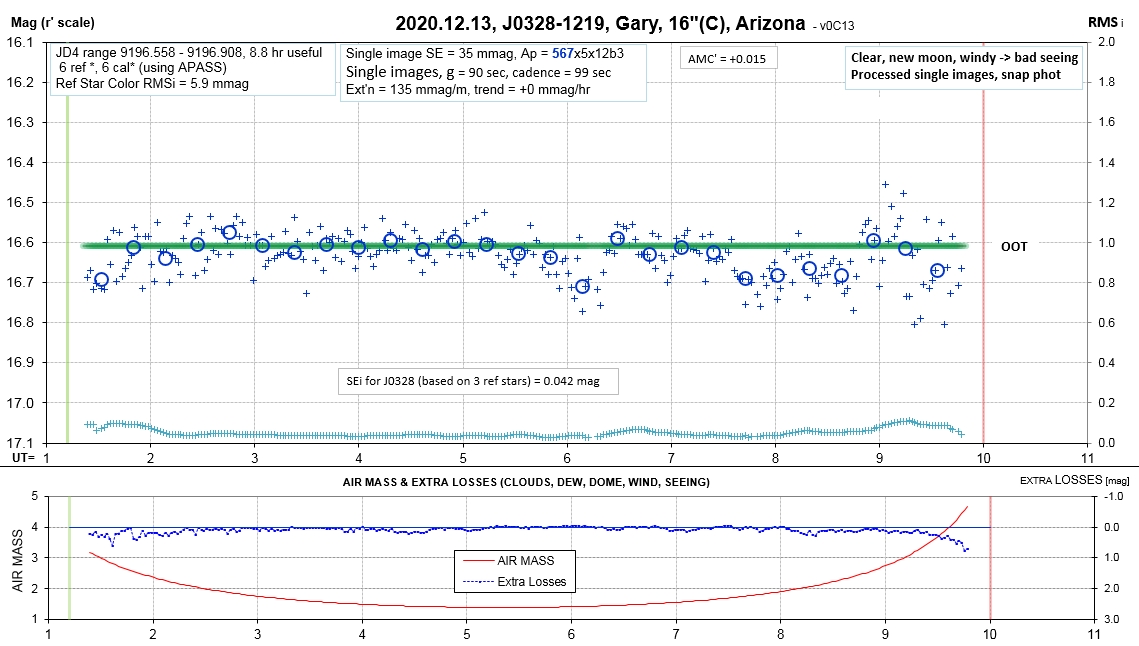
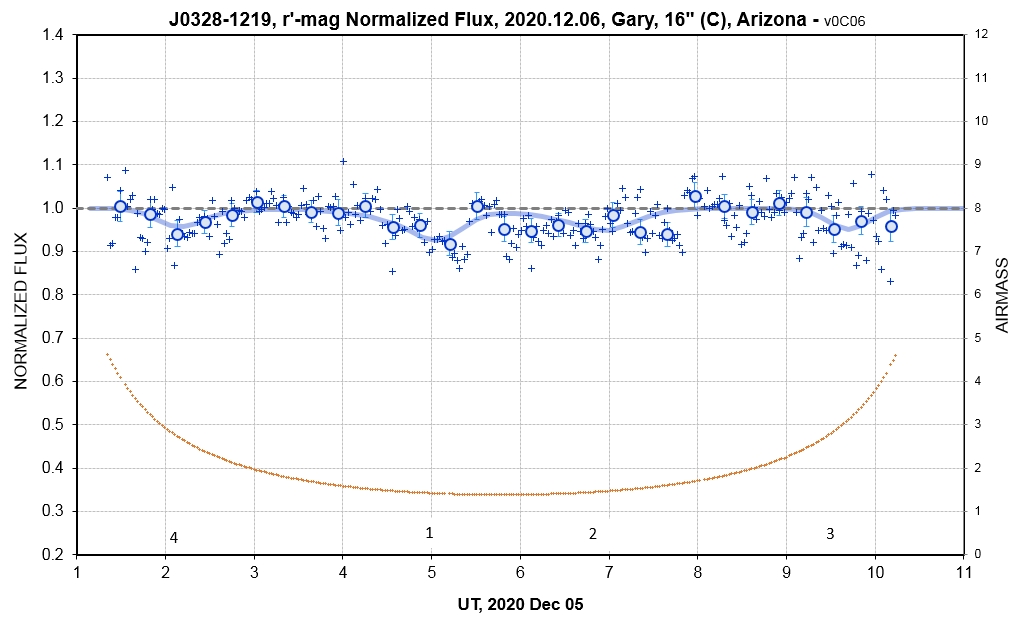
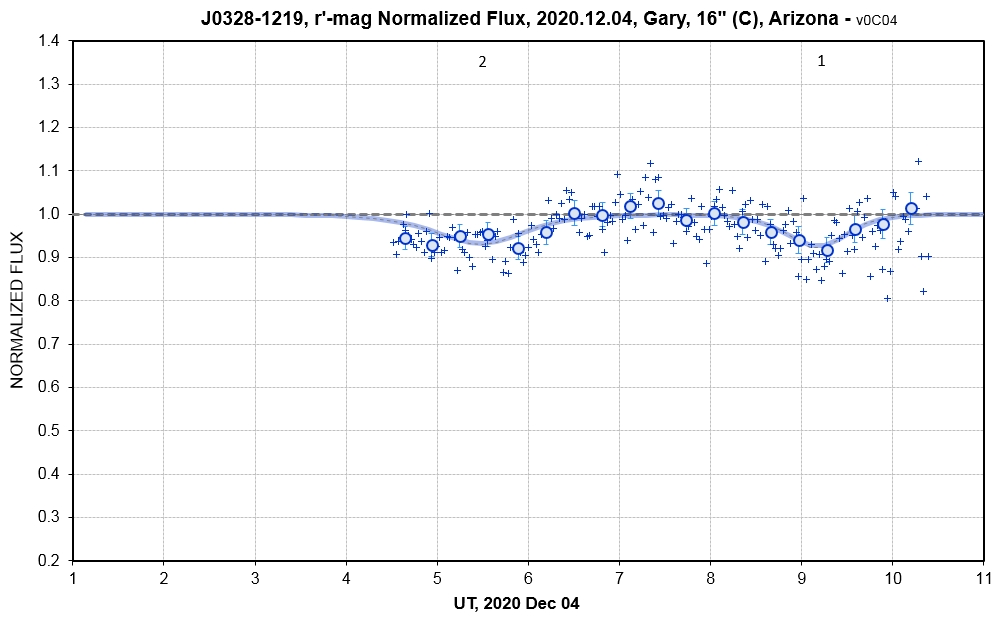
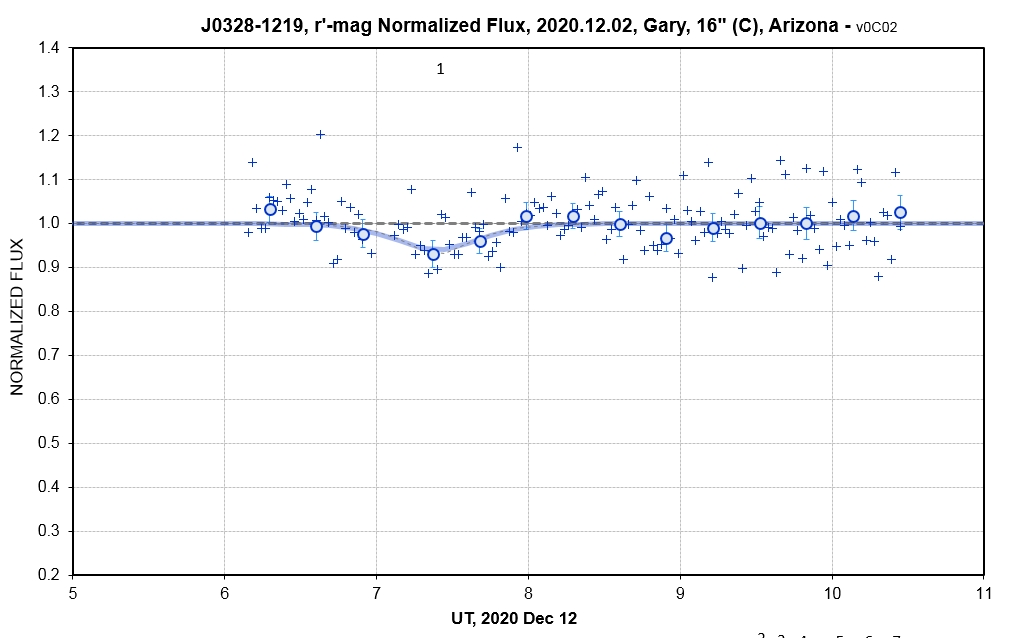
RA/DE = 03:28:33.5 -12:19:45, r'-mag ~ 16.6, white dwarf type DZ, T_eff = 8750 (170) K (Guidry et al., 2020). Observing season is centered on Nov 18 (Aug 01 to Mar 05).

List of Internal Links

    Observing session dates 
    Observing session LCs
    Finder image
    Periodicity  
    Why J0328 is important  
    Collision model for WD1145 (and J0328) production of dust clouds 
    My collaboration policy  
    References
    External links  

Observing Session Dates

Data Exchange File for all data: link

2021.02.12  
2021.02.09  
2021.02.07  
2021.02.06  
2021.02.05  
2021.02.01  
2021.01.31  
2021.01.27  

2021.01.18  
2021.01.17  
2021.01.16  
2021.01.15  
2021.01.14   
2021.01.13  
2021.01.12 

2020.12.17  
2020.12.16  
2020.12.15  
2020.12.13  
2020.12.12  
2020.12.07  
2020.12.06  
2020.12.05  
2020.12.04  
2020.12.03 
2020.12.02 

Observing Session Light Curves


2021.02.12  


2021.02.09  


I had to reboot at 2.9 UT.

2021.02.07  


2021.02.06  


2021.02.05  


2021.02.01  


2021.01.31  


2021.01.27  


2021.01.18  


Note: Differences at the same phase between dates will exist if a B-system of dips is present.


2021.01.17 


2021.01.16  


2021.01.15  


2021.01.14  


2021.01.13  


2021.01.12 


Pause in observations, waiting for a bright moon to get out of the way.

2020.12.17  


2020.12.16  


2020.12.15 


2020.12.13  


2020.12.12  

Clouds ended the observing session early.


2020.12.07  


2020.12.06  


2020.12.05  


The model AHS trace is based on fitting data from all 4 observing sessions to date (cf. Fig. 1).


2020.12.04  


2020.12.03 

Windy after 5 UT.


2020.12.02 


Finder Image


Finder image. FOV = 15 x 10 'arc.
North up, east left.

Periodicity   

Here's a periodogram of my December and January data using Peranso:


Figure P.01. ANOVA periodogram for HAO data, showing a region of significant periodicity (hour labels removed). .

Note: the x-axis labels have been removed as a courtesy to a group with whom I used to be affiliated since they are preparing a paper that will address periodicity. 

It would appear that J0328 brightness varies with a periodicity of 9.943 hours based on my HAO observations for December and January.
However, it is possible that components exist for P = 9.85, 9.94 and 9.05 hours. In other words, the three peaks in this periodogram suggest that there are three rings of dust cloud debris that transit.


More data is planned for this third group.


Figure P.02. Repeat of phase-folded LCs at top of this web page, showing change in phase locations of the 10 identifiable dips that appear in both observing intervals (early December and early January). 

Each dip can be assigned a period based on their phase location changes during a 35-day interval. This is shown in the next graph.


Figure P.03. Periods of the individual dips that existed during the HAO observations of December and January. (This is an early version, later superceded by a better analysis.)

If all dust clouds are in circular orbits, then we can determine the range of orbit radii for the above 10 dips.
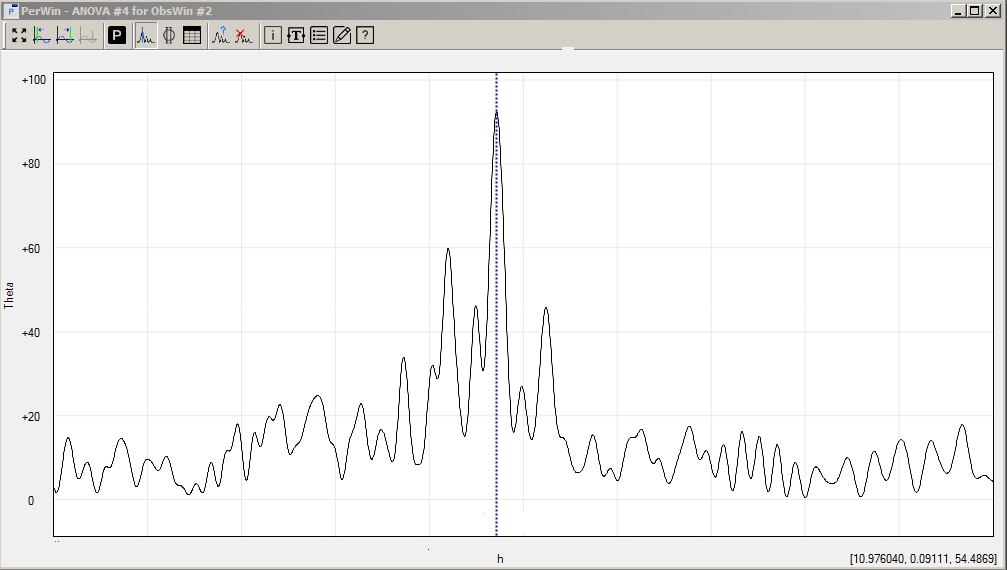
Starting here I will change my policy of hiding periodicity results. Why? Three reasons: 1) Anyone who is at least somewhat serious about astronomy will be able to determine J0328's periodicity by simply downloading my data exchange file for HAO data and processing it with a periodogram program, such as Peranso. 2) No one is viewing this web page anyway (just two viewings so far: someone from Austin and another from Ireland). 3) A paper in preparation by a group I used to be affiliated with is close to submission, and anyone else who theoretically could read this web page wouldn't be able to prepare and submit a competing paper before the aforementioned one.


Figure P.04. Waterfall plot of dip depths and phase locations for three epochs. The "drift lines" are just suggestions of dip associations (because we need at least 3 dips to align before having some certainty the the alignment is real). These drift lines an be used to predict the phases of future dips (if we have confidence in their reality).

Note that the above waterfall plot is "provisional" - meaning that we can't be confident in their reality until more epoch confirm the dip associations with a fitted drift line.
Another way to express this caution is to point out that since it is always possible to join two points with a straight line we should be wary of any drift line without at least three data points that are close to the line. This graph's main value at this time is for illustration of what to expect from an analysis of future observations.

The slopes of drift lines in a waterfall plot can be used to determine the period of each dip sequence. This is shown in the next graph.


Figure P.05. Periods of 12 dips that were present during December and January. Height of bar indicates average depth of the dip along the drift line being considered.


Figure P.06. Orbital radii for the 12 dips in the previous graph. The radii assume a value for the WD's mass.

The range of orbital radii is < 2000 km. This is comparable to the size of a rubble-pile asteroid (in our solar system). In other words, if the asteroid is orbiting at the WD's tidal disruption radius (such that the asteroid's Hill sphere has shrunk to the asteroid's surface) debris on the asteroid's surface could simply drift away into its own orbit around the WD. This could produce a cloud of dust and clumps of material that would occasionally impact the asteroid and renew the process of kicking up new dust into the clumpy dust ring.

It's too early to be sure, but there does seem to be a relationship between dip depth and orbit size.


Figure P.07. Relationship between minimum density required to avoid disruption due to tidal forces vs. orbital period (as derived by Rappaport et al., 2013). The oval shows where the J0328 asteroid must be located if it is in a circular orbit that is at the WD's tidal disruption radius. 

A rubble-pile asteroid has a density profile that is approximately uniform throughout, and also low, so if the asteroid orbiting the J0328 WD is circular, and if the asteroid is being being tidally disrupted, it must have a density of ~ 1.7 [gm/cm^3].

Why J0328 is Important

Since comets and asteroids have densities within the range of 0.5 to 3.5 [gm/cm^3], we can expect that WDs have comets and asteroids in orbits that have shrunk to tidal radius orbits with periods ranging from 6 to 18 hours. Since it is also possible that pieces of planet core and mantle are present at tidal disruption orbits (e.g., WD1145), we should expect dust cloud transits to be present in orbits as short as 4 hours. This is shown in the next graph.


Figure P.08. Relationship between period and density of the secondary when it is at the WD's tidal radius (based on Rappaport et al., 2013).

It is reasonable to assume that comets and asteroids (and a few pieces of high density planet mantle or core) are orbiting with periods throughout the entire 4 to 18 hour period region. J0328 is in the middle of this region, so I will use it to derive an interesting statistic on the fraction of time, F, that dust clouds are active enough for their transits to be detectable.

The equation T = N * p* O * F states that the number of WDs that are known to exhibit dust cloud transits (T) is equal to the product of the number of WDs that have been studied (N), the fraction of WDs with polluted photospheres (p), the fraction of polluted WDs that are oriented favorably for our view of dust cloud transits (O) and the fraction of the time that dust cloud transits are detectable for WDs that are both polluted and oriented favorably (F).


These are estimates of the knowable parameters and a solution for F:


            N = 5000 (Kepler and TESS)

            T = 2 (WD1145 and J0328)

            p = 35 ± 10 % (fraction of polluted WDs)

            O = 1.2 ± 0.3 % (occurrence of "viewability" of transits for random inclination)


            F = 9.5 ± 7.2 % (fraction of time dust clouds produce detectable transits)


The meaning of F < 1 is that detectable dust cloud production can vary on timescales shorter than the settle times for elements in the WD photosphere that are used to characterize pollution. The first timescale is months to years while the second timescale is years to millennia. WD1145 has so far been “active” for 6 years, and J0328 has been active for 2 years.


The parameter O deserves more discussion. Imagine that WD1145 has dust clouds that are optically opaque bands with a thickness to WD radius ratio = R. The 4.5-hour period means that the orbit radius, a, to WD radius, Rwd, is a/Rwd = 92. We can account for the observed maximum depth of 60 % if R > 0.3 (and impact parameter m < 0.2), for example. For larger m we require larger R, so R = 0.3 is a minimum. The angle departure from edge-on for transits to exist is 0.81 deg (for R = 0.3). For larger R, such as 1.0 (i.e., width of cloud band = twice diameter of WD), the angle for transits = 1.25 deg. The occurrence probabilities for viewability of transits (for random inclinations), which is the parameter O, is 0.9 and 1.4 % for these two R values. This is why I have adopted an occurrence probability, O = 1.2 ± 0.3 %.


It's tempting to conclude that whereas polluted WDs have dust clouds that are continually active when viewed in terms of settling times but are only active 10 ± 8 % of the time on much shorter timescales. However, we don't know whether 100 % of WDs are polluted 35 % of the time, or 35 % of WDs are polluted 100 % of the time - or something in between. For the second extreme, where 35 % of WDs are polluted all the time we can say that F = 10 ± 8 %. For the other extreme case, when all WDs are polluted 35 % of the time, F = 3 ± 2 %.
 
The above analysis is indirect support for the following summary:
The probability of finding WDs that are variable due to dust cloud transits is 1 per 2500 ± 600, and that this incidence is dominated by the fact that WDs with tidally disrupting planetesimals (mostly comets and asteroids) are actively producing dust only 10 % of the time. Orbital periods may be found throughout the range 4 to 18 hours. The short period ones may be ~ 3 times more likely to be viewable than the long period ones due merely to orientation arguments.

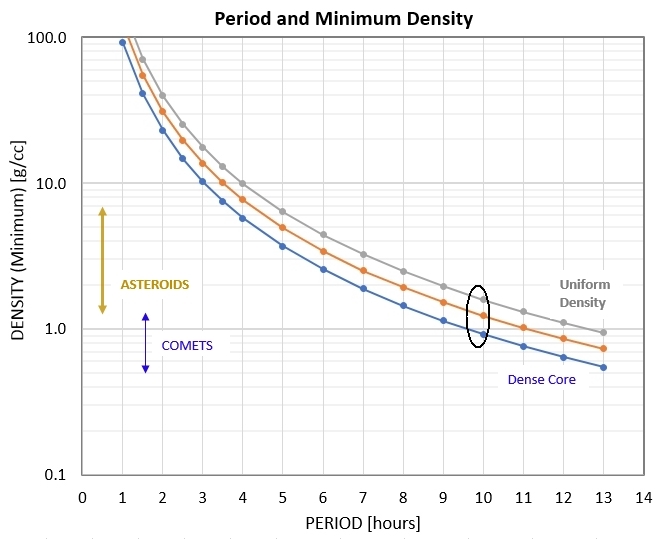
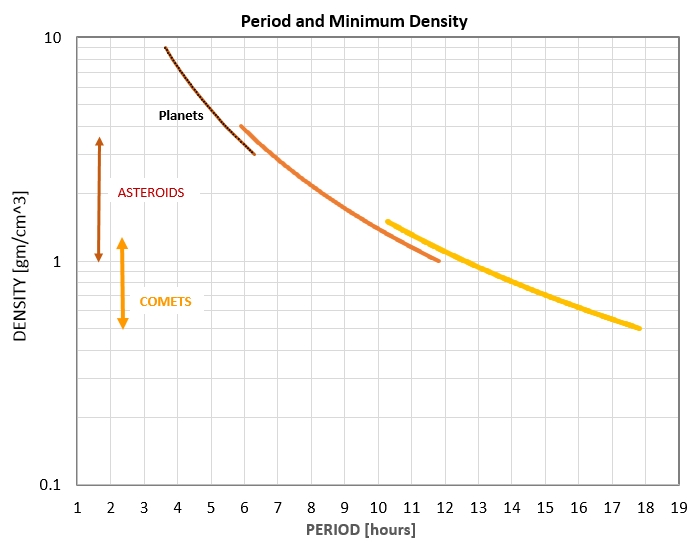
If the "1 per 2500" summary holds up with more observations we should consider the possibility that a substantial proportion of WDs are polluted due to comets in far out orbits, with periods in the 10 to 18 hours region. This could account for the small number of known WDs showing dust cloud transits because the long period systems are less likely to be oriented for the transits to be viewable (smaller O). J0328 may be more typical of polluted WDs than WD1145, so.we should not be surprised if most future discoveries of WDs with dust cloud transits are more like J0328 than WD1145.

To illustrate the existence of the variability of "dust production activity" here's a graph for WD1145 covering 7 years:


Figure P.09. WD1145 "activity level" for the past 7 years.

WD1145's dust production activity level has varied by a factor of 100 during the past 7 years. The dramatic rise that occurred during 2015 August was most likely caused by a major collision of asteroid fragments. Settling times for most elements in a WD photosphere are longer than the timescale for these variations. Hence, we should not expect to see the photospheric absorption line strengths undergo variations like those in the above graph. With many more years of observations it may be possible to estimate what fraction of the time WD1145 is so inactive that varibility can't be detected, permitting an evaluation of F (for WD1145). We may never be able to determine what fraction of the time dust cloud activity is so low, for elong enough to cause WD1145 to be unpolluted. This is because humanity's longevity is finite, and our demise is looming soon.


My Collaboration Policy

Please don't ask me to co-author a paper! At my age of 82 I'm entitled to have fun and avoid work. Observing and figuring things out is fun; writing papers is work. My observations are "in the public domain" and are available for use by anyone. If my data is essential to any publication just mention this in the Acknowledgement section.


References

Vanderbosch, Zachary P., Saul Rappaport, Joseph A. Guidry, Bruce L. Gary and 13 others, "Recurring Planetary Debris Transits and Circumstellar Gas around White Dwarf ZTF J0328-1219," MNRAS (approved), arXiv

Xu, Siyi, Samuel Lai and Erik Dennihy, 2020, "Infrared Excesses around Bright White Dwarfs from Gaia and unWISE I," arXiv 

Joseph A. Guidry, Zachary P. Vanderbosch, J. J. Hermes, Brad N. Barlow, Isaac D. Lopez, Thomas M. Boudreaux, Kyle A. Corcoran, Bart H. Dunlap, Keaton J. Bell, M. H. Montgomery, Tyler M. Heintz, D. E. Winget, Karen I. Winget, J. W. Kuehne, 2020, "I Spy Transits and Pulsations: Empirical Variability in White Dwarfs Using Gaia and the Zwicky Transient Facility," submitted to ApJ, arXiv

Rappaport, Saul, Roberto
Sanchis-Ojeda, Leslie A. Rogers, Alan Levine & Joshua Winn, 2013, "The Roche Limit for Close-Orbiting Planets: Minimum Density, Composition Constraints and Applications to the 4.2-Hour Planet KOI 1843.03," ApJ L, arXiv 


External Links of Possible Relevance

WD1145 summary of 4 observing seasons
WD1145 for 2020/21 observing season
Resume of webmaster

               ________________________________________________________________

This site opened:  2020.12.04.