J0328-1219 Photometry Observations, Season #3
by amateur Bruce L. Gary, using a 0.4-m (16") telescope at the Hereford Arizona Observatory (HAO)
and by Tom Kaye using a 1.1-m (44") telescope at Raemor Vista Observatory (RVO)
Last updated: 2023.08.28, 21 UT

The next observing season (2023/2024) web page is at http://www.brucegary.net/J0328-4/

This web page is meant to be an archive of my light curve observations for "observing season #3" (2022 August to 2023 February) of white dwarf J0328 using my HAO backyard observatory 16" Ritchey-Chretien AstroTech telescope with a SBIG XME-10 CCD (link). Occasional observations by Tom Kaye using a 44" telescope (link) will be included. Most of my web pages are meant for documenting observations and analysis results for myself (it's easier than using a filing cabinet). My web pages can sometimes serve to help with collaborations if I join with others to study the same star. This web page may serve these dual purposes since I'm aware of a group of astronomers (headed by Zachary Vanderbosch) that was engaged in the first and second observing seasons of observations following publication about the variable nature of J0328. My Web Site #2 is located at http://www.brucegary.net/J0328-2/; it includes my observations during the 2nd observing season (2021.11.10 to 2022.02.09).

General Information About J0328

RA/DE = 03:28:33.7 -12:19:45, g'-mag = 16.7, r'-mag = 16.6, white dwarf type = DZ, T_eff = 7630 ± 140 K (Vanderbosch et al., 2021), R_star = 1.167 ± 0.022 × R_earth =  0.0107 ± 0.0005 × R_sun, M_star = 0.731 ± 0.023 × M_sun.  Observing season is centered on Nov 18 (and extends from about Aug 01 to Mar 05).

List of Internal Links
    Waterfall Plots  
    Phase-Folded Light Curves for 1-week Intervals  
    Periodograms  
    Comparing Observatories (HAO & RVO)
    List of Observing Dates  
    Observing Date Graphs  
    Finder image  
    Physical model suggestion  
    References  
    Related external links  


Waterfall Plots


This is the beginning of a new interval of closely-spaced observations of J0328 (e.g., low moonlight observing conditions).

Based on the waterfall plot drift line slopes it is possible to derive the distribution of dust cloud periods for each month of data. When this is done for the A-system we get the following:


There seems to be a trend toward longer periods versus date. In other words, a "disturbance" (such as a collision) that started at one orbit radius is causing disturbances at outer orbit radii locations. If a collision caused a fragment to have a higher orbital speed it could collide with fragments in outer orbits.


Waterfall plot for last 5 weeks using the A-system period. Dips associated with periods ~ 11.268 hrs are surely present, according to a periodogram analysis (below), but they will appear at seemingly random locations in this plot. The range of periods is 0.3 % (range of orbit radii is 0.2 %), which is similar to WD1145.


Waterfall plot for last 5 weeks using the B-system period. Dips associated with periods ~ 9.931 hrs are surely present, according to a periodogram analysis (below), but they will appear at seemingly random locations in this plot.  The range of periods is 0.6 % (range of orbit radii is 0.4 %).


Waterfall plot for last month using the B-system period. Dips associated with period ~ 9.931 hrs are surely present and would be found at random locations.


Waterfall plot for the first two months of this observing season. Most of these dashed-line associations are statistically uncertain. As usual, we need more data. Keep in mind that dips with P = 11.2 hrs will appear at "random" locations on this waterfall plot (or associated with slopes very steeply slanted to the right).

Phased-Folded Light Curves for (Week Timescale) Date Groups


Only 3 nights before clouds came.


Periodogram Analyses

For the 3-week interval 2022.11.11 to 2022.12.01 the B-system periodicity (11.268 hrs) is most significant in a periodogram: The diminished A-system periodicity (9.93 hrs) may be due to dip structure changing faster than for the B-system during this 3-week interval. What's with the other 3 periodicities?


For the set of data (Nov 11 to Dec 01), the periodogram shows a most significant peak at 11.268 hours (0.46948 day), which means the B-system is strong and stable during the 7-week data interval.


Two dips per orbit are present, each ~ 10 % deep, for the B-system periodicity (11.268 hrs).

For comparison, here's wjhat my phase-fild LC using the same period yields:


To follow-up on the periodoram's 4.511-hr periodicity, here's the phase-folded LC:


and here's another version of the same phase-fold:


Could this be the stellar rotation period, with starspots causing the brightness variations?

The closest periodogram peak to the A-system P ~ 9.93 hrs is the one at P = 10.02 hrs:


and here's my phase-fold for a nearby P = 9.934 hrs:


I don't know why the periodogram didn't show something closer to what is obviously periodic near P = 9.934 hrs.
    _____________________________________________________________________________________________________________________________


For the 3-week interval from 2022.10.17 to 2022.11.06, the A- and B-system periodicities are present in a periodogram:


For the set of data (Oct 17 to Nov 06), the periodogram shows peaks at 9.959 and 11.320 hrs (0.41494 and 0.4717 day).


Phase-fold LC for the latest set of data (Oct 17 to Nov 06) using P = 9.959 hrs.At least 3 dips are present, the deepest being ~ 6 %..


Phase-fold LC for the latest set of data (Oct 17 to Nov 06) using P = 11.32 hrs. At least 2 dips are present, each ~ 5 % deep.


Comparing Observatories HAO (0.4-m) and RVO (1.1-m)

Starting 2022.11.24 Tom Kaye's 1.1-m RVO telescope began observations of this star in coordination with my 0.4-m HAO observations. Our observatories are ~ 10 miles apart, so we share the same weather and we have similar "atmospheric seeing." The photon flux incident on the CCD cameras has a ratio of 7.56 (assuming similar optical reflection and transmission properties)..The corresponding SNR ratio is 2.75 (same as aperture ratio = 1.1/0.4). Therefore, we expect to see RMS scatter about a true model fit that is 2.75 times greater for HAO than RVO.

The main goal for comparing HAO with RVO is to assess the presence of systematic errors that could produce false dip structure. A secondary goal is to verify that the RMS scatter is approximately what is expected (2.75 times greater for HAO). To facilitate the first goal (looking for false dip structure caused by systematic errors in either telescope system) I have used a 3-point running average of the HAO data plotted with the RVO LC data. Superimposed on these two data plots is a model fitted to the combined data. The model employs a set of asymmetric hypersecant functions that were specified by a subjective "hand fitting."

The following four LCs illustrate that HAO and RVO are in very good agreement on dip structure. The comparisons also show that the expected SNR ratio of 2.75 is also achieved. We conclude that both telescope systems can be depended upon for producing credible LCs of dip structure having timescales of minutes to hours. For dips lasting the typical 10 minutes RVO can achieve ~ 0.8 % accuracy for J0328 dip depths and HAO can achieve ~ 2.5 % accuracy. WD1145 is ~ 0.6 magnitudes fainter (flux ratio = 0.6), so RVO and HAO should be capable of measuring WD1145 dip depths with accuracies of ~ 1.4 and 4.3 %. These accuracies are for low moonlight conditions, mild wind and average to good atmospheric seeing.


Observing Session Dates


2023.02.10  

2023.01.18  
2023.01.09  

2022.12.31  
2022.12.26  
2022.12.24  
2022.12.22  
2022.12.20  
2022.12.17  
2022.12.15  

2022.12.01   Data for Nov 11 to Dec 01 (BJD-2450000, NF & SE): link
2022.11.30  
2022.11.29  
2022.11.28  
2022.11.27  
2022.11.26  
2022.11.25  
2022.11.24  

2022.11.21  
2022.11.20  
2022.11.19  
2022.11.17  
2022.11.16  
2022.11.14  
2022.11.13  
2022.11.12  
2022.11.11  

2022.11.06  
2022.11.05  

2022.11.01   Data for Oct 17 to Nov 01 (BJD-2450000 & NF): link
2022.10.30  
2022.10.29  
2022.10.28  
2022.10.27  
2022.10.26  
2022.10.25  

2022.10.21  
2022.10.20  
2022.10.19  
2022.10.18  
2022.10.17  

2022.09.27   Data for Aug 29 to Sep 27 (BJD-2450000 & NF): link
2022.09.26  
2022.09.25  
2022.09.22  

2022.09.18  
2022.09.17  
2022.09.16  
2022.09.15  

2022.09.07  
2022.09.06  
2022.09.05  

2022.09.01  
2022.08.31  
2022.08.30  
2022.08.29  

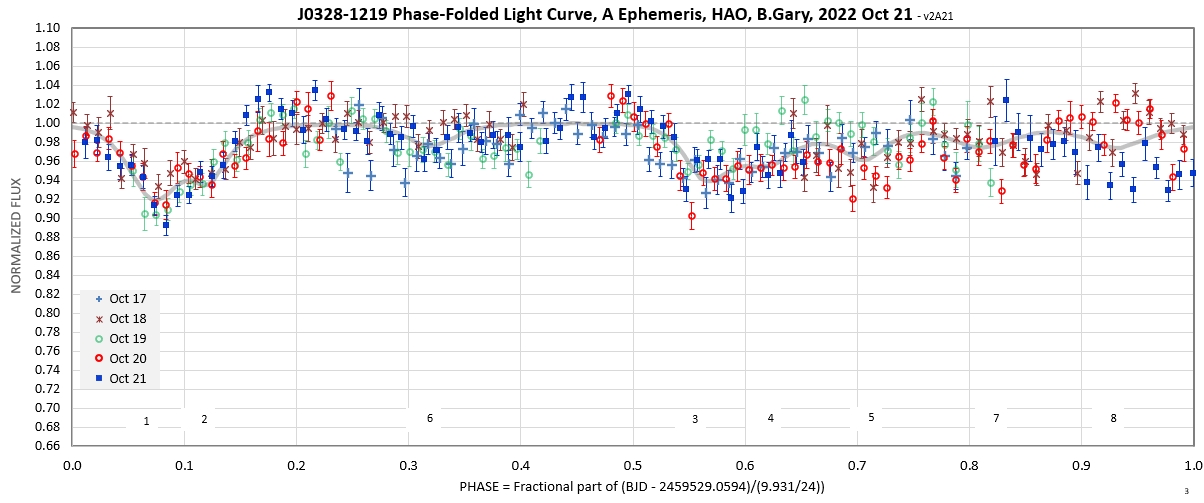
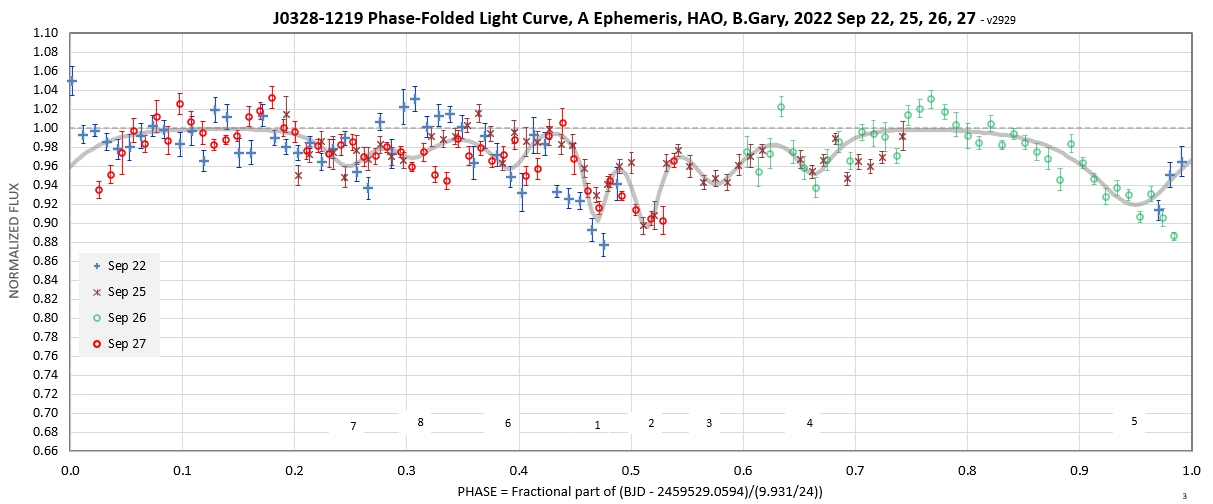
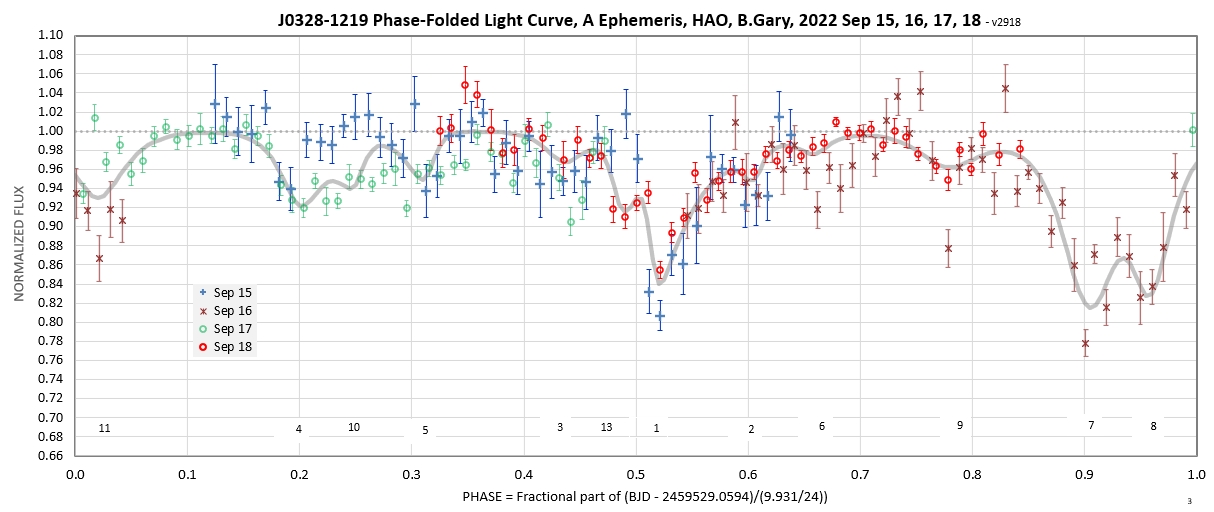
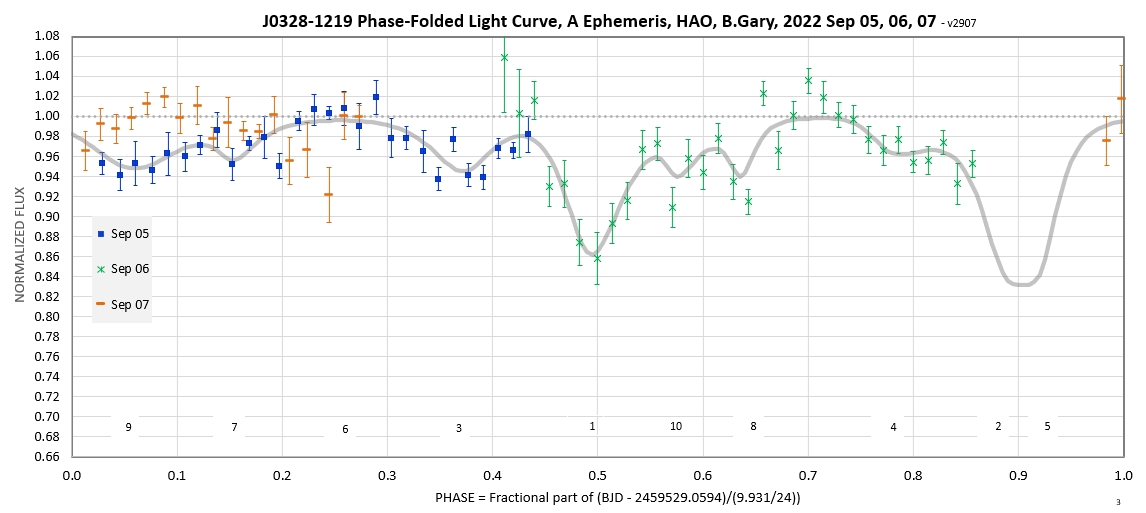
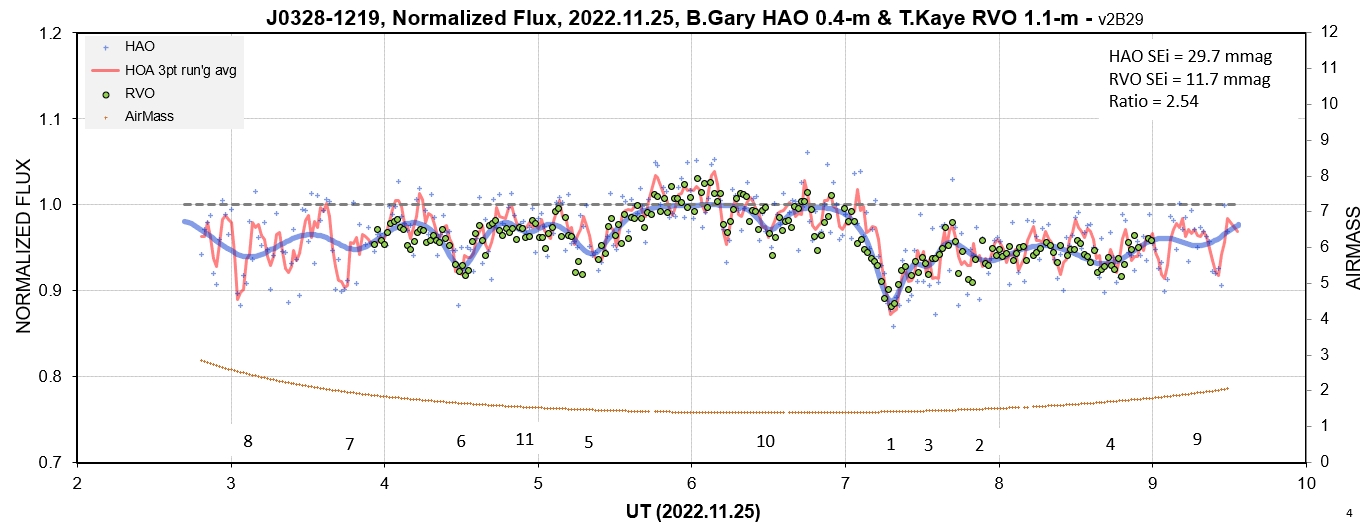
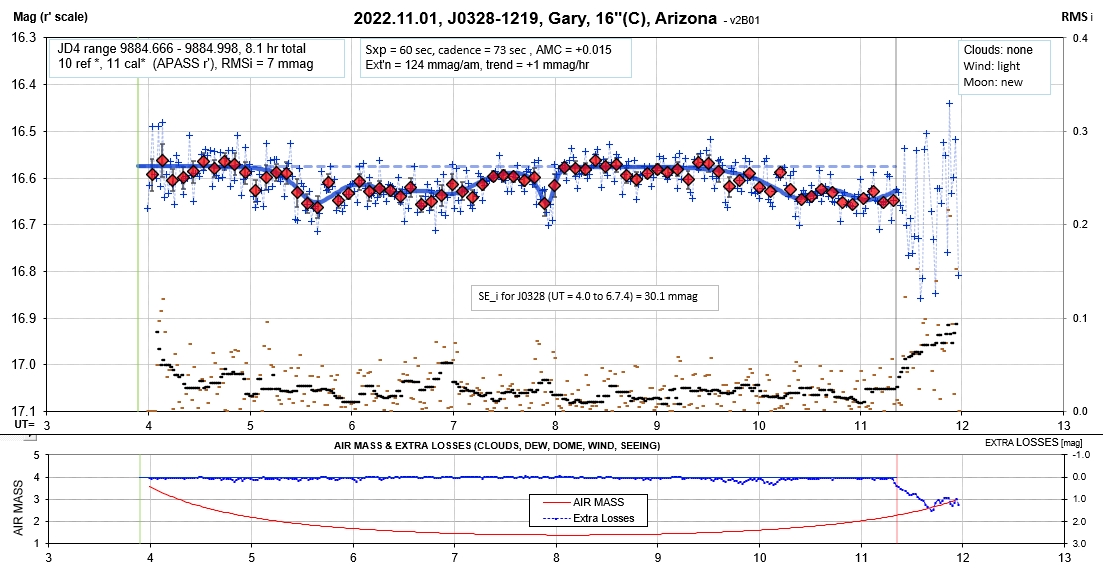
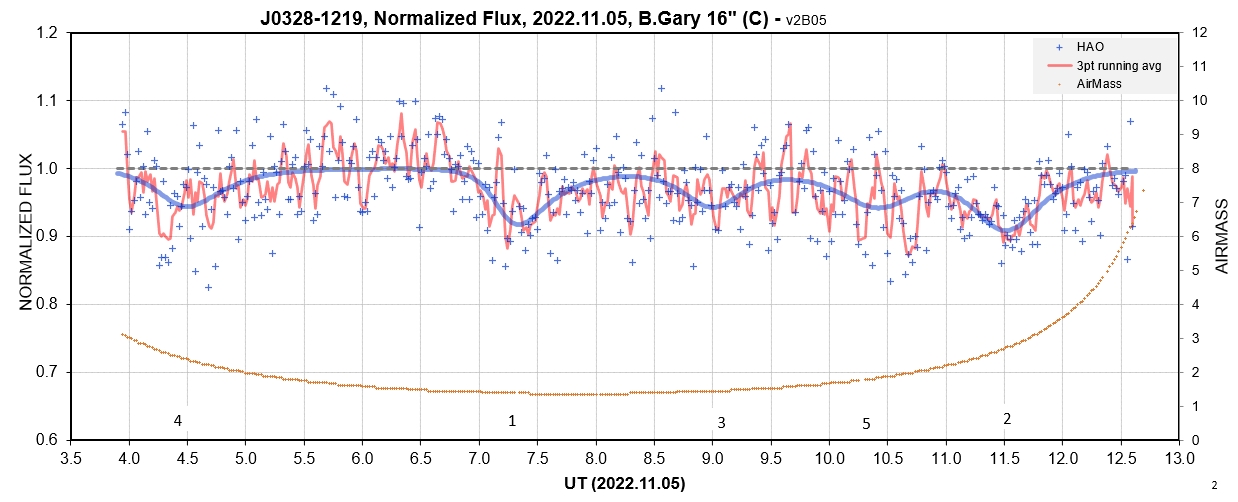
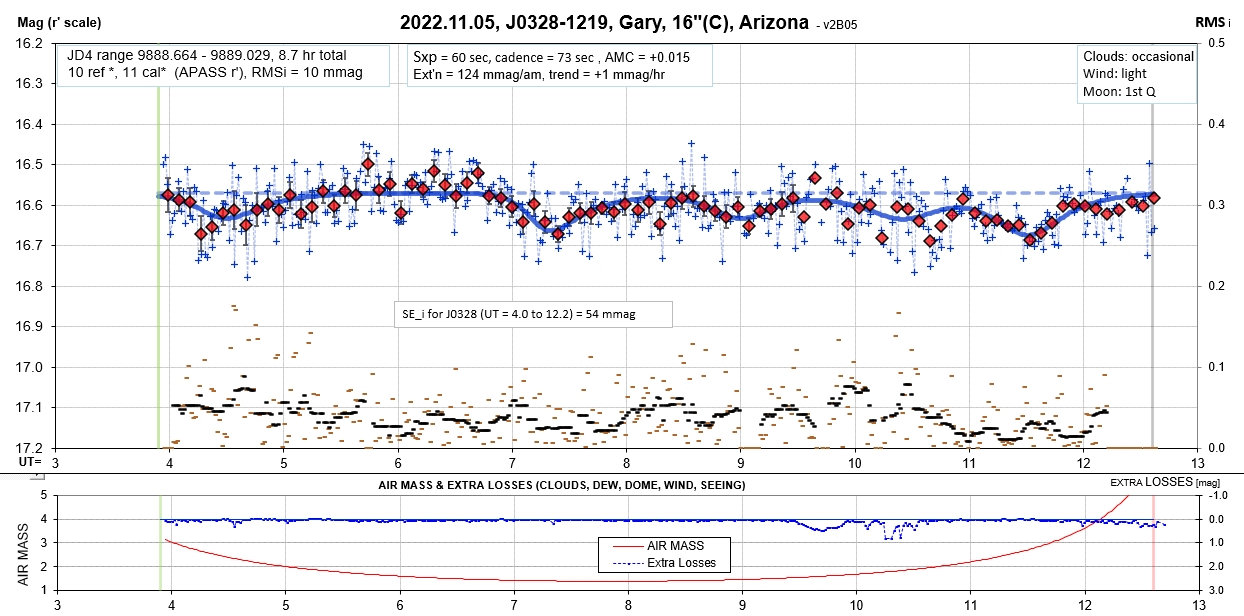
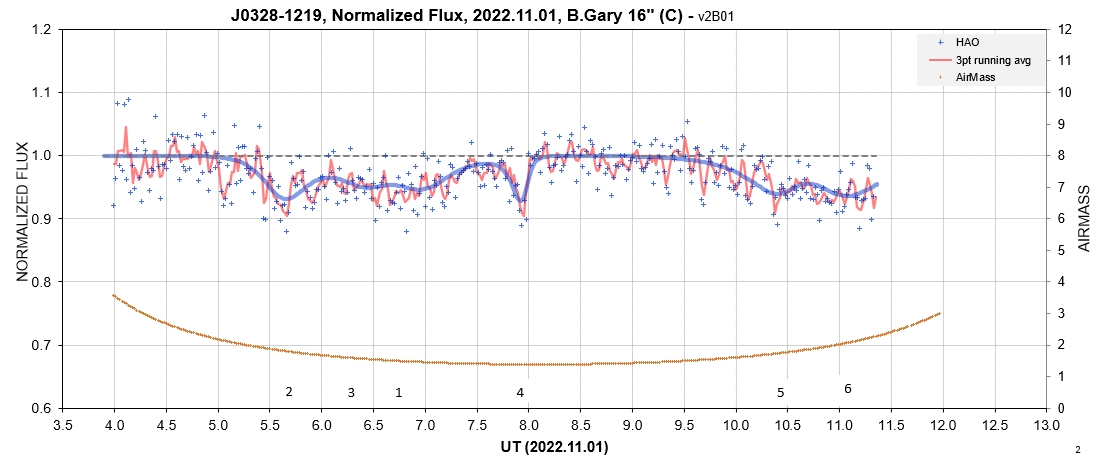
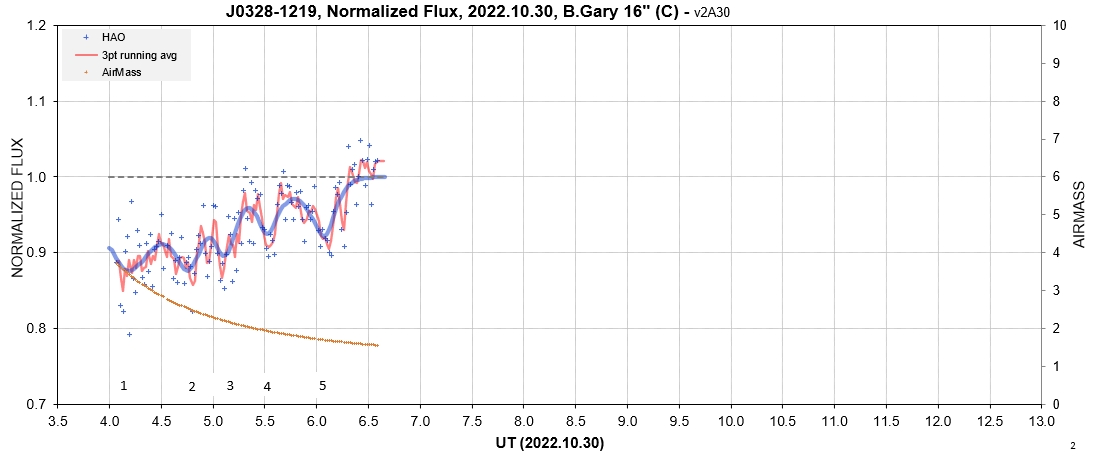
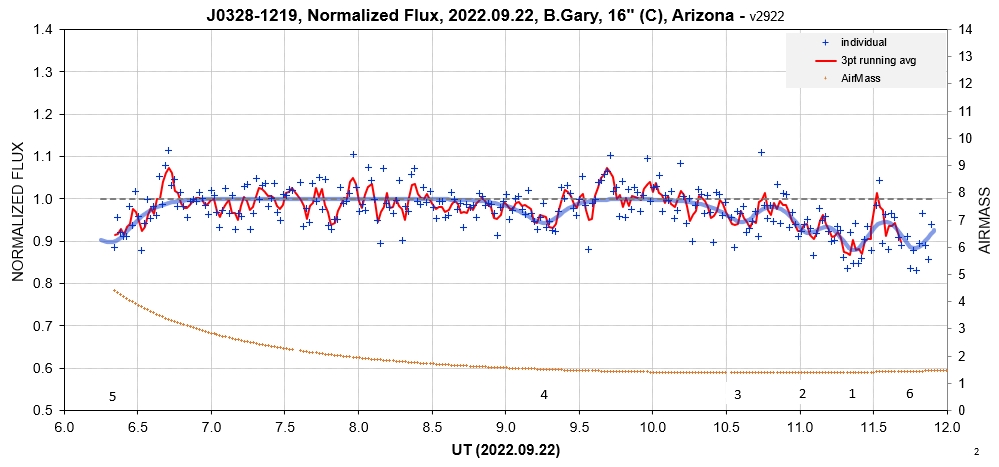
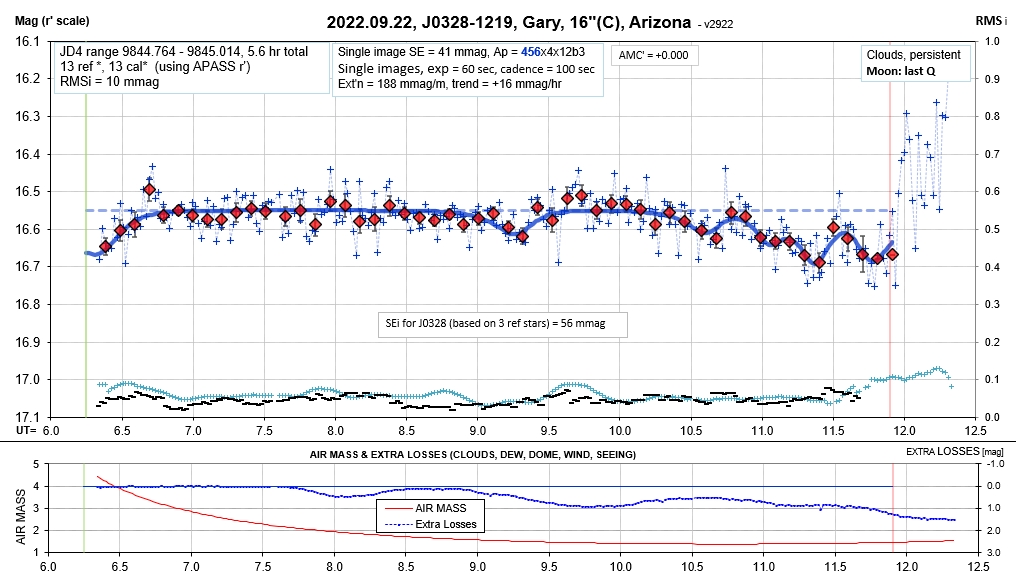
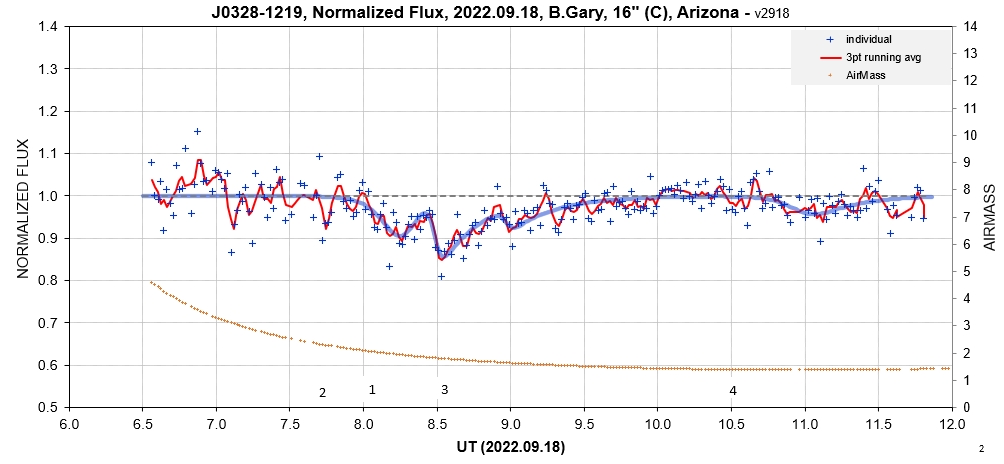
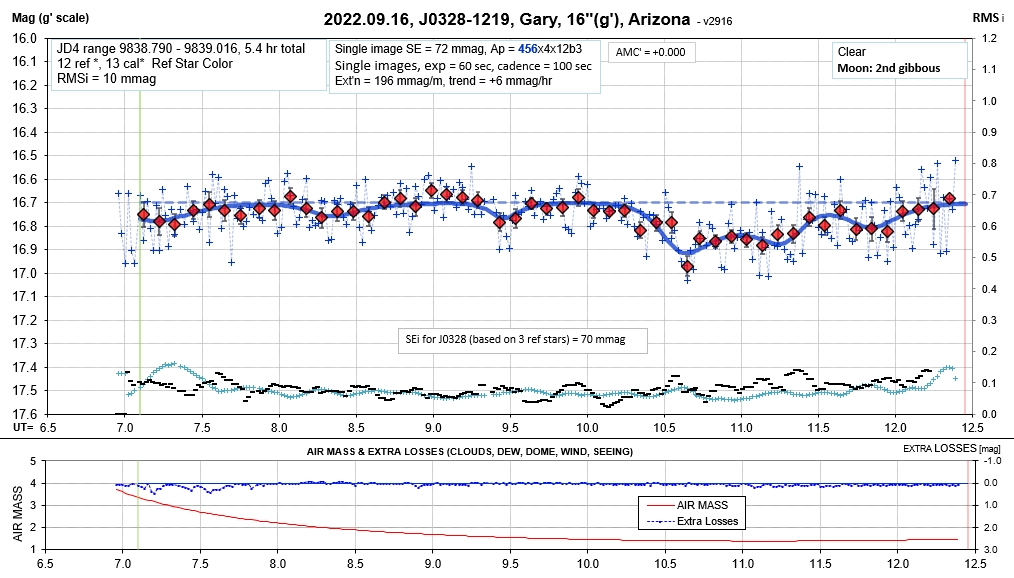
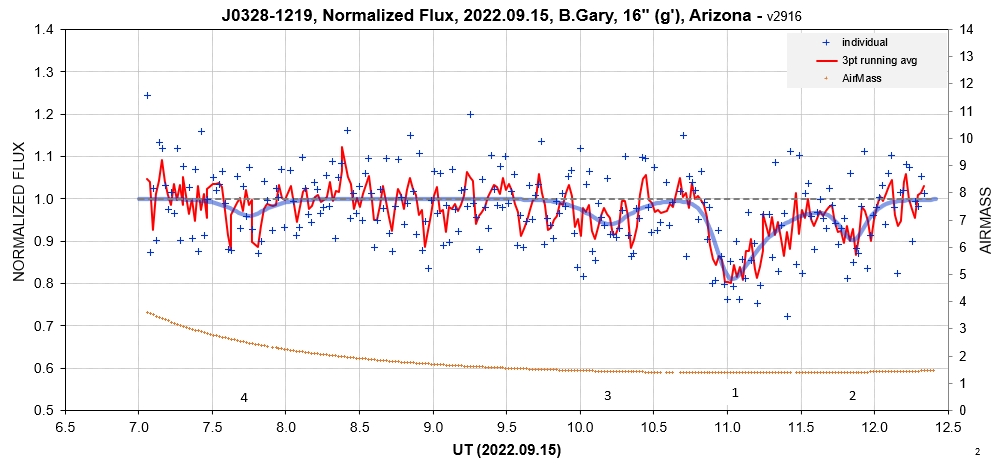
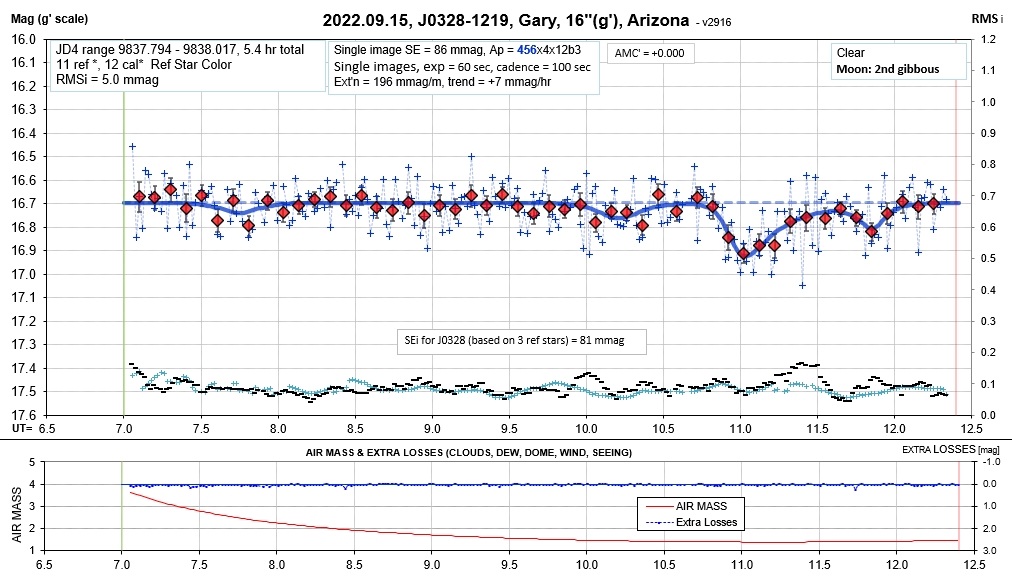
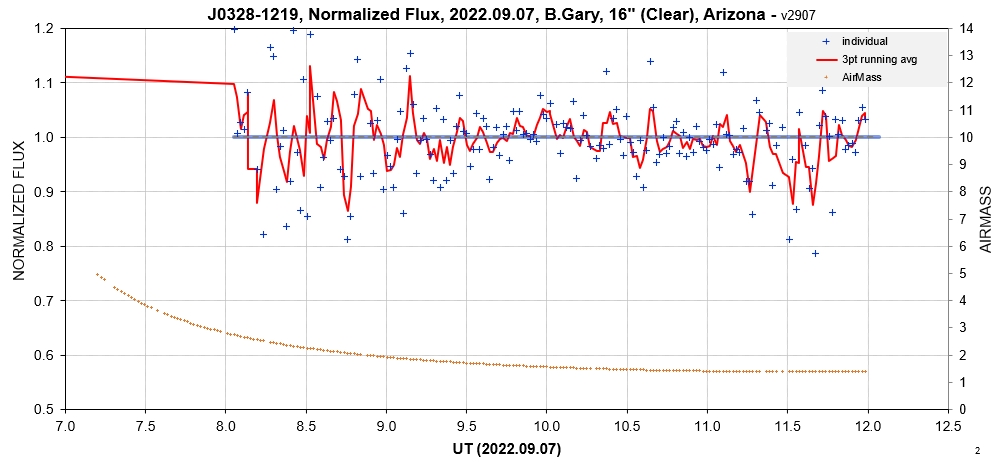
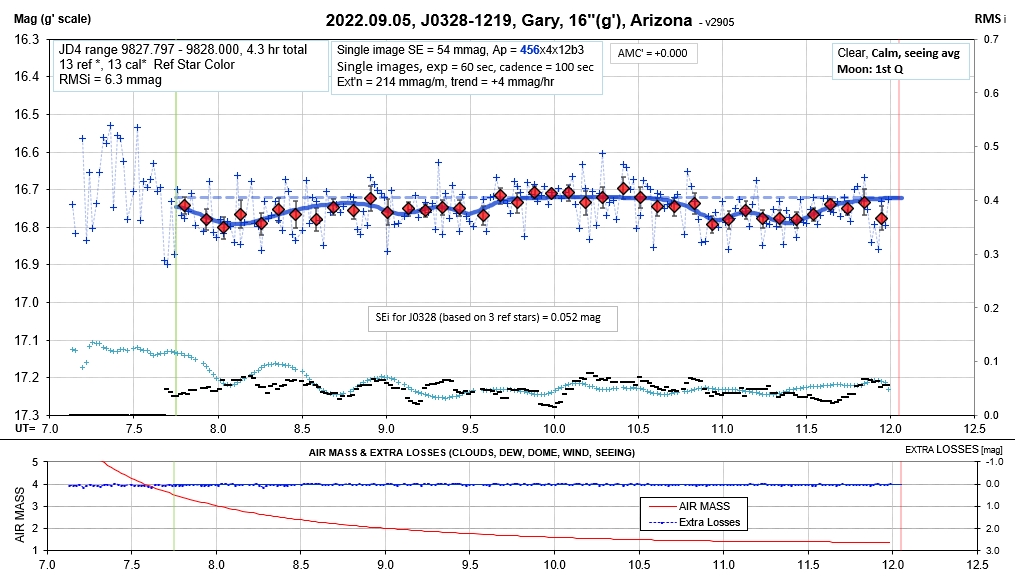
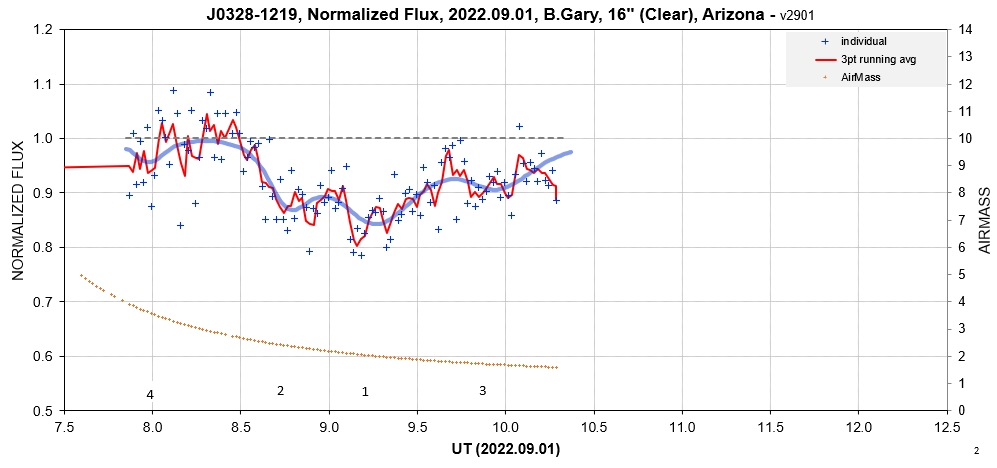
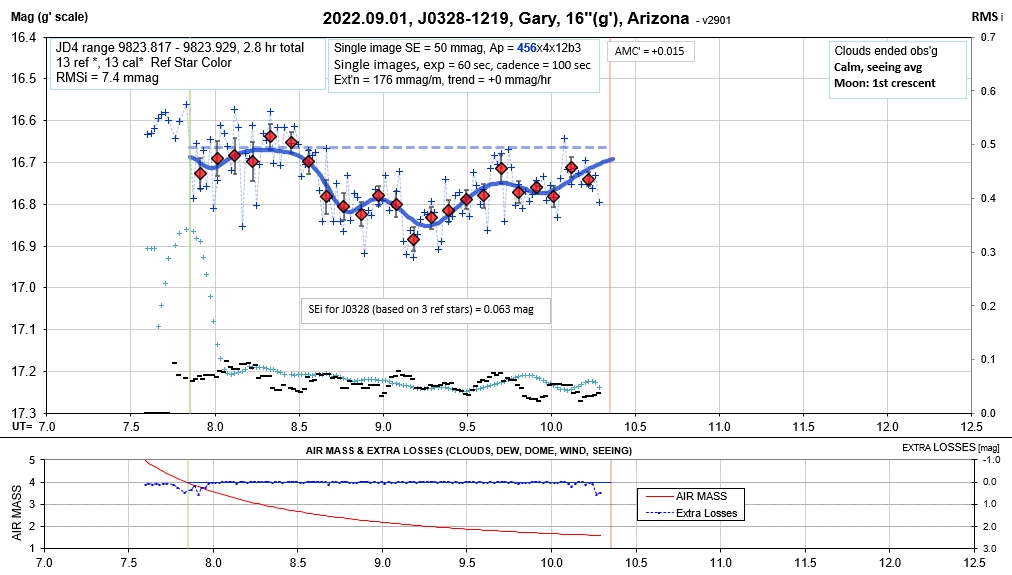
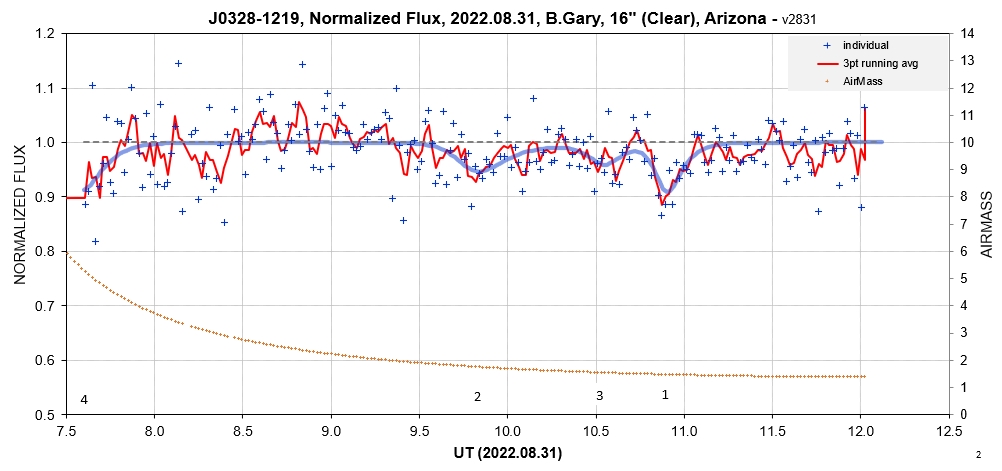
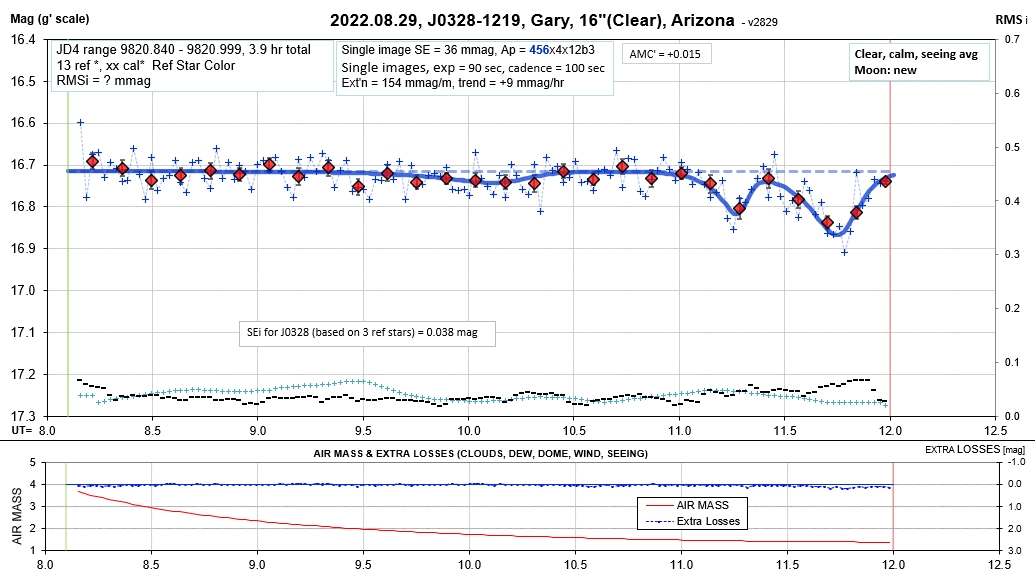
Observing Session Light Curves
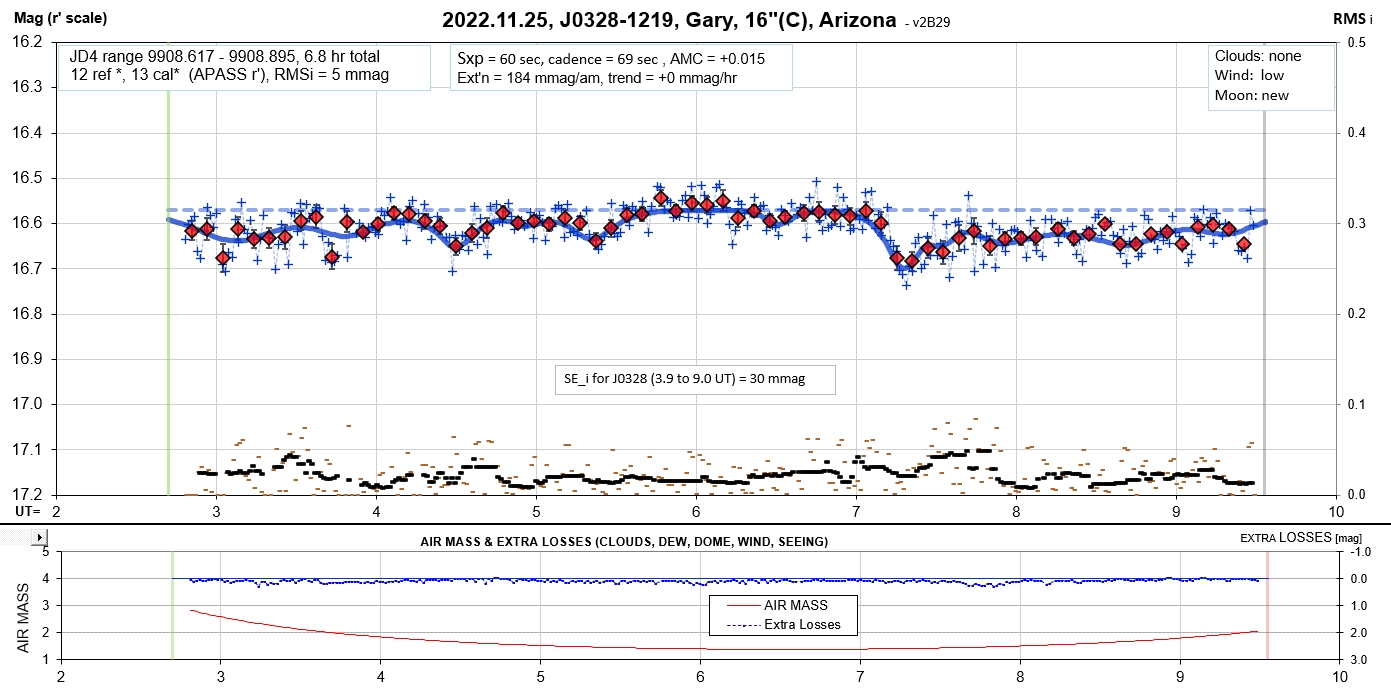
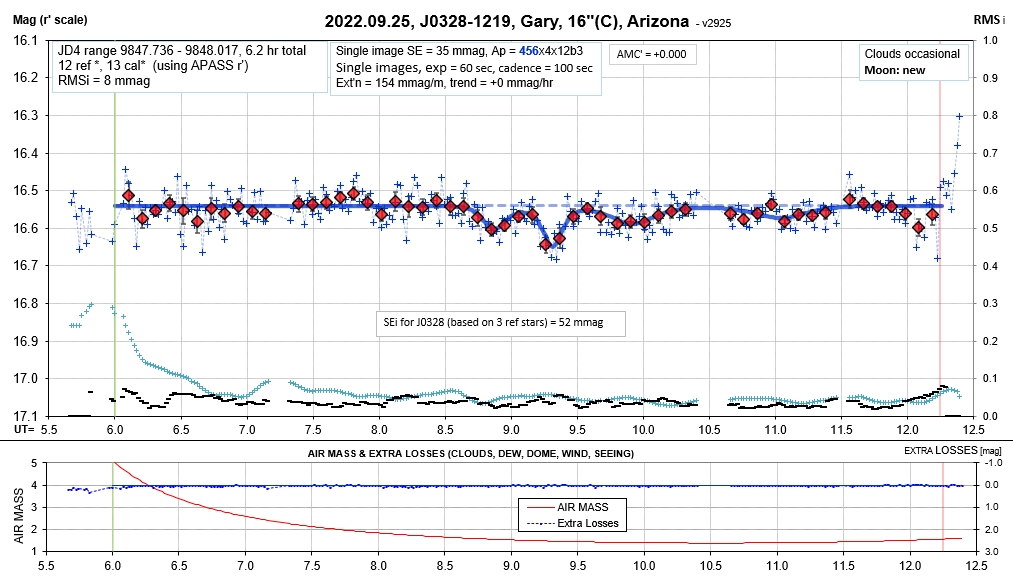
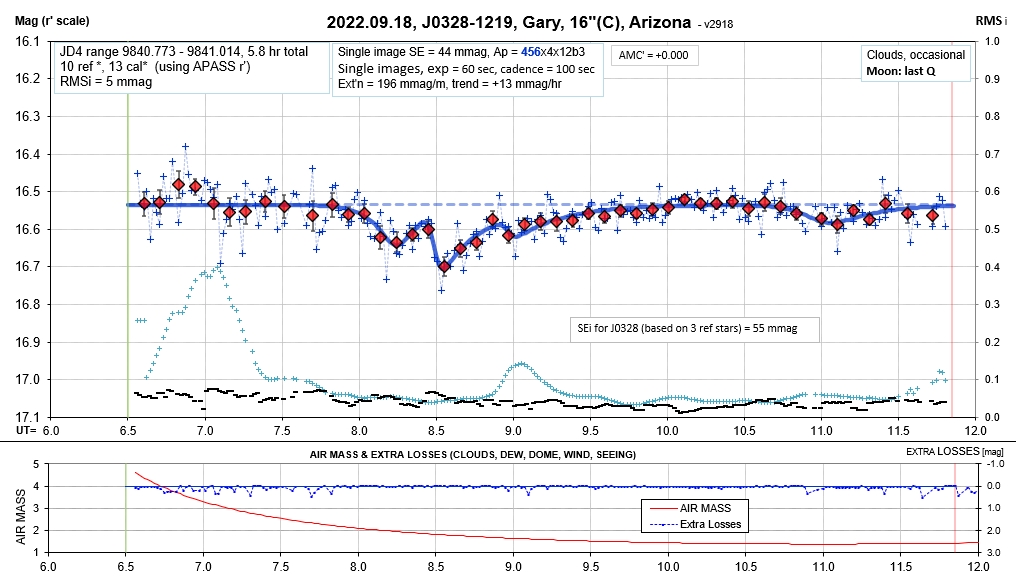


2023.02.10  


2023.01.18  


2023.01.09  


Bright moon nearby, so SNR suffered.

2022.12.31  


2022.12.26  


2022.12.24  


2022.12.22  


2022.12.20  


2022.12.17  


2022.12.15  


The dips at 7.7 & 8.7 UT are long-lived, as the next graph shows.


2022.12.01  


2022.11.30  


2022.11.29  


2022.11.28  


2022.11.27  


2022.11.26  


2022.11.25  

The same AHS model is shown in the next 4 LCs. It's a fit to the combined HAO/RVO data.


2022.11.24  

The same AHS model is shown in the next 4 LCs. It's a fit to the combined HAO/RVO data.


2022.11.21  


2022.11.20  

Had to abort early due to wind.


2022.11.19  


2022.11.17  


Wind forced at abort at 7 UT.

2022.11.16  


2022.11.14  


2022.11.13  

The moon is fading and moving away, so precision of measurements is improving.


2022.11.12  


2022.11.11  


We only have T.Kaye's RVO (1.1-m) data for this night. Full moon makes observations noisy. For this date the RVO data is 3 times noisier than for the previous RVO observing session (2022.10.26), when SE per 60-second exposure measurement was 0.95 %.

2022.11.06  


2022.11.05 


2022.11.01  


2022.10.30  


2022.10.29  


2022.10.28  


2022.10.27 


2022.10.26  


T.Kaye's 1.1-m telescope has SNR that is 3.2 times better than B.Gary's 0.4-m. The two LCs exhibit amazingly similar structure.

2022.10.25  


Including Tom Kaye's LC data, using a 44" telescope, supports all aspects of HAO data and provides twice as good SNR.


OOT level uncertain.


2022.10.21 


This is Tom Kaye's 1st LC for this observing season (involving new hardware, not yet used to full advantage). It supports the HAO observation in showing that the main fade event consists of two components.


2022.10.20  


2022.10.19  


2022.10.18 


2022.10.17  


2022.09.27 


2022.09.26 


2022.09.25  


2022.09.22  


2022.09.18 


2022.09.17   Obs'd without filter, which I'll do from now on.


2022.09.16  


2022.09.15  


2022.09.07 

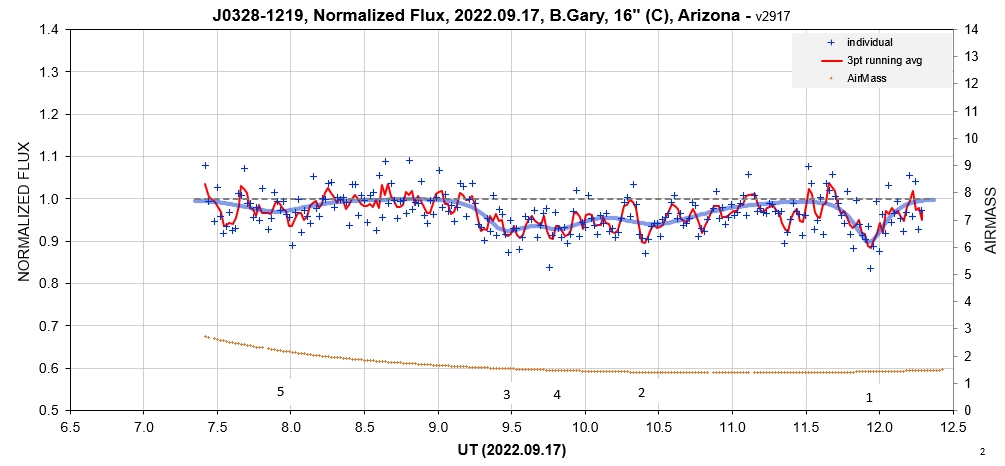
Too many clouds (only 2 hrs without).


2022.09.06  


2022.09.05 


2022.09.01 


2022.08.31 


2022.08.30 


2022.08.29 


Finder Image


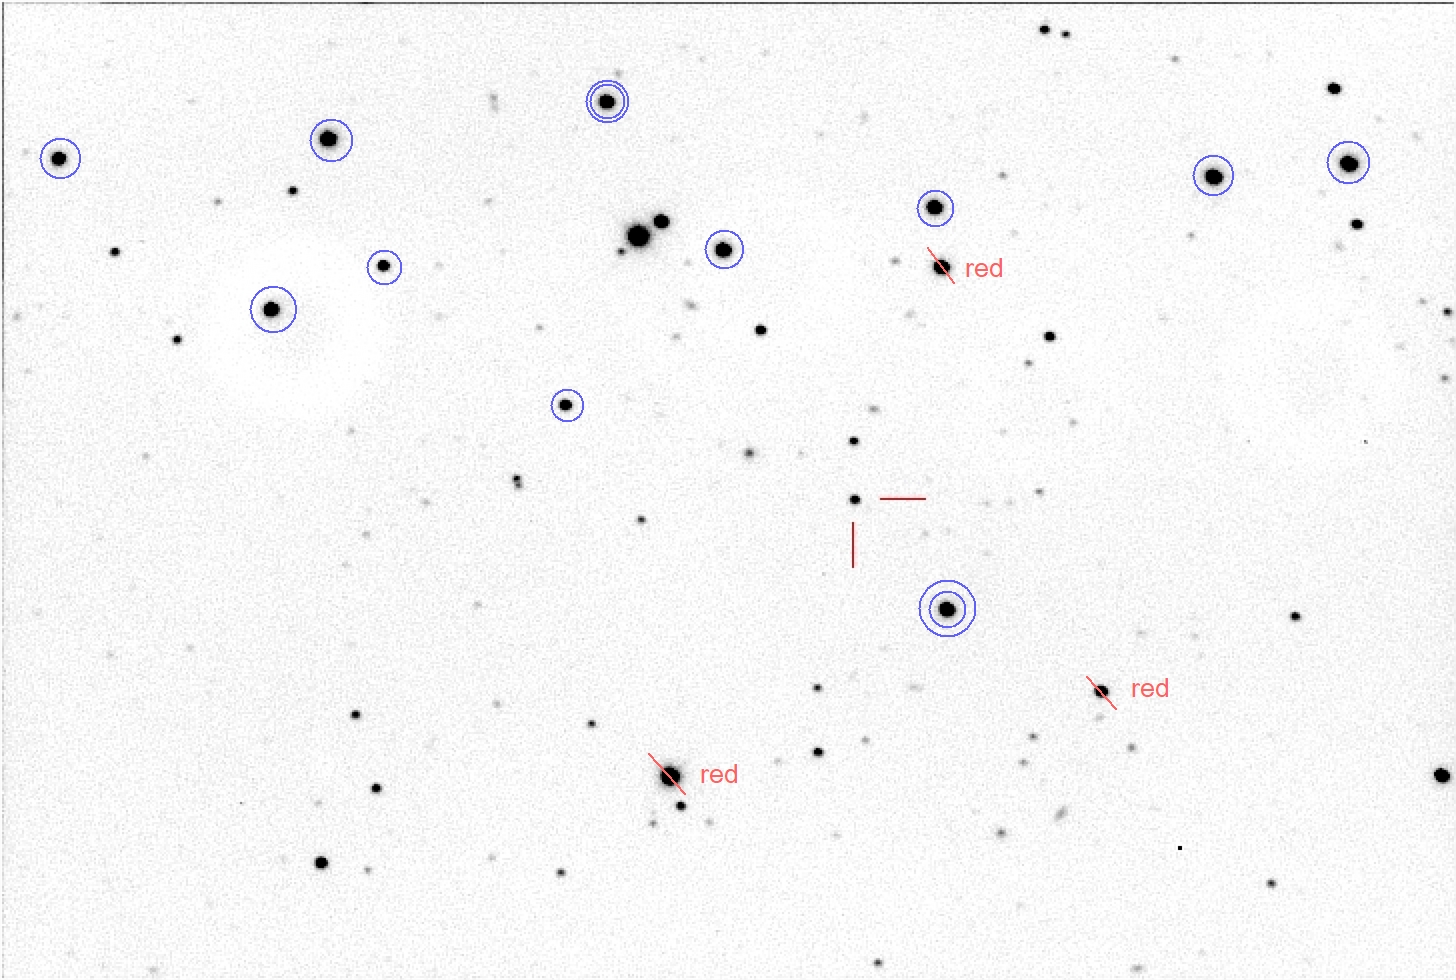
Finder image. FOV = 15 x 10 'arc.
North up, east left. The best stars to use for reference are the clue-circled ones; I avoid use of the 3 red stars.

Since J0328 is a blue star it is important to use only blue stars for reference. Any use of red stars would produce an unwanted amount of "airmass curvature" in the light curve.

Physical Model Suggestion

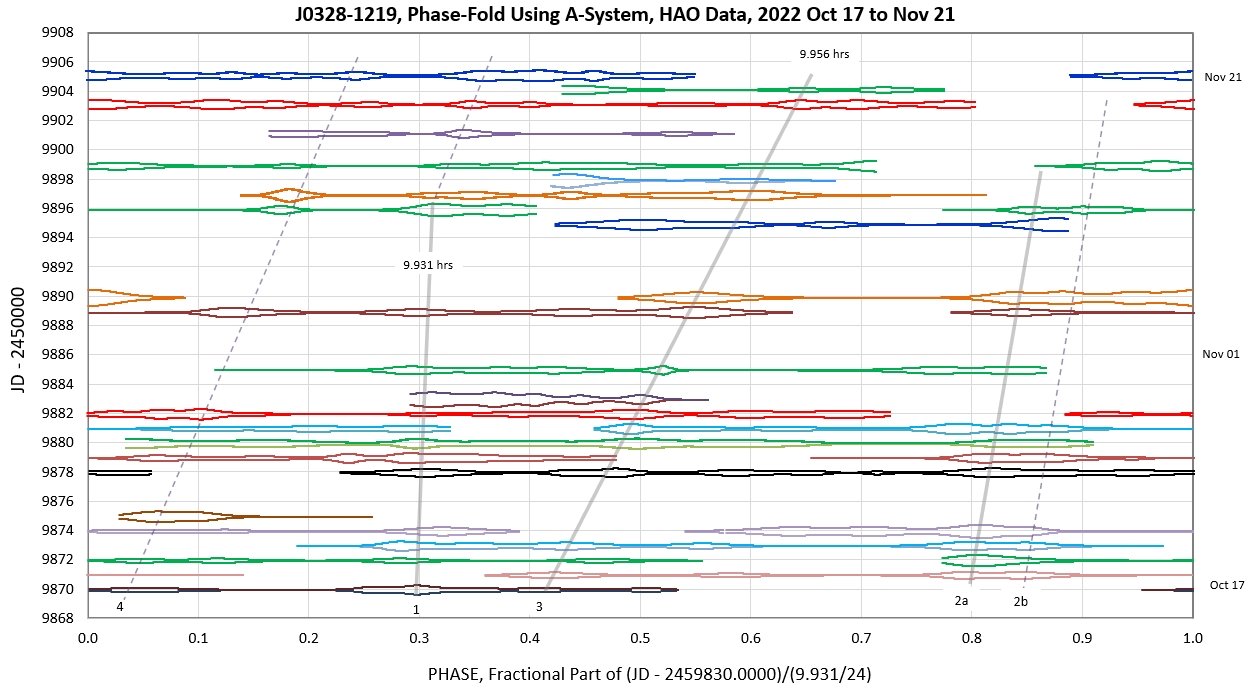
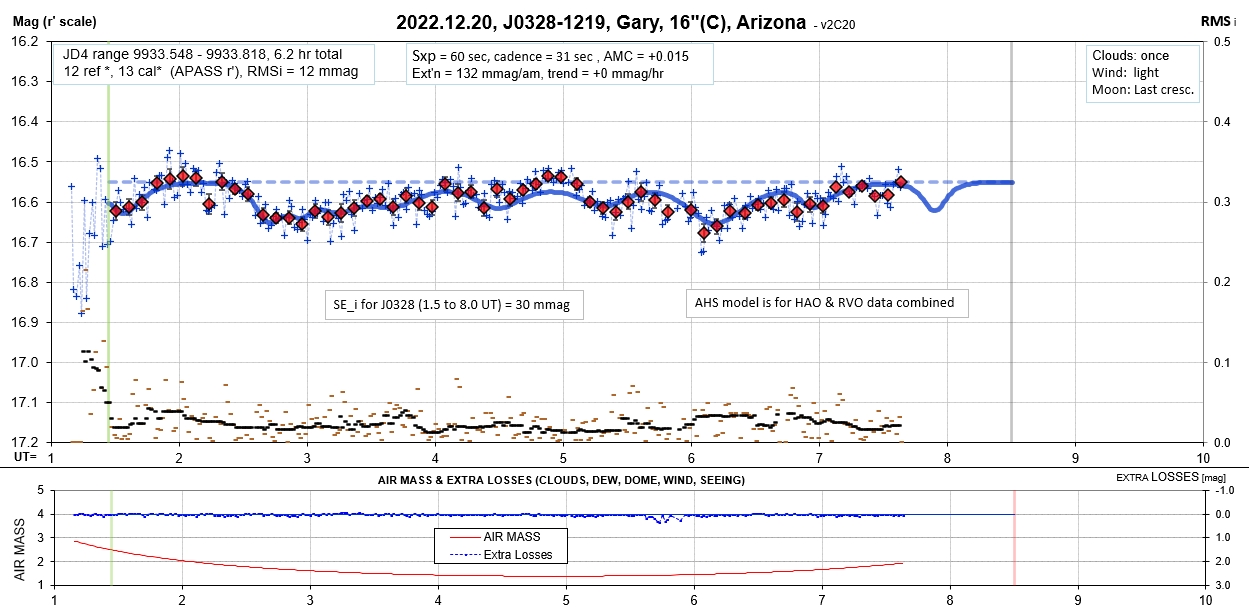
J0328 resembles WD1145 in the following ways: 1) dips are present some of the time, 2) dips exist for weeks to months, 3) the inner-most orbit is the most active in producing dips, and 4) dust clouds are in orbits that can (or must) be close to the WD's tidal radius. J0328 differs from WD1145 in the following respects: 1) during seasons #1 and #2 J0328 dips were present essentially all the time, whereas for WD1145 there are almost always plenty of OOT time per orbit, 2 ) the J0328 dust clouds are in a larger orbit , with P > twice the WD1145 P's. 


Since the WD1145 dust cloud sources (fragments of a planetesimal source) are certainly related in some way to being on the verge of tidal disruption I suggest that the J0628 dust clouds are produced by the same mechanism. I propose that the fragments for both WD1145 and J0328 are being bombarded by a background of rock collisions that become exhausted at the fragment location after a few weeks to months. This replenishment of dust that is continually lost from Keplerian shear and radiation pressure amounts to a steady-state of production and loss, thus accounting for long timescale preservation of dust cloud shape (depth and width) that would not occur in the absence of continual collision bombardment.

When a fragment begins to be bombarded by a swarm of rocky debris it will start with a shape that is narrow and will deepen quickly, while eventually reaching a steady-state level of collisional bombardment. While the rate of rocky bombardment is constant the dip will have a quasi-constant shape (depth and width). As the background level of rocky debris diminishes the dip should broaden and become reduced in depth. 
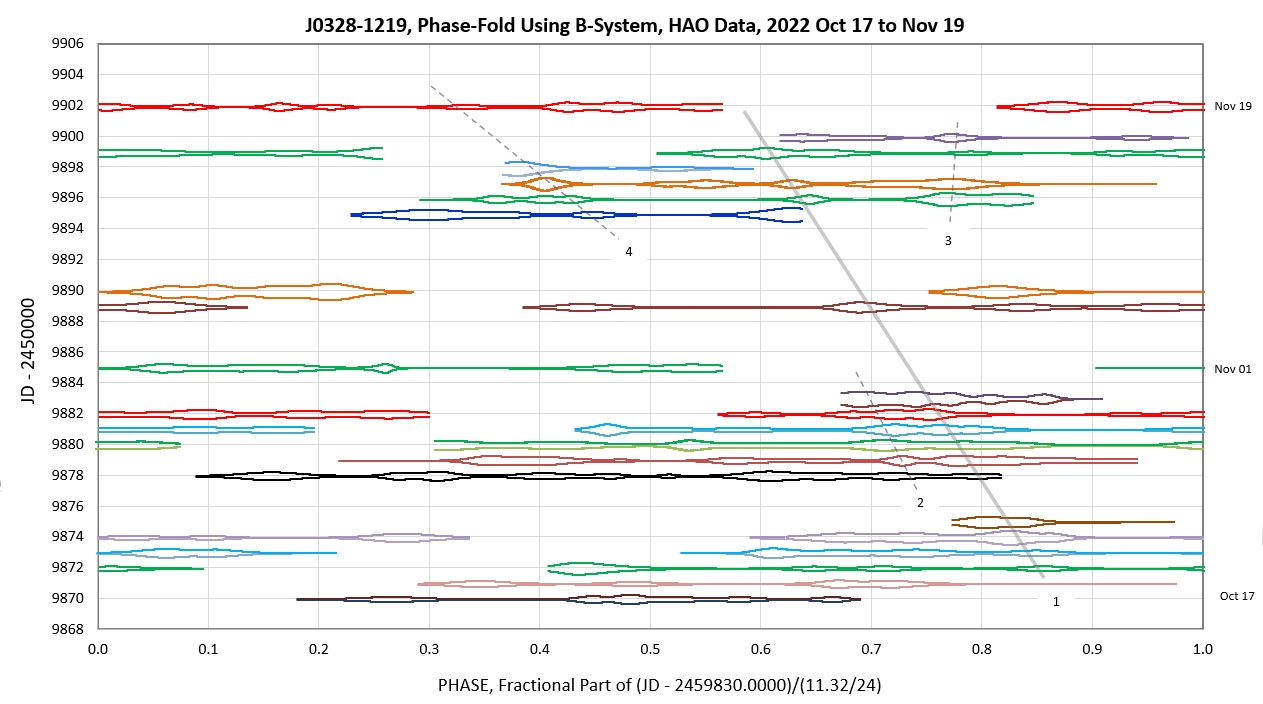
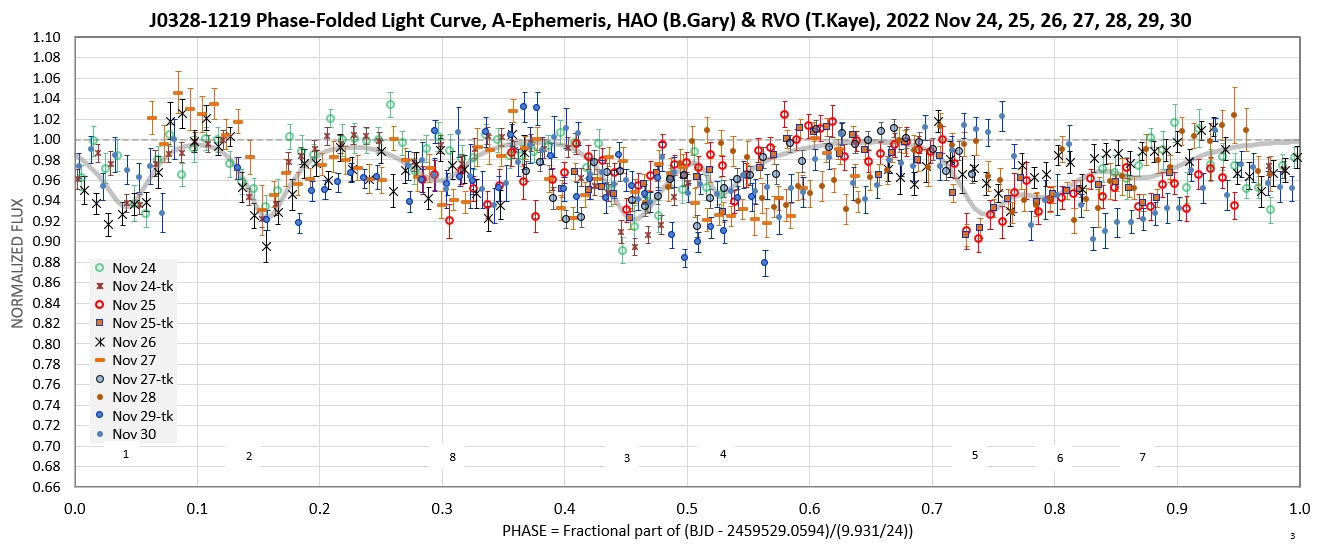
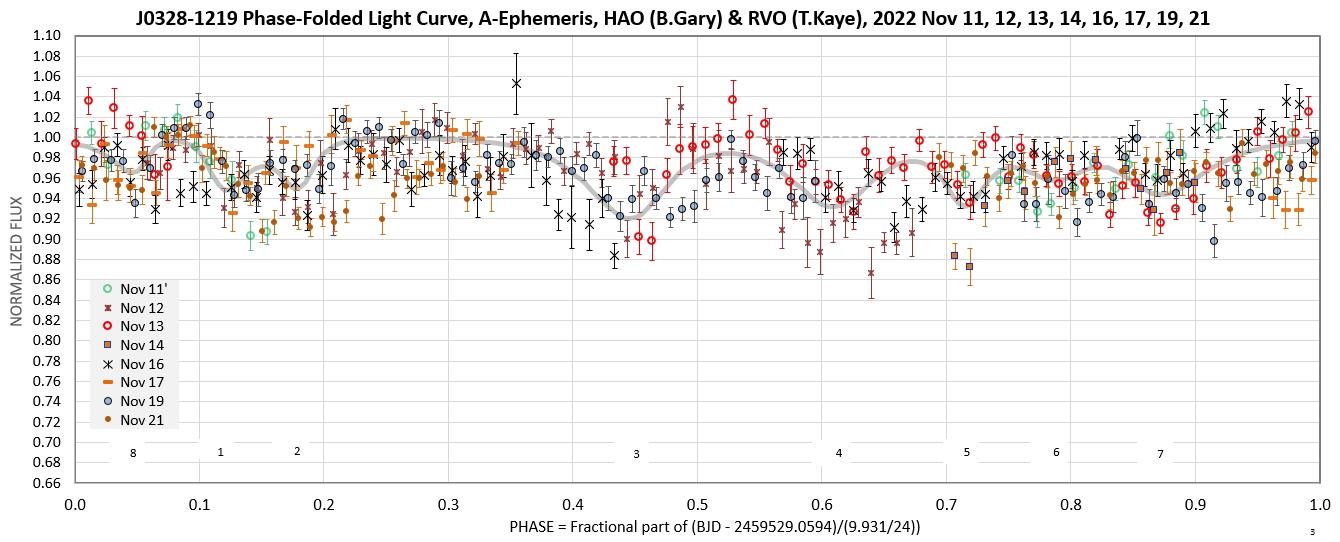
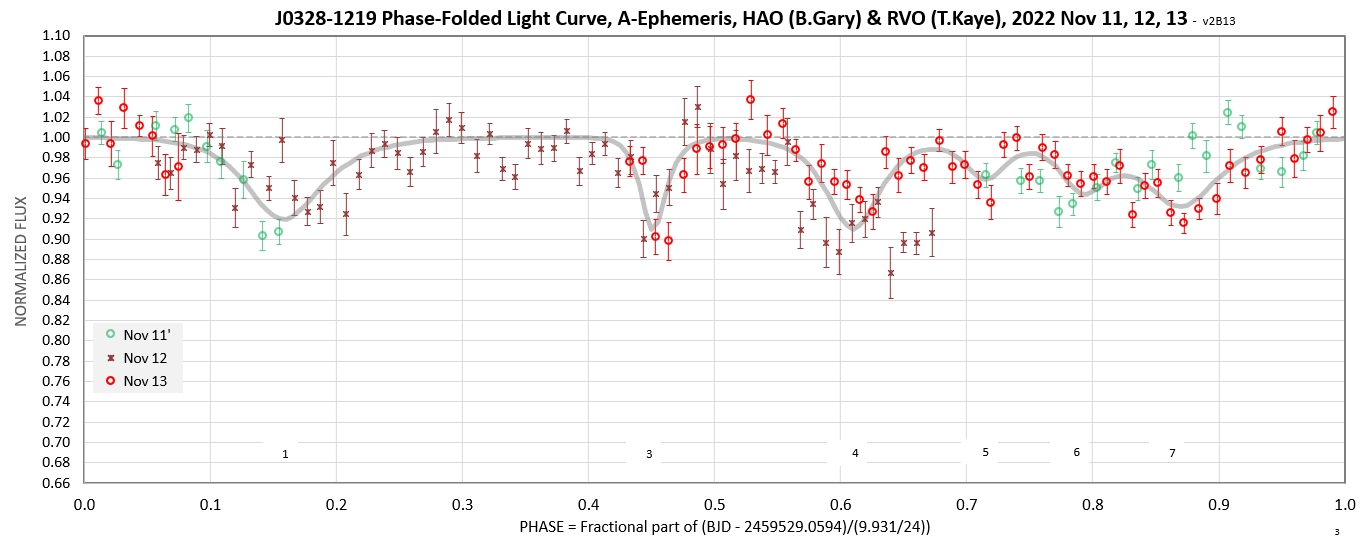
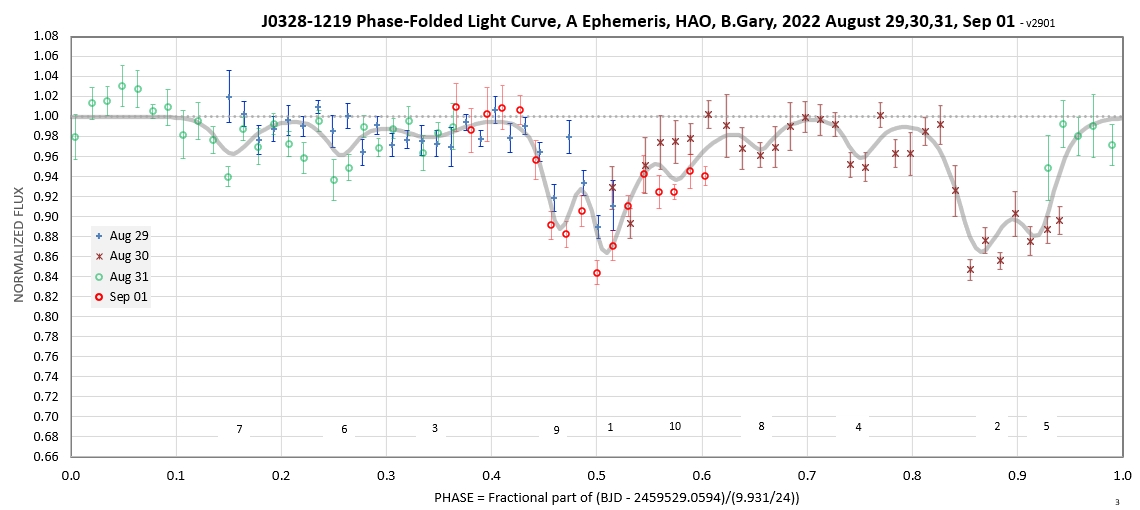
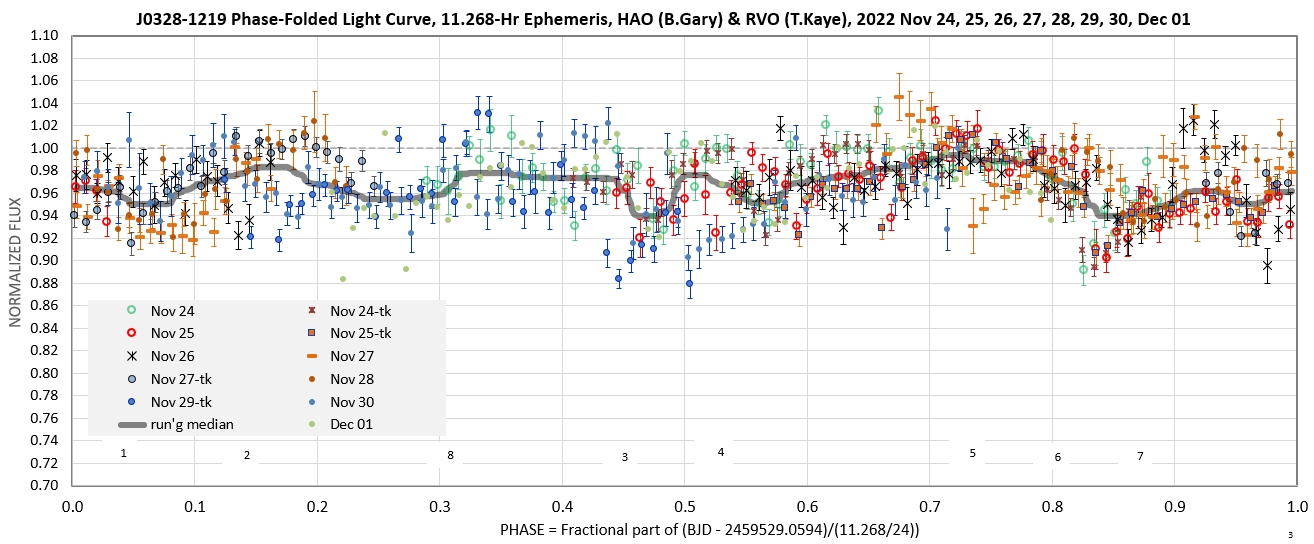
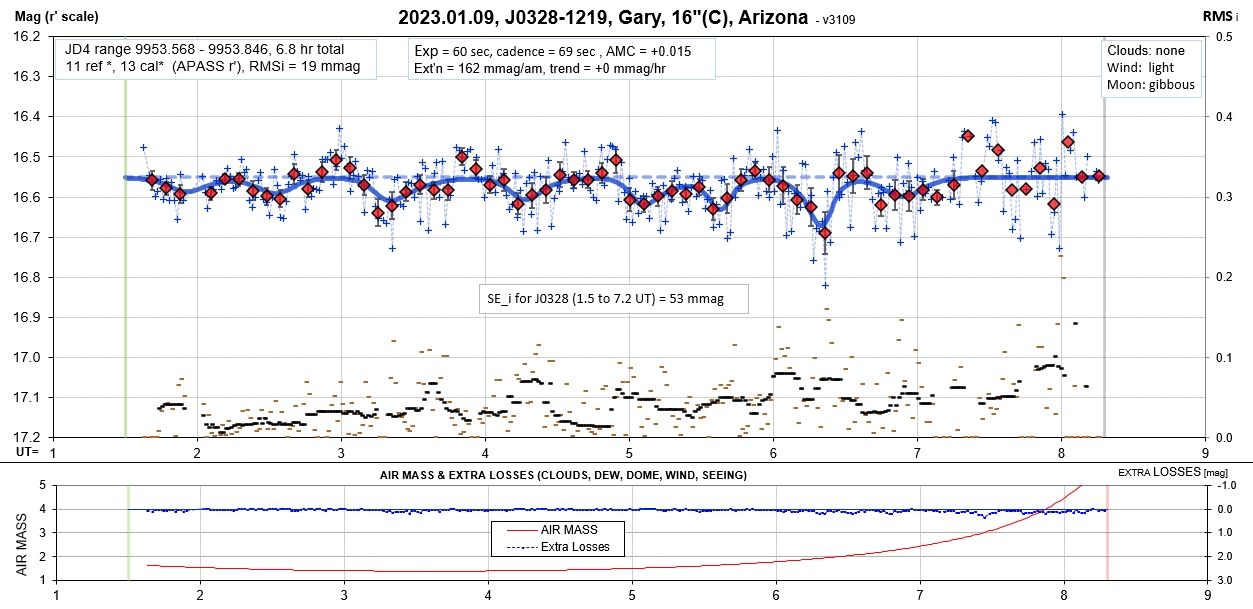
These three life-cycle phases can be thought of as "early, "middle" and "late." Accordingly, this observing season's A dip is in a late phase whereas the B dip is in an early phase.

Whereas WD1145's planetesimal source for fragments is a planetary core (with density ~ 7 g/cc), the J0328 planetesimal source for fragments is an asteroid (with density ~ 2 g/cc).

My Collaboration Policy

Please don't ask me to co-author a paper! At my age of 83 I'm entitled to have fun and avoid work. Observing and figuring things out is fun; writing papers is work. My observations are "in the public domain" and are available for use by anyone. If my data is essential to any publication just mention this in the Acknowledgement section.


References

Vanderbosch, Zachary P., Saul Rappaport, Joseph A. Guidry, Bruce L. Gary and 13 others, "Recurring Planetary Debris Transits and Circumstellar Gas around White Dwarf ZTF J0328-1219," MNRAS arXiv

Xu, Siyi, Samuel Lai and Erik Dennihy, 2020, "Infrared Excesses around Bright White Dwarfs from Gaia and unWISE I," arXiv 

Guidry, Joseph A., Zachary P. Vanderbosch, J. J. Hermes, Brad N. Barlow, Isaac D. Lopez, Thomas M. Boudreaux, Kyle A. Corcoran, Bart H. Dunlap, Keaton J. Bell, M. H. Montgomery, Tyler M. Heintz, D. E. Winget, Karen I. Winget, J. W. Kuehne, 2020, "I Spy Transits and Pulsations: Empirical Variability in White Dwarfs Using Gaia and the Zwicky Transient Facility," submitted to ApJ, arXiv

Rappaport, Saul, Roberto
Sanchis-Ojeda, Leslie A. Rogers, Alan Levine & Joshua Winn, 2013, "The Roche Limit for Close-Orbiting Planets: Minimum Density, Composition Constraints and Applications to the 4.2-Hour Planet KOI 1843.03," ApJ L, arXiv 


External Links of Possible Relevance

J0328 Photometry observations by Bruce Gary during observing season #1 (2020/2021)
WD1145 summary of 4 observing seasons
WD1145 for 2020/21 observing season
Resume of webmaster

____________________________________________________________________

This site opened December12, 2021. Nothing on this web page is copyrighted.