WD 1145+017 Data Group Averages
for #10
Bruce L. Gary, Last Updated
2023.05.08, 23 UT
This web page was taken from http://www.brucegary.net/zombie10/
in order to streamline that page.
Phase-folded Light Curves for Date
Groups
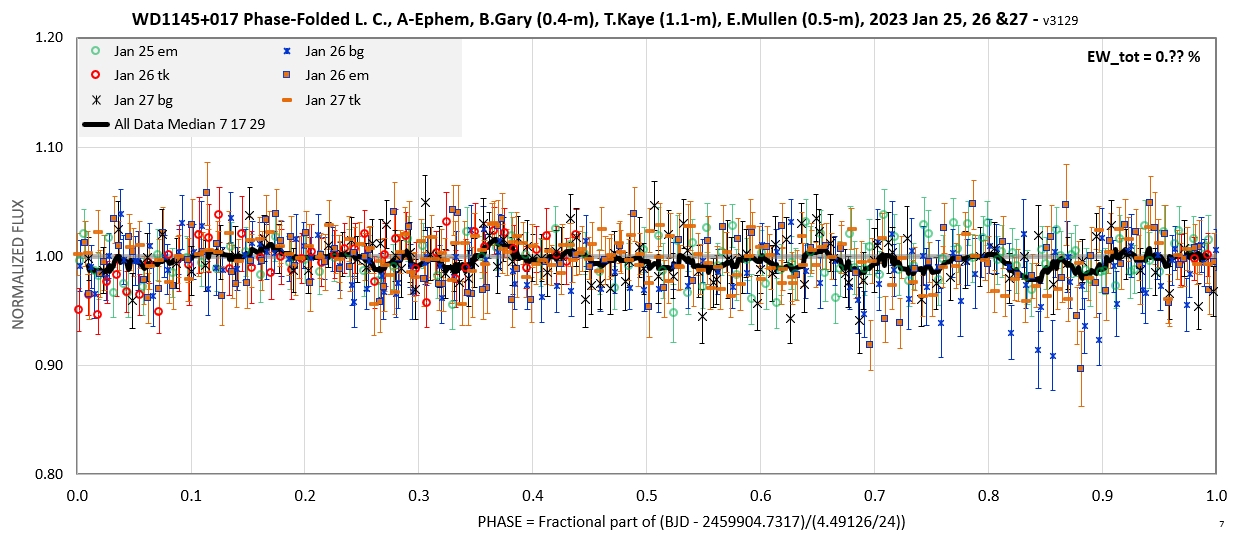
Since our SNR isn't sufficient for ruling out the presence of
dips (at the 1 % depth level, for example) the following
phase-folded LCs for observing session groups (of only "a few" days)
will be our best product for assessing the presence or absence of
dip activity.
Mar 25 - 27
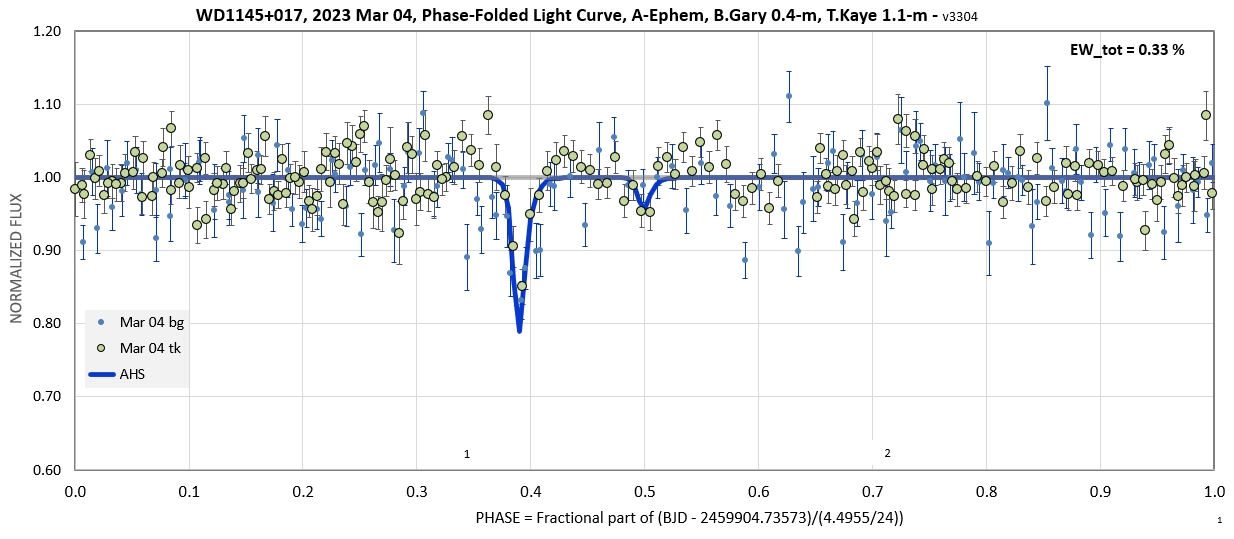
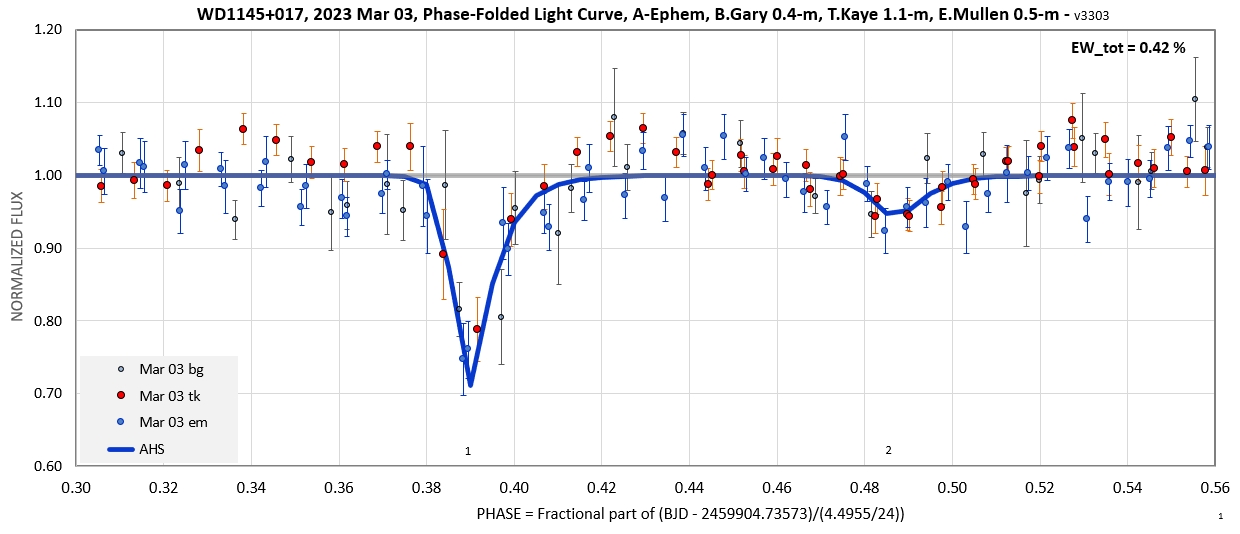
Mar 03
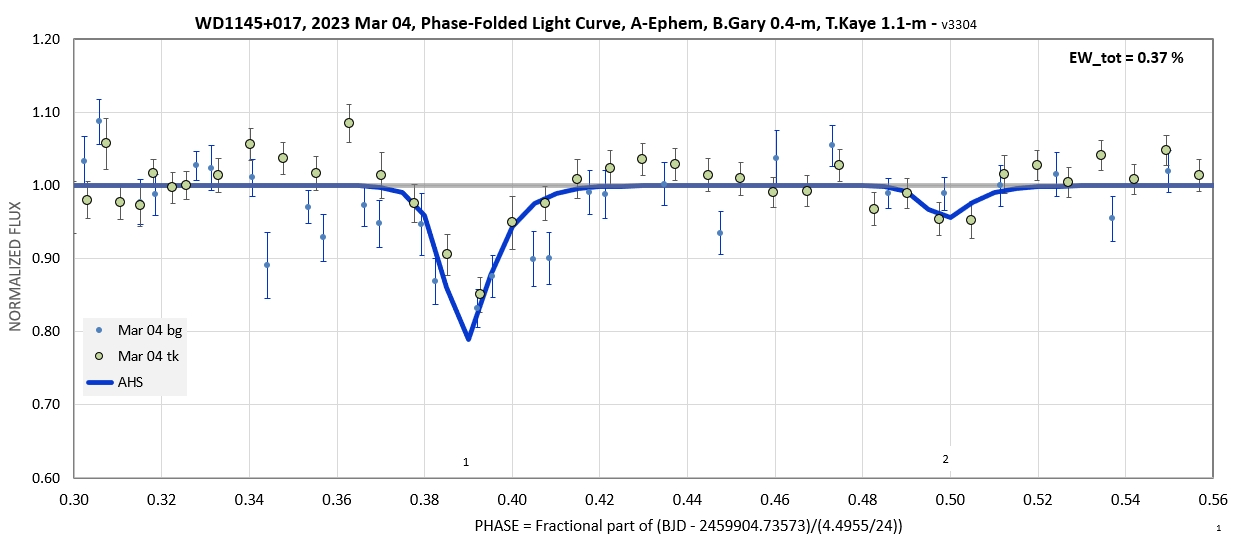
The 2nd dip is really not detected.
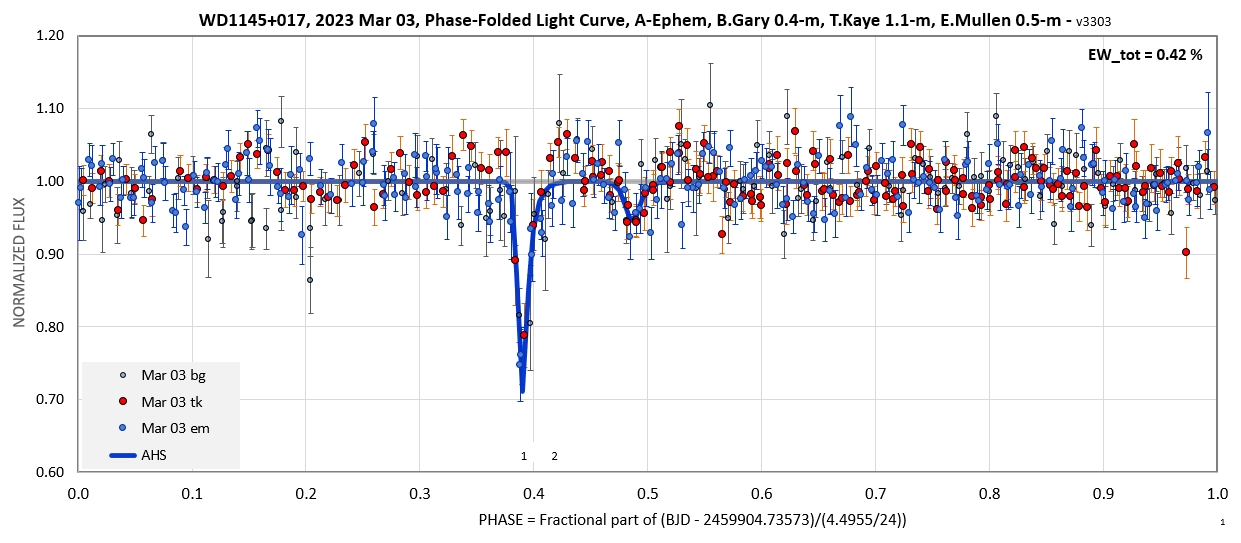
Mar 03
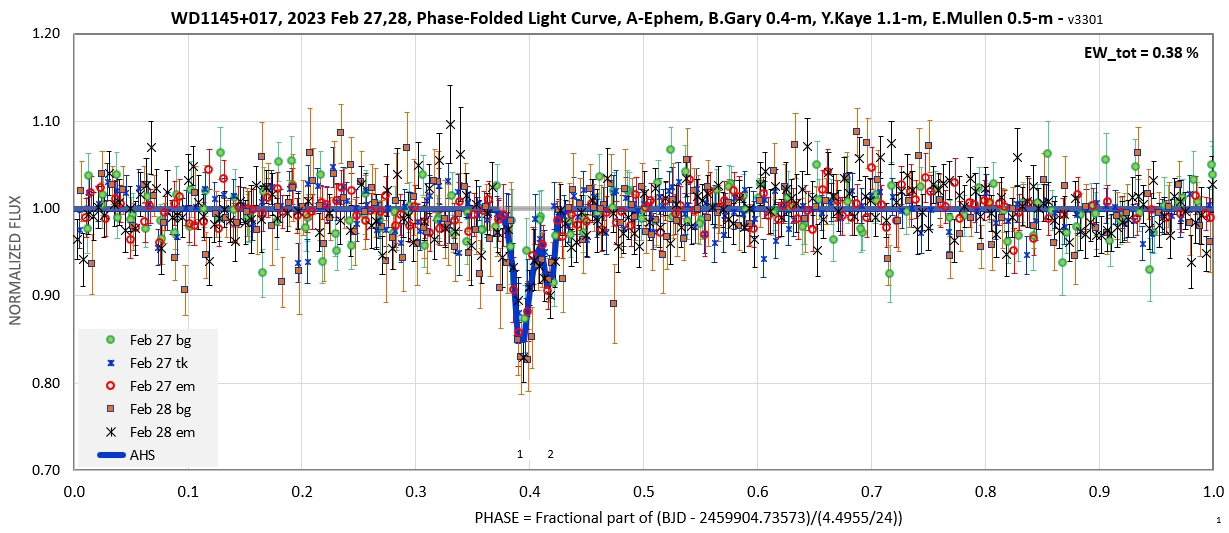
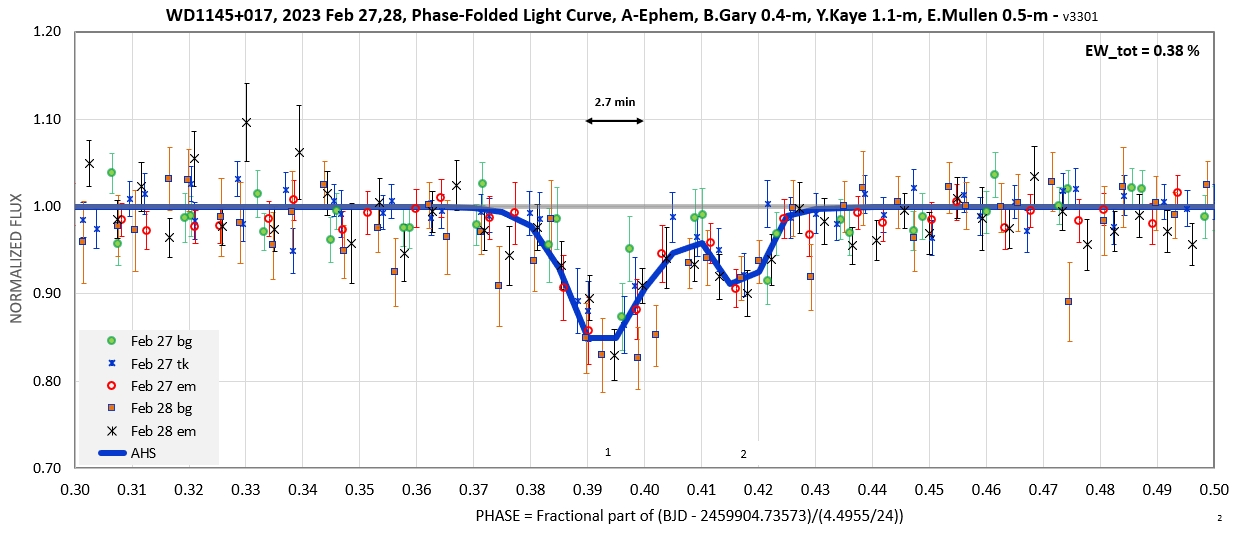
Group Feb 27,28
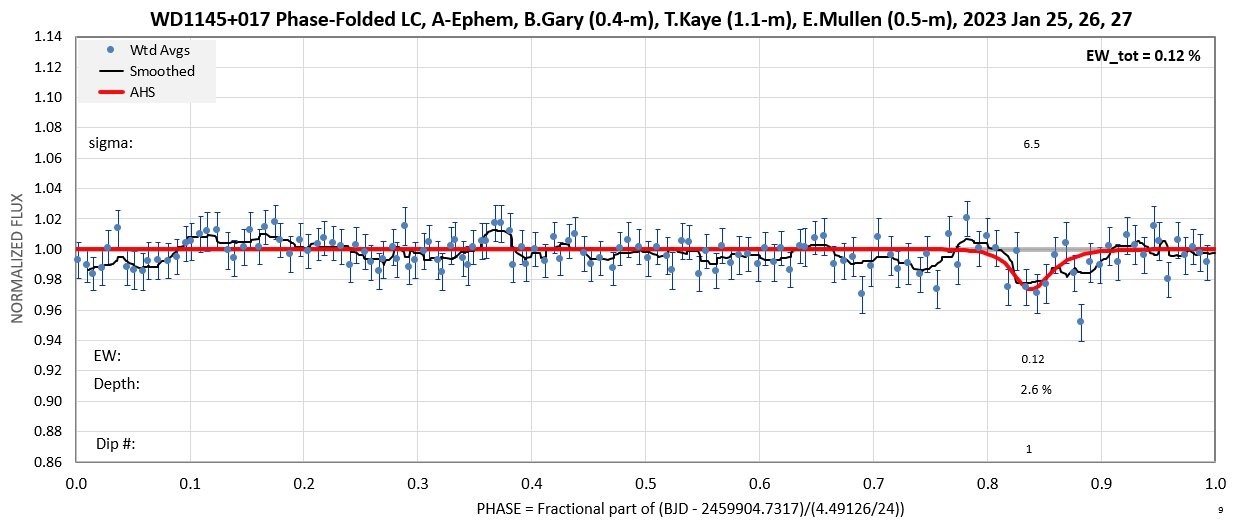
Group Jan 25-27
Group Jan 20-22
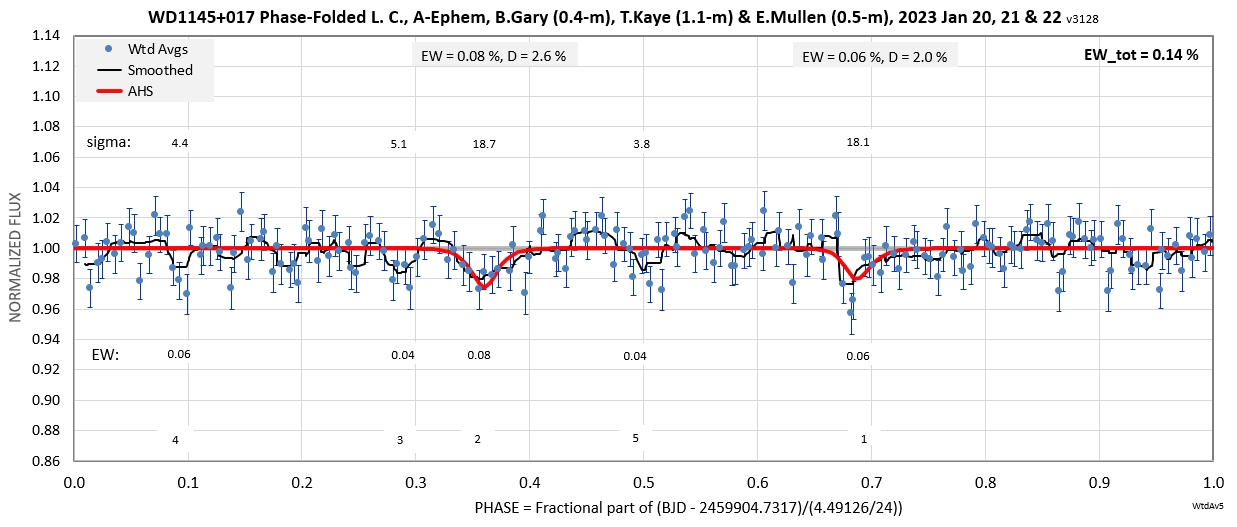
Adopted dip model fit for a LC for 3-day observing interval
showing candidate dips and their statistical significance (sigma)
and contribution to dip activity (EW).

Phase-fold LC for a 3-day observing interval showing two
possible dips .
Group Dec 20 - 31
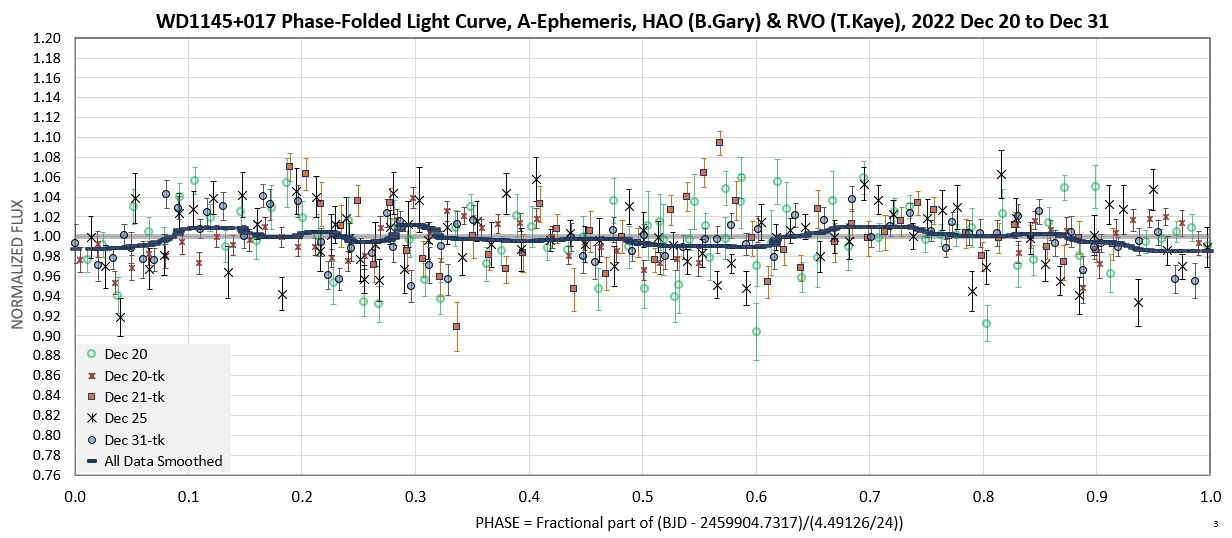
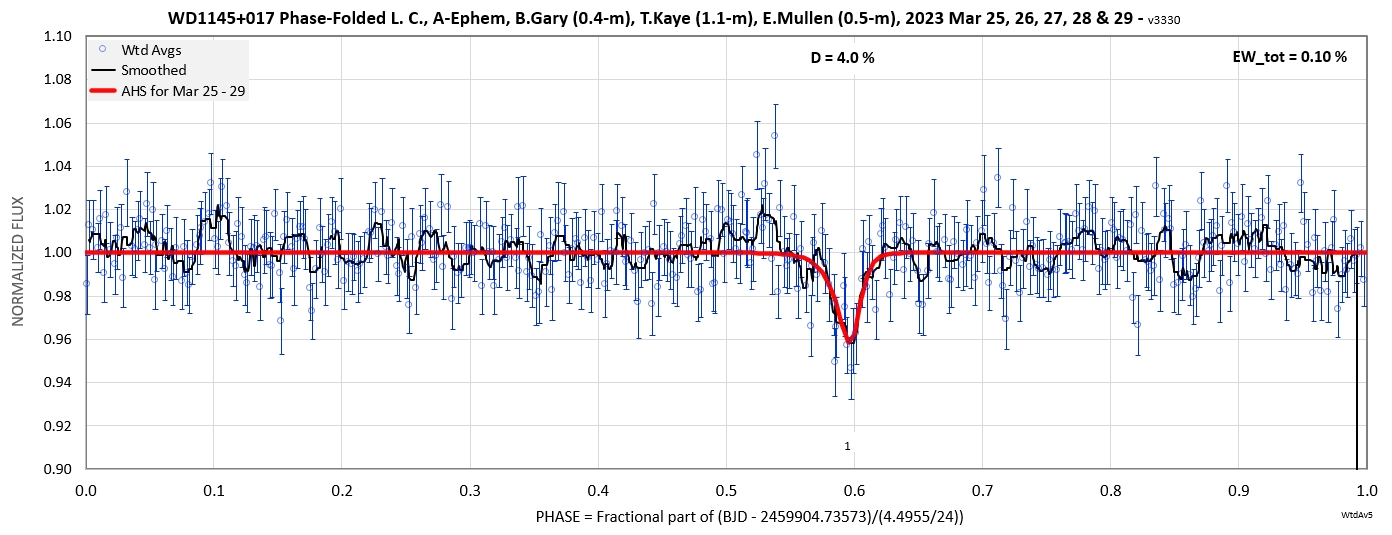
Phase-fold LC after combining all data for 4 days (5
observing session data sets) of the current group of observing
sessions (using the A-system ephemeris).
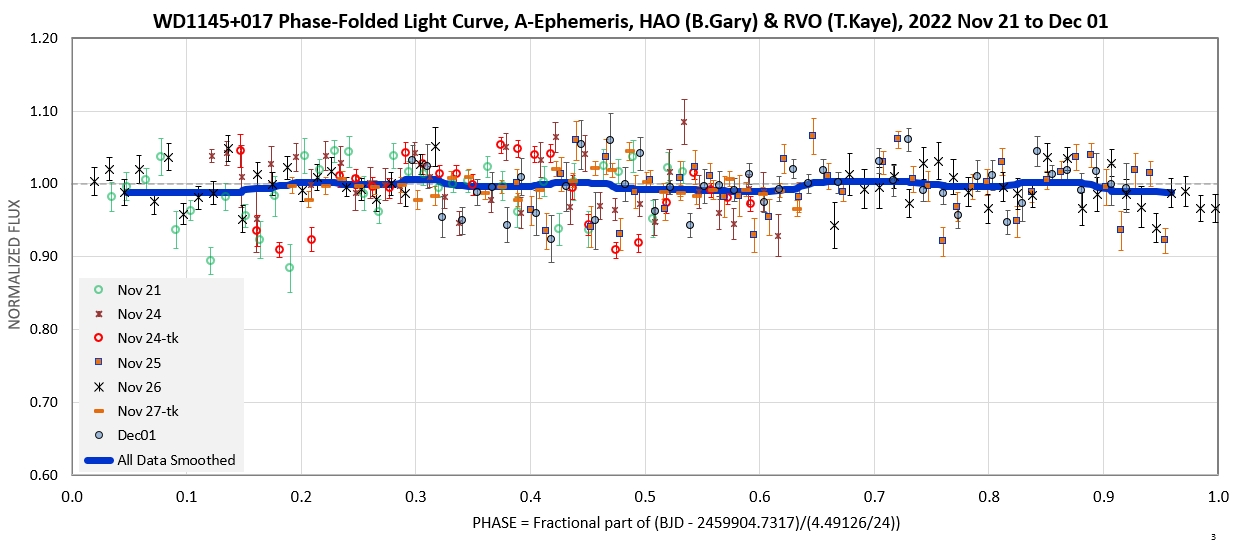
Phase-fold LC after combining all data for the first 10 days of
the first group of observing sessions (using the A-system
ephemeris).
This LC shows no dips (> 1 %) when data are combined on the
assumption that any dips that are present belong to the A-system
(4.49126 hrs) and that they persist for the duration of the 10-day
observing interval.
Return to calling web page: link
____________________________________________________________________