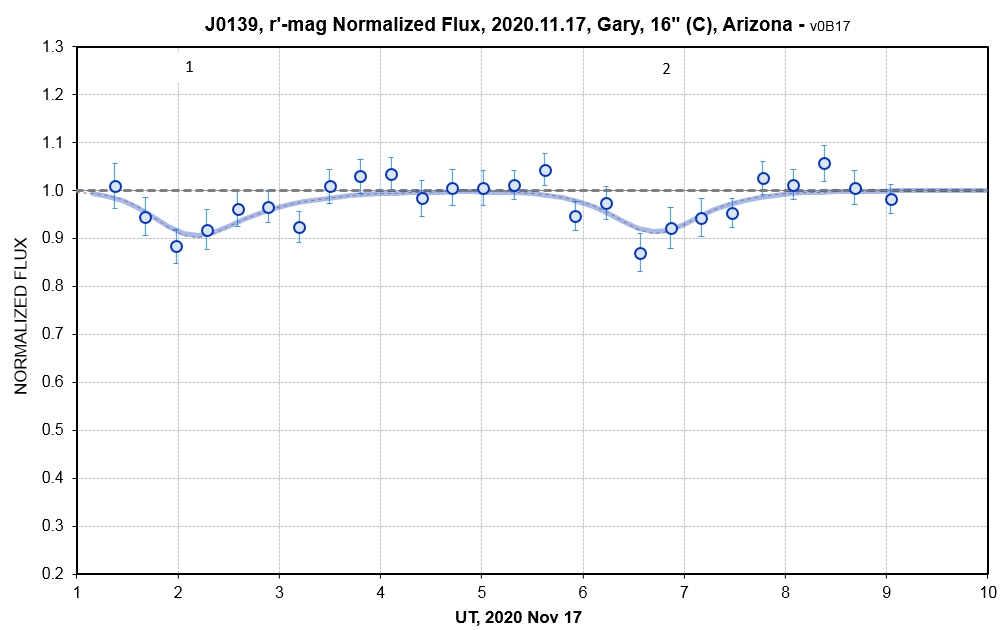
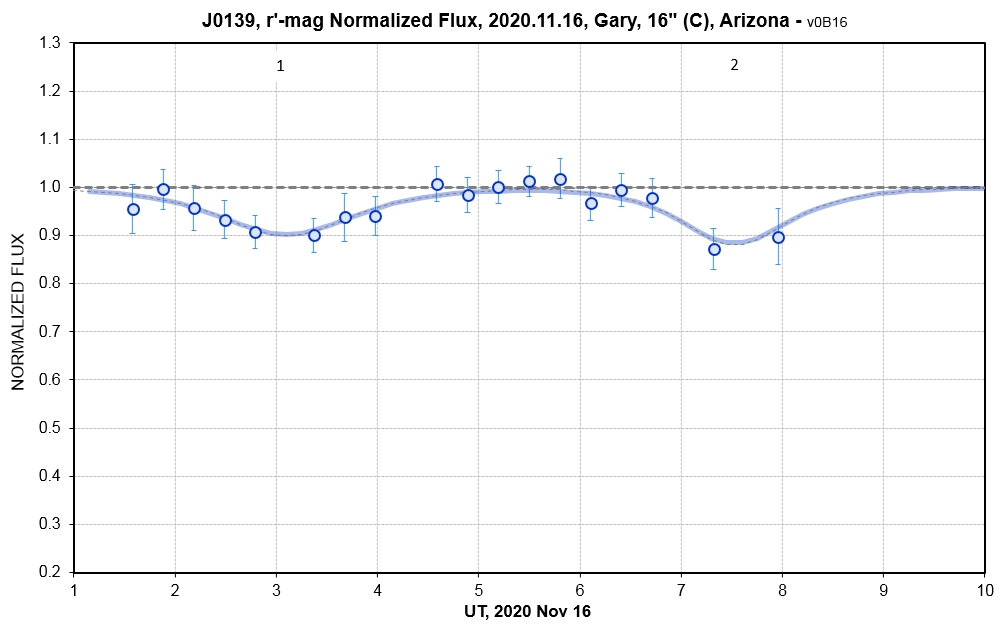
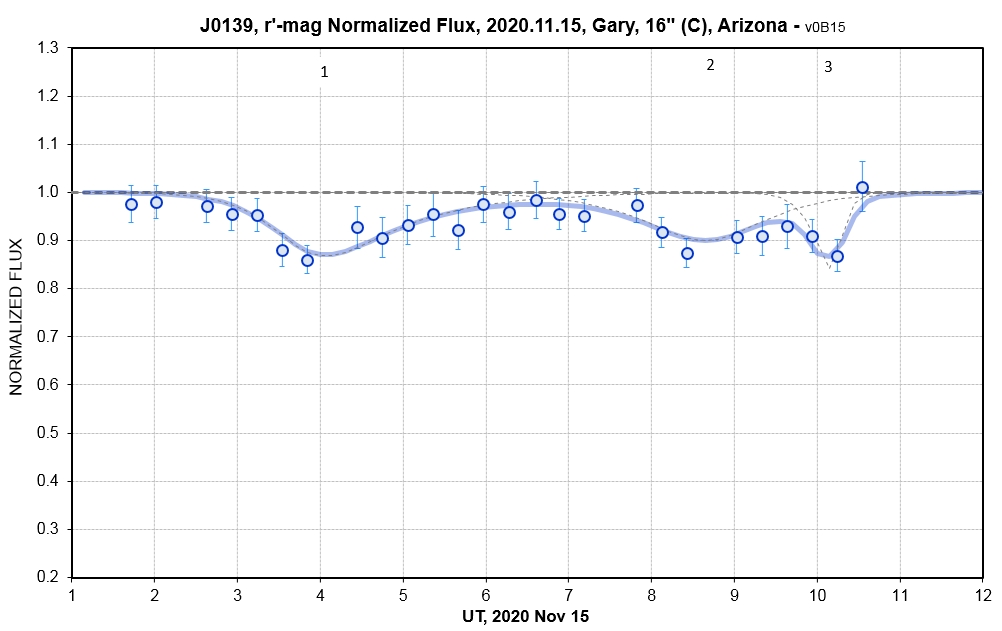
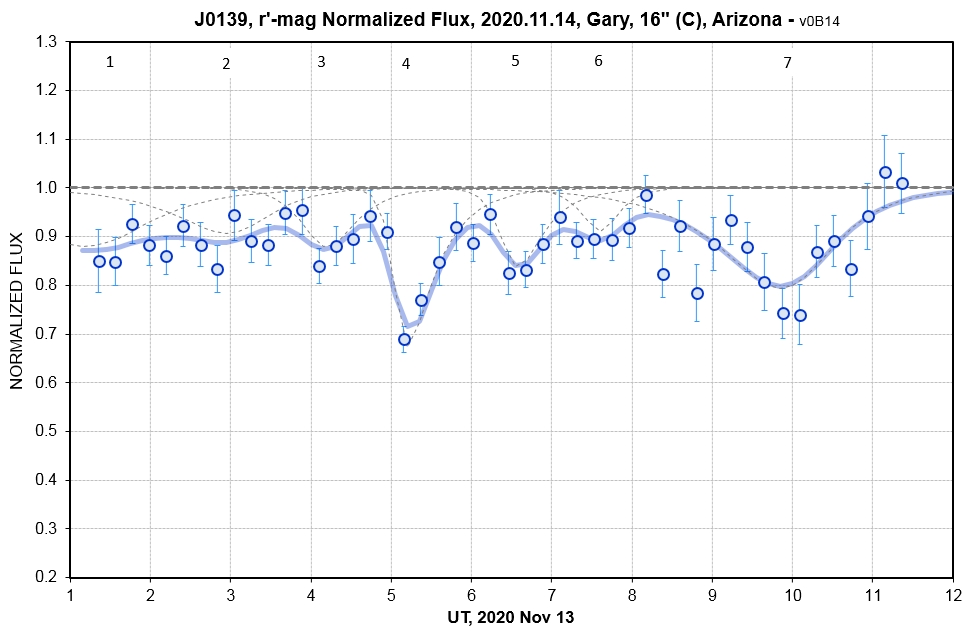
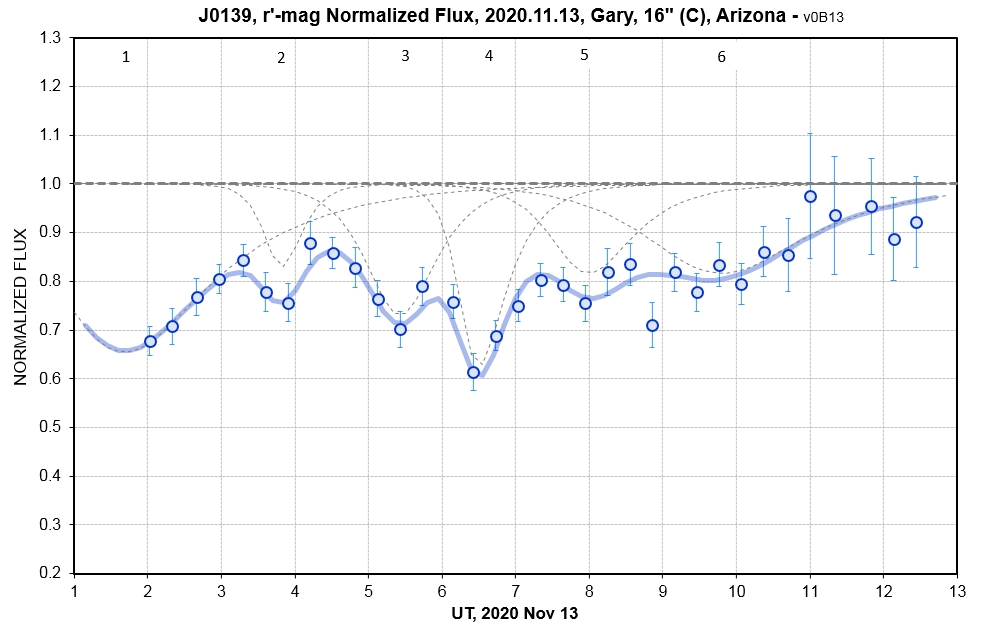
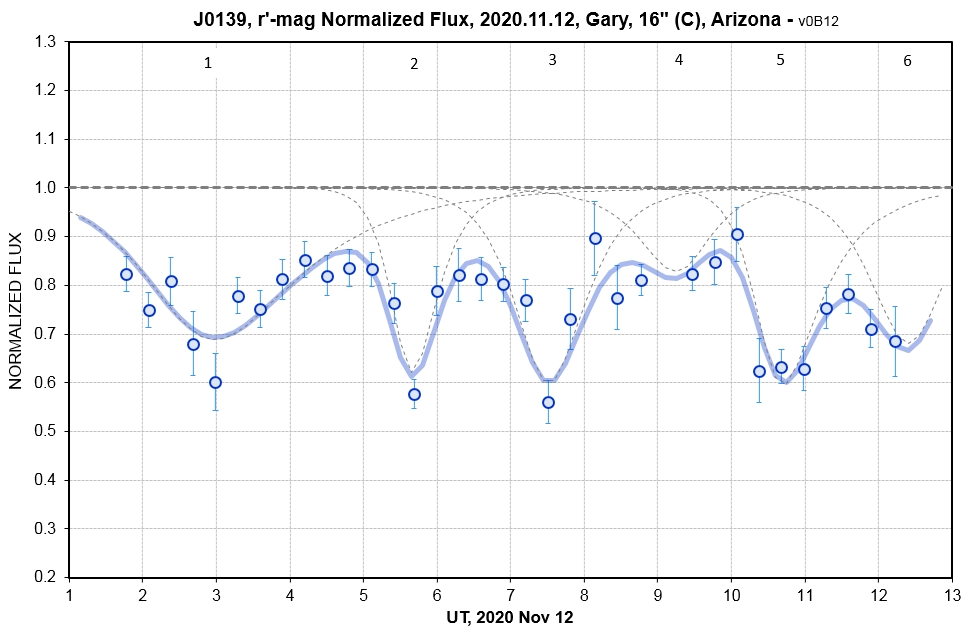
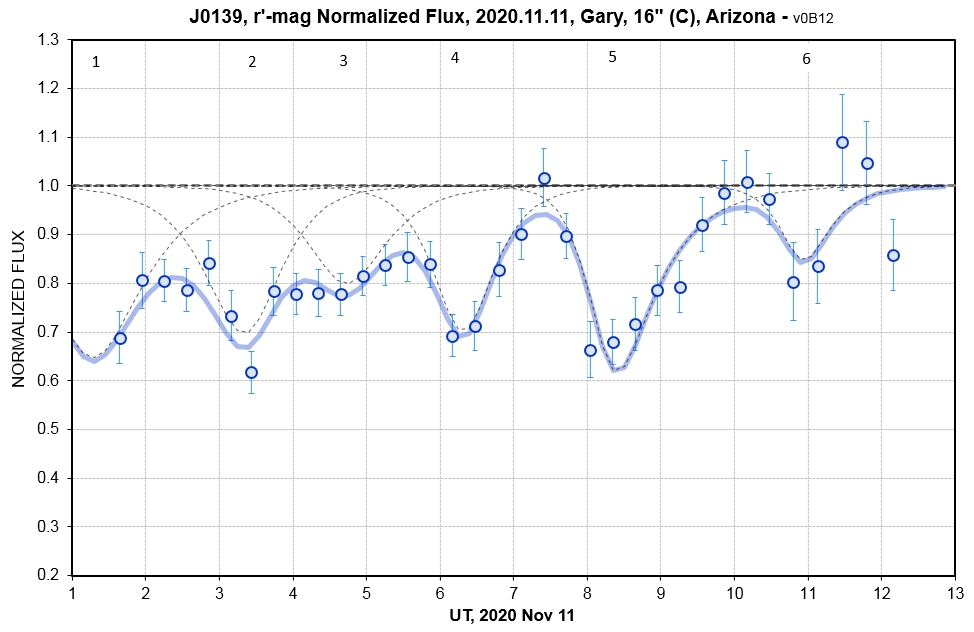
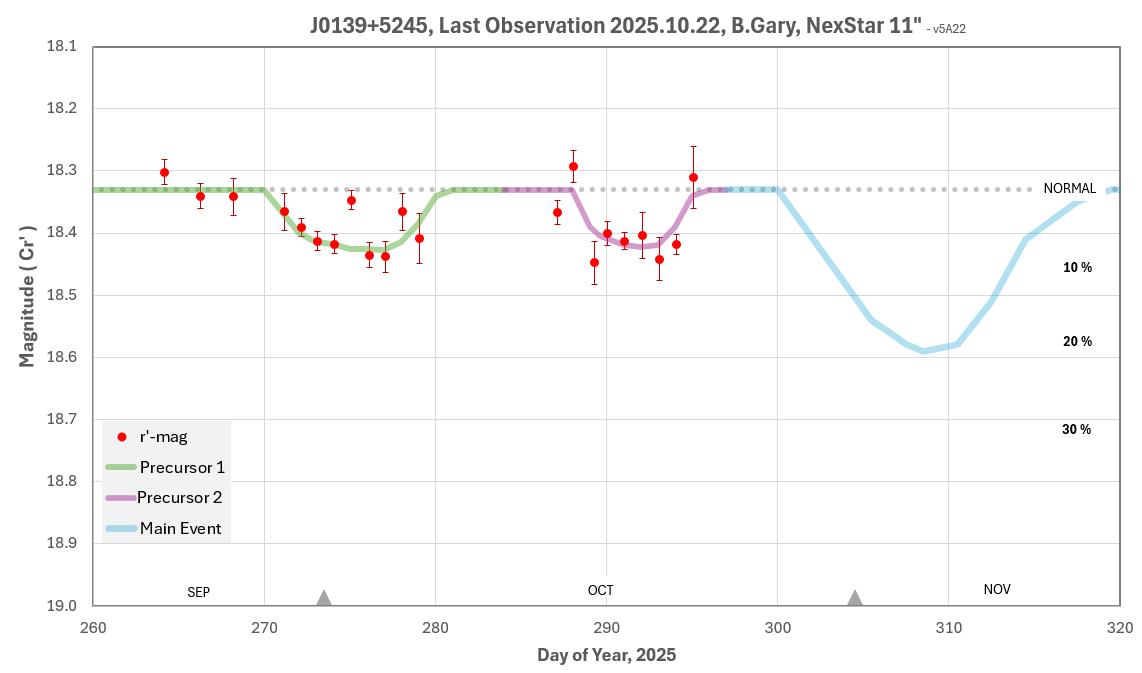
Figure 1c. The last 5 observing dates show two dips each, which have been identified as the "same" dust cloud transiting 10 times with a periodicity of 4.578 hours. (See Fig. 3 for each observing session's detailed light curve.)
J0139 (ZTF
J013906.17+524536.89) Photometry Monitoring by Amateur Bruce
Gary
Bruce L. Gary, Last Updated
2025.12.08
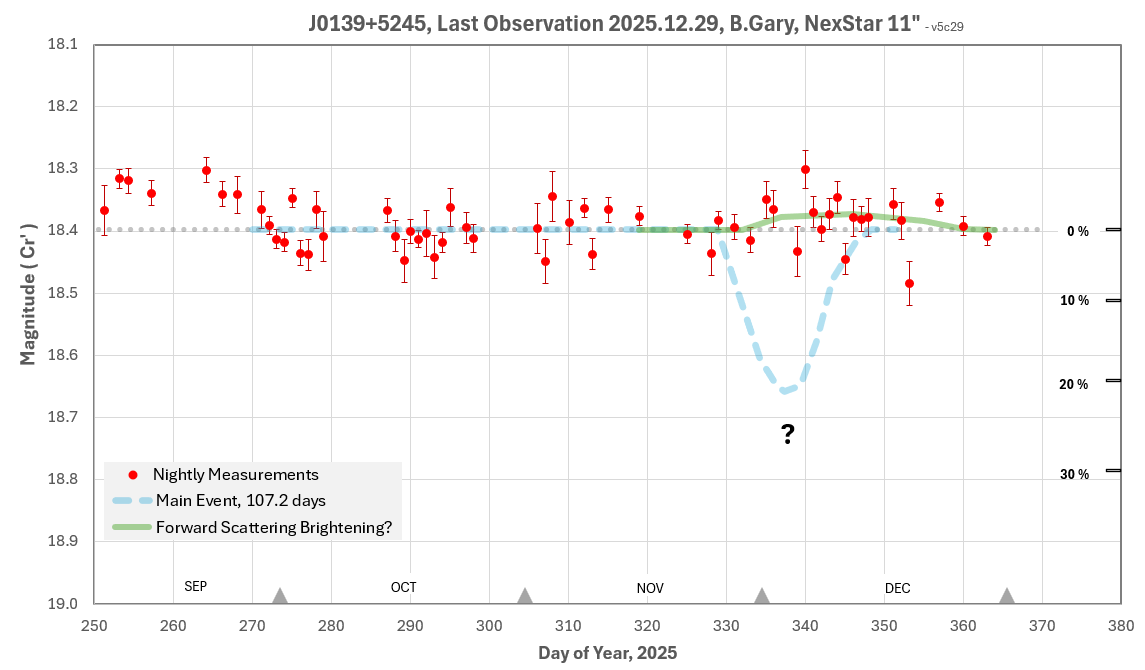
This web site reports photometry measurements of a white dwarf with a suspected planetesimal that is shedding dust debris when its 106-day elliptical orbit brings it close to the star's Roche distance. The presence of fades means that the orbiting debris crosses in front of the star. My intent is to observe this star at intervals of a few days to record future fade events in order to see if periodicity is regular or chaotic. So far the dust clouds appear to recur at intervals between 104 and 110 days, and each dust cloud has a different structure. The structure within a dust cloud appears to consist of regularly-spaced clumps. The 2019 October clumps were 5 hours apart whereas the 2020 November clumps are 2.4 hours apart. For both events the amplitude of variation on the several hour timescale was ~ 80 mmag.
Status
Fade events are now known to consist of many
independent dips with durations typically 1 or 2 hours and
depths ~ 50 % deeper than the depth of the long timescale (daily
averages) plot. During a typical observing session when
long-timescale fade is deep there are brief periods when
brightness is close to the OOT level (between brief dips).
Presumably, the previously observed week-long fade events really
consist of a multitude of short (1.5-hour) dips. This new
information has important constraints on modeling the dust cloud
spatial structure, and dust production mechanism. In other
words, instead of a week-long fade event being produced by one
broad dust cloud, which was a default assumption, a week-long
fade consists of 100 to 200 small dust clouds produced by the
same number of sources. The hundreds of sources can be thought
of as fragments from an earlier (tidal) break-up, or collision.
Because an observing session can consist of a half dozen
independent dips, with brightness ranging from close to OOT to
40 % depth, for example, it is possible during such an observing
session to measure depth vs. wavelength and determine the PSD
(particle size distribution) of each dust cloud. The published
periodicity of 107.2 days is somewhat supported by the recent
fade event.
We are currently observing a brightening above
the OOT level, which might be caused by forward scattering of a
big dust cloud that failed to produce a fade recently (might
have just missed our LOS).
Introduction
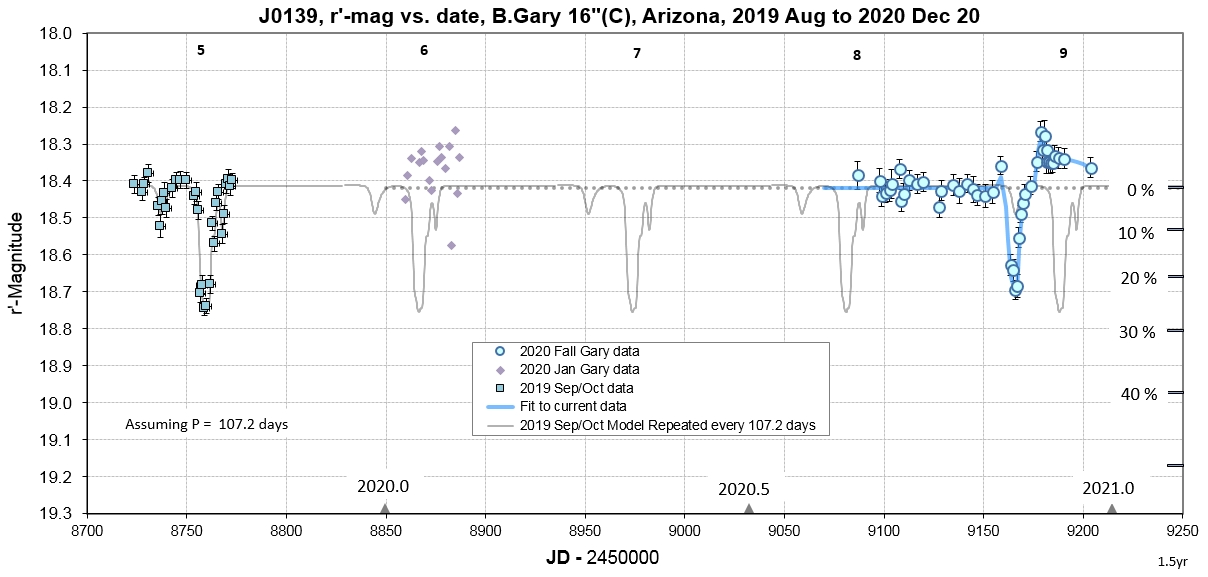
J0139 is a white dwarf (DA type, hydrogen atmosphere) that
appears to undergo 30 - 45 % fades at ~ 107-day intervals. Five
fades have been measured so far (Vanderbosch et al., 2019). I have
adopted the following tentative ephemeris for the middle of the
fades: JD = 2458661 + E × 107. The fade expected in late
2020 January did not occur! The discovery paper, Vanderbosch et
al. (2019), suggests that the fades are due to a planetesimal in a
110-day orbit that is very eccentric (e > 0.97), and during
periastron it is close to the Roche radius of the WD and fragments
are dislodged that form a dust cloud in the same orbit. RA/DE =
01:39:06.2 +52:45:37. The observing season is centered on October
22.
List of internal links
4.8-hr
Periodicity
Results to date
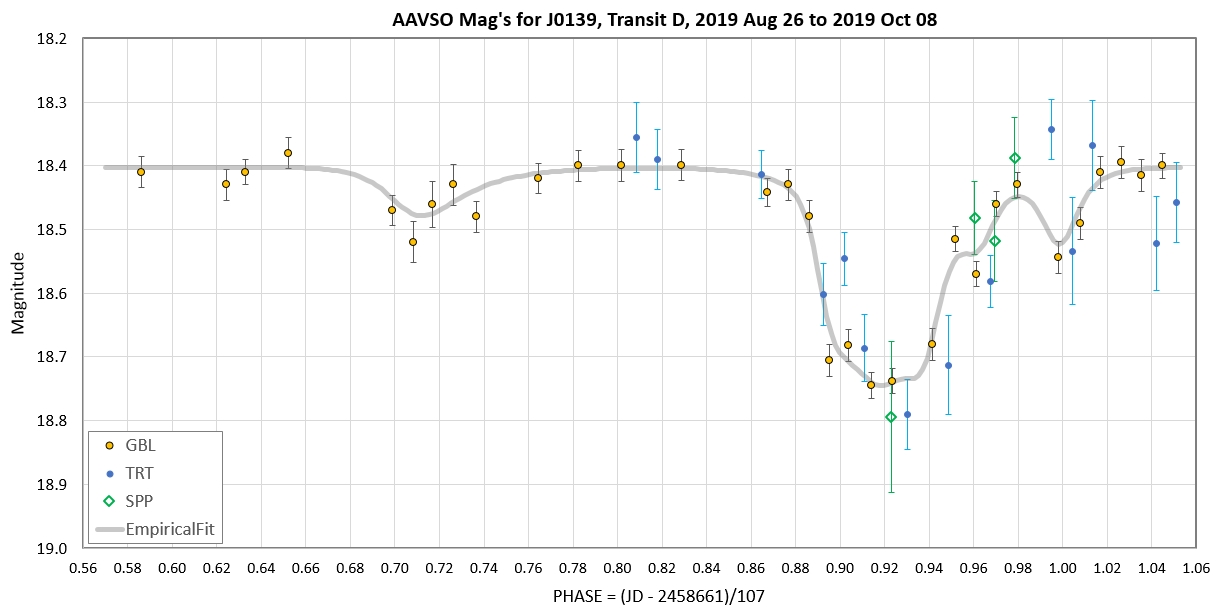
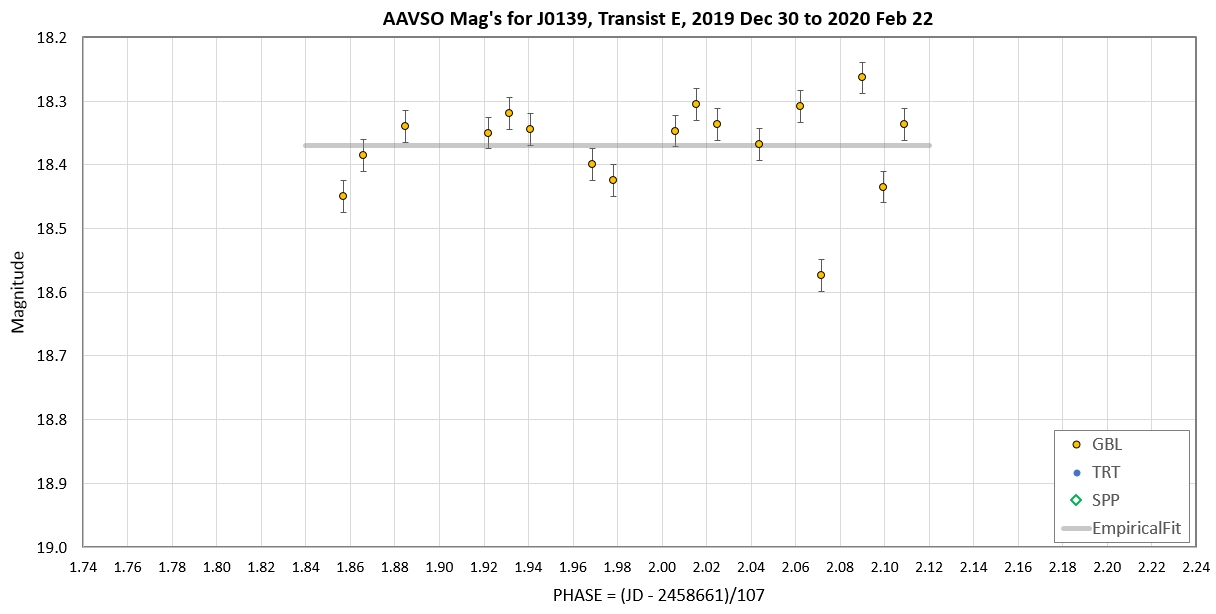
AAVSO
observations
Physical
model suggestion
Observing
sessions
Finder image
Observing
and Analysis Tips
References
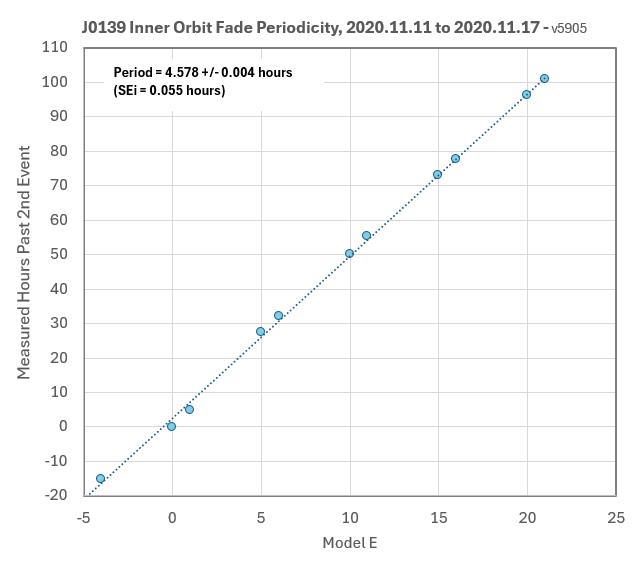
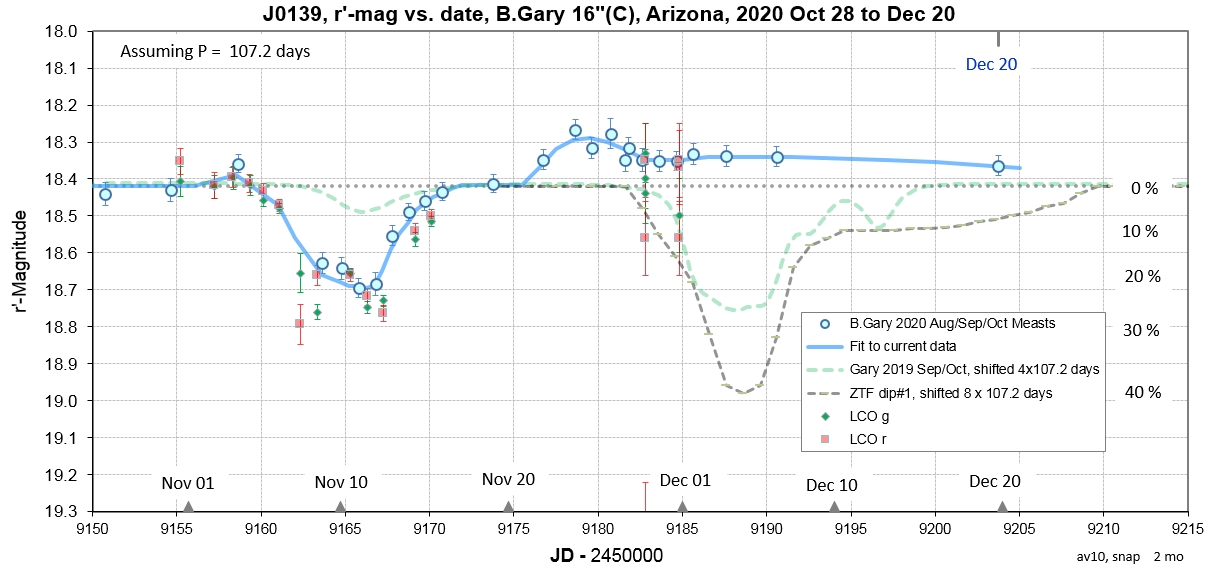
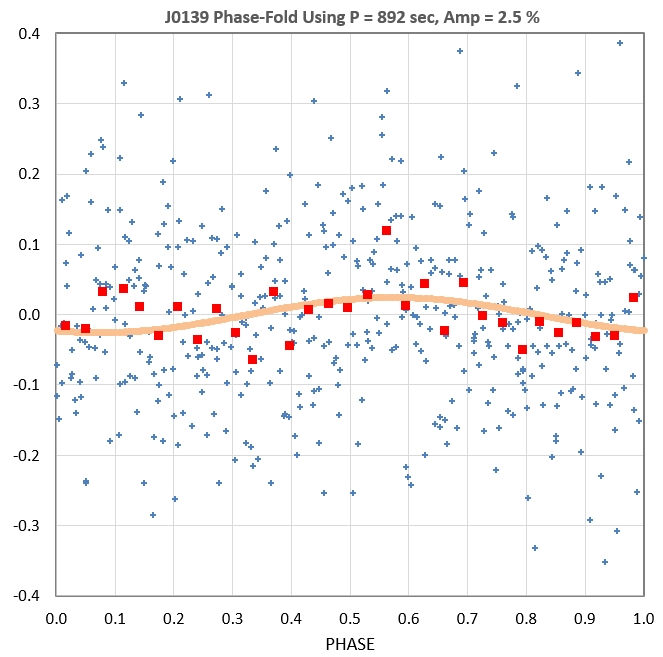
During the November 2020 activity event my observations were
extensive and they showed an interesting periodicity for a fade
event, as this graph shows:
.jpg)
The dips also exhibit a slow expansion of width vs. date.
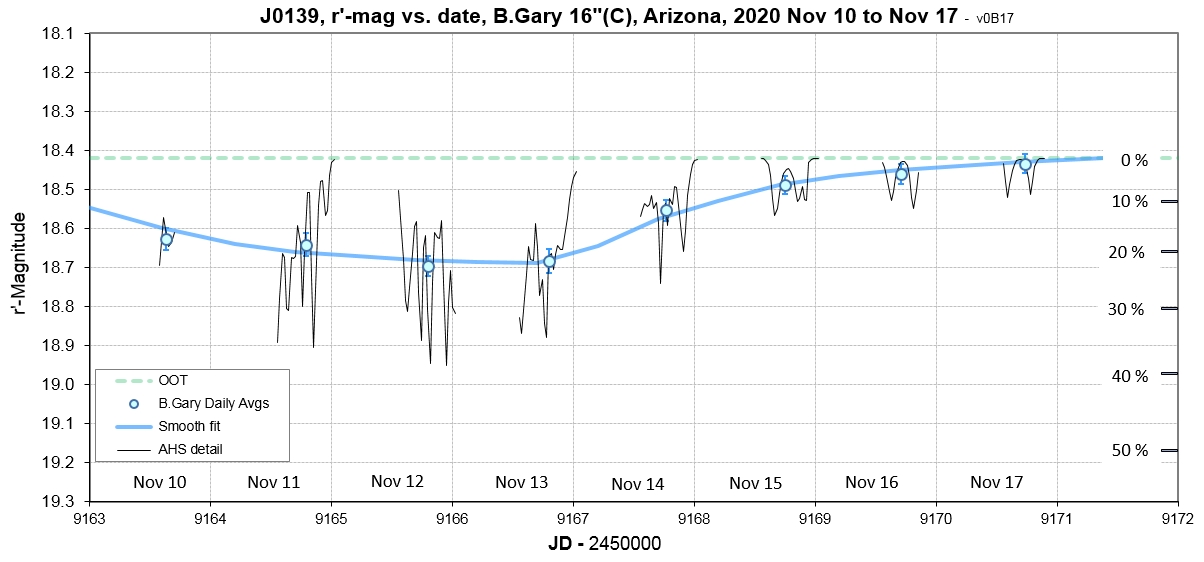
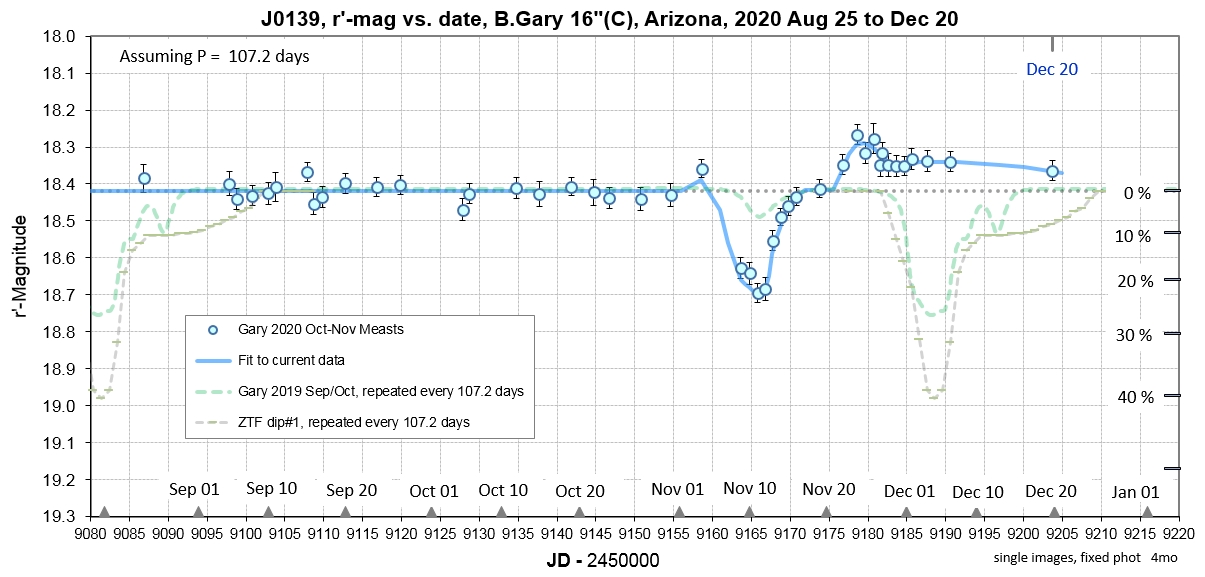
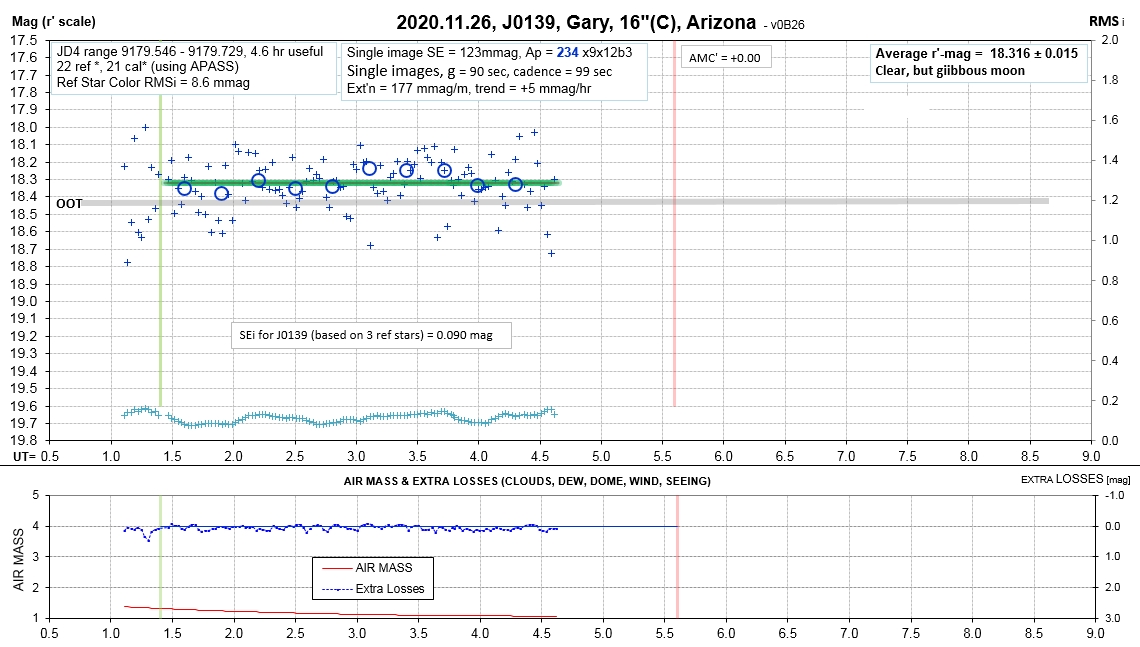
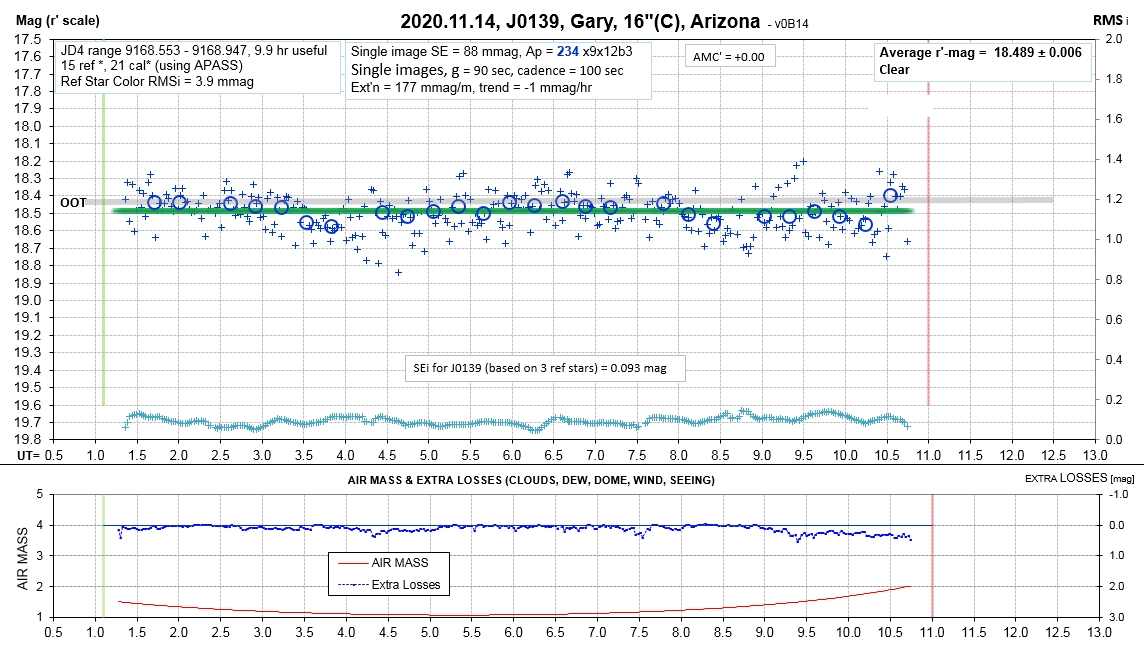
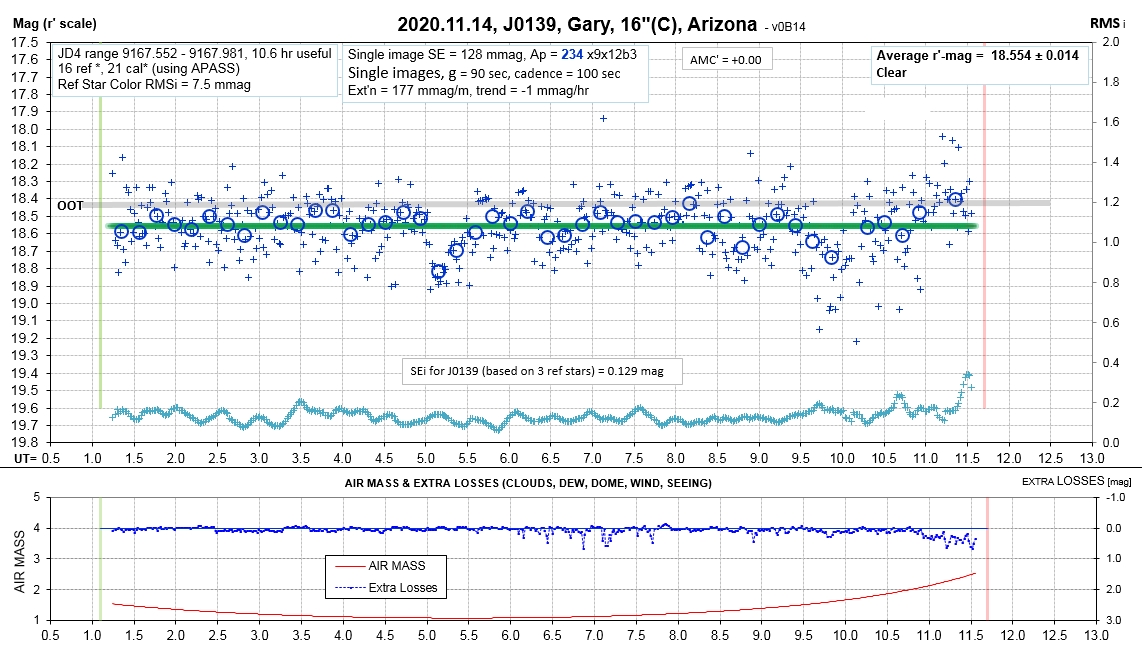
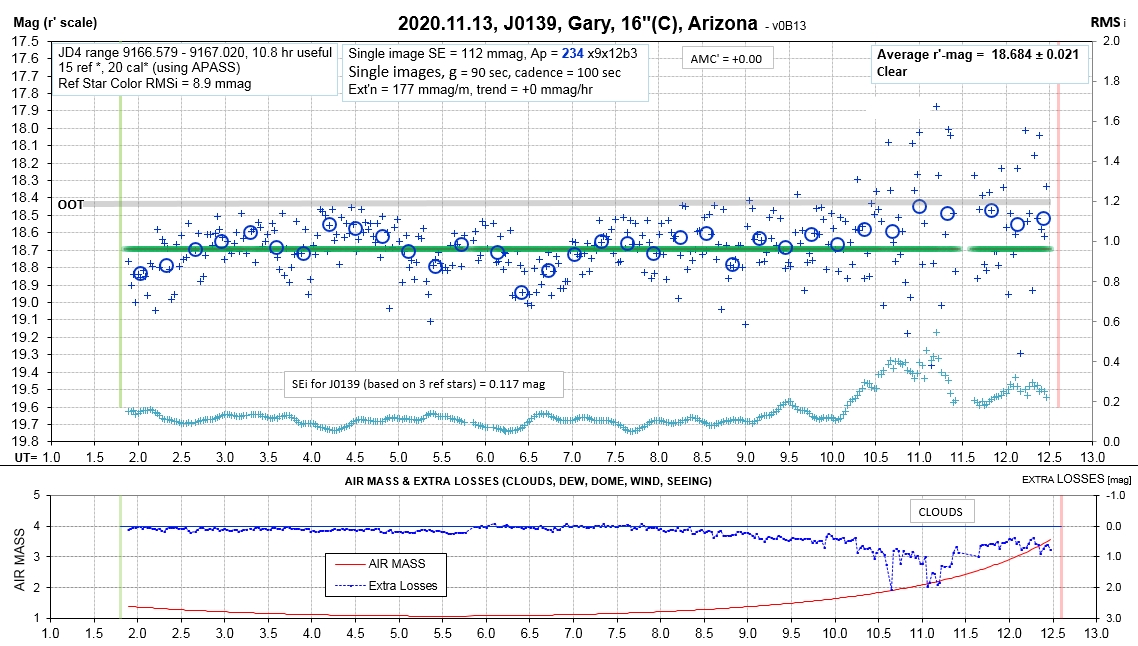
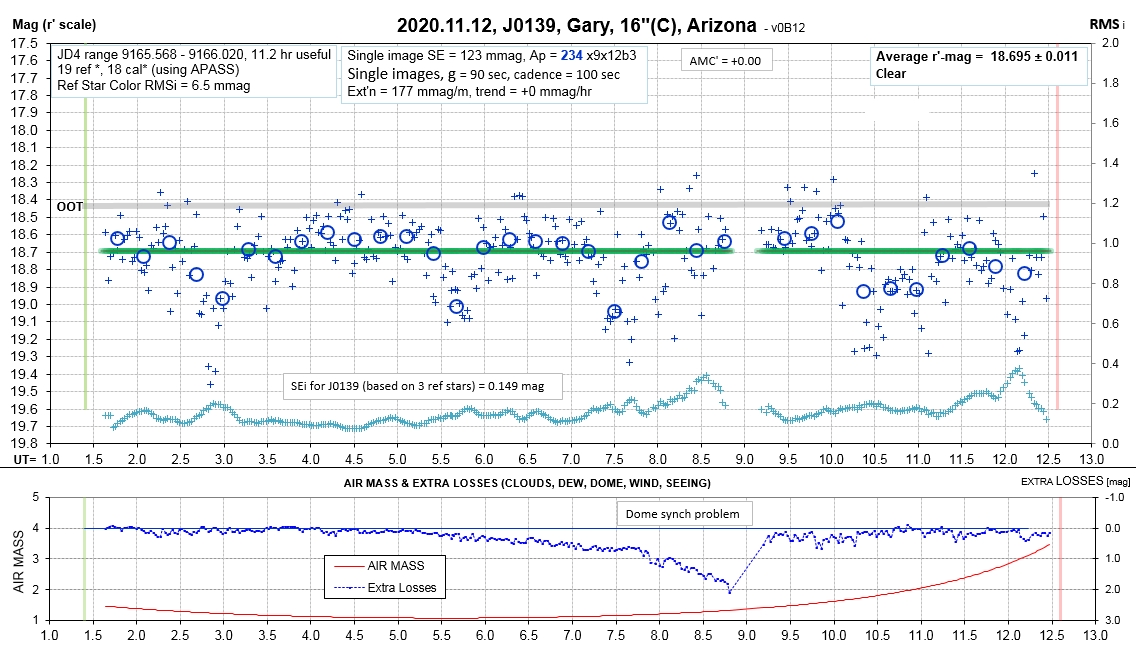
The next figure shows a week's worth of observations from which
the previous graphs were constructed:
Figure 1c. The last 5 observing dates show two dips
each, which have been identified as the "same" dust cloud
transiting 10 times with a periodicity of 4.578 hours. (See Fig.
3 for each observing session's detailed light curve.)
Why is this 4.6-hr periodicity important?
It's important because it supports the model for what's causing the episodes of fades every approximately 107.2 days. In fact, a beliver in this model could have predicted that such a short periodicity should be present. Here's the model I have in mind:
An interloper in a highly eccentric orbit with P = 107 days goes
through an asteroid belt every periastron. The asteroids are in
approximately circular orbits with P about 4 or 5 hours (just like
is present for WD1145). For most periastron passages the
interloper comes close enough to an asteroid to alter its orbit
slightly. The altered orbit causes an asteroid collision. The
collision may occur a week or two after the periastron date.
Therefore, the onset of asteroid dist clouds can start at
different intervals after the periastron date. In fact, there may
be no asteroid dust clouds produced by some periastron passages.
(These anomalous behaviors have been observed.)
The cluster of fades that usually occur at 107 day intervals may
last a week. The cluster may start with many short fades that
overlap, but after a few days the biggest fade will be seen by
itself. This is what we see in Figure 1b.
This is almost identical to a model suggested for WD1145 (WD
1145+017). The WD1145 interloper is in a 125-day orbit. Each
periastron passage for WD1145 produces a cluster of fades that
last about two months, instead of a week. The WD1145 model is
described in more detail at http://www.brucegary.net/kick/
It is gratifying that one model may be compatible with both
well-studied WDs that have transiting dust clouds.

2025 Fall
2025.10.22
2025.10.21
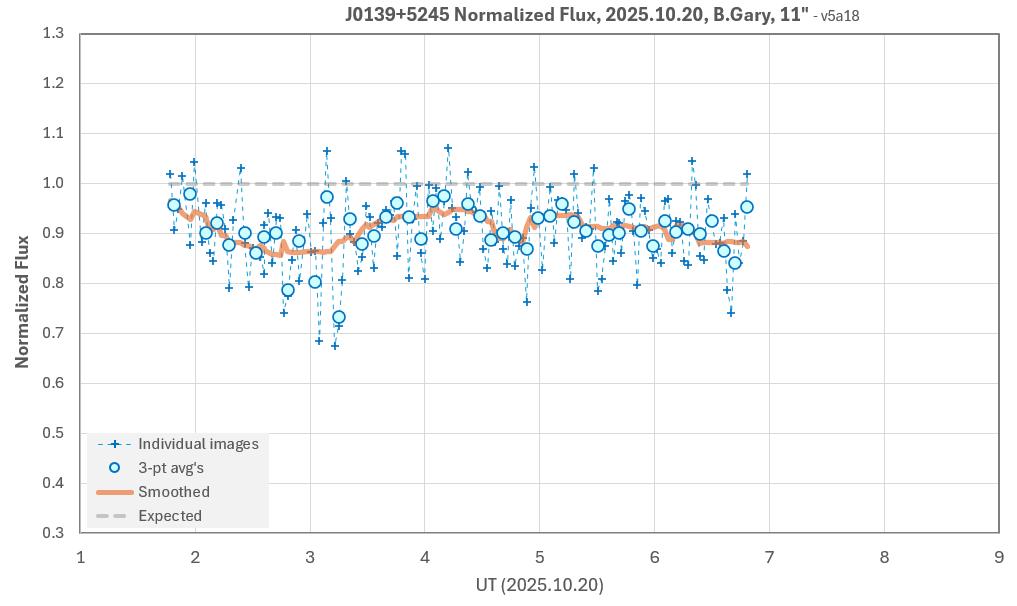
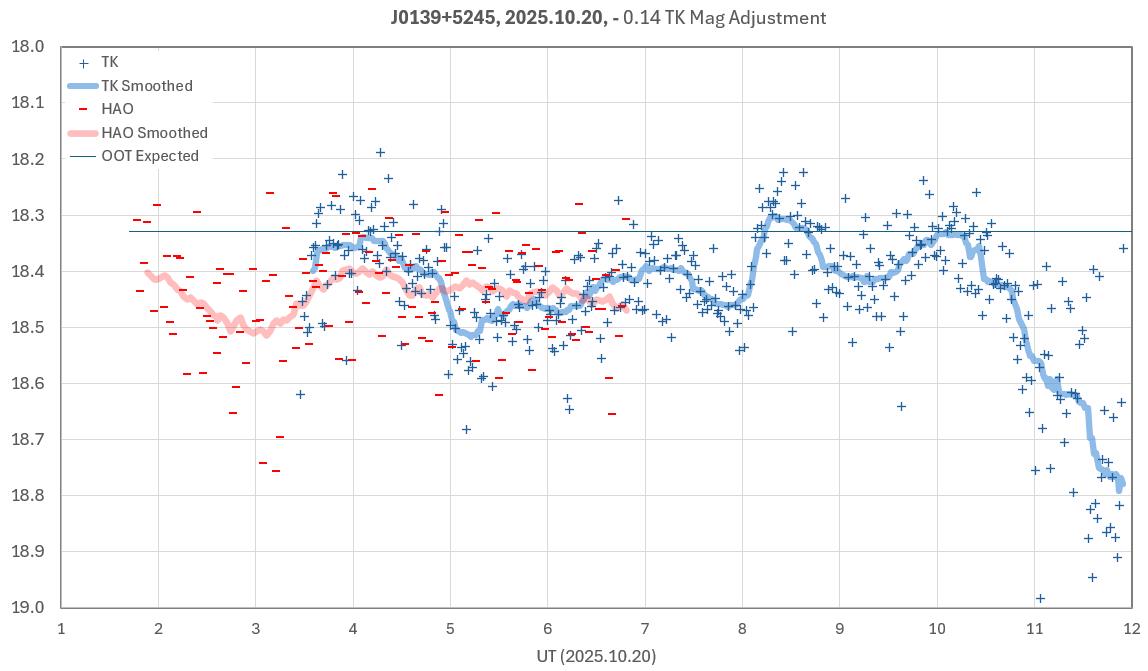
2025.10.20
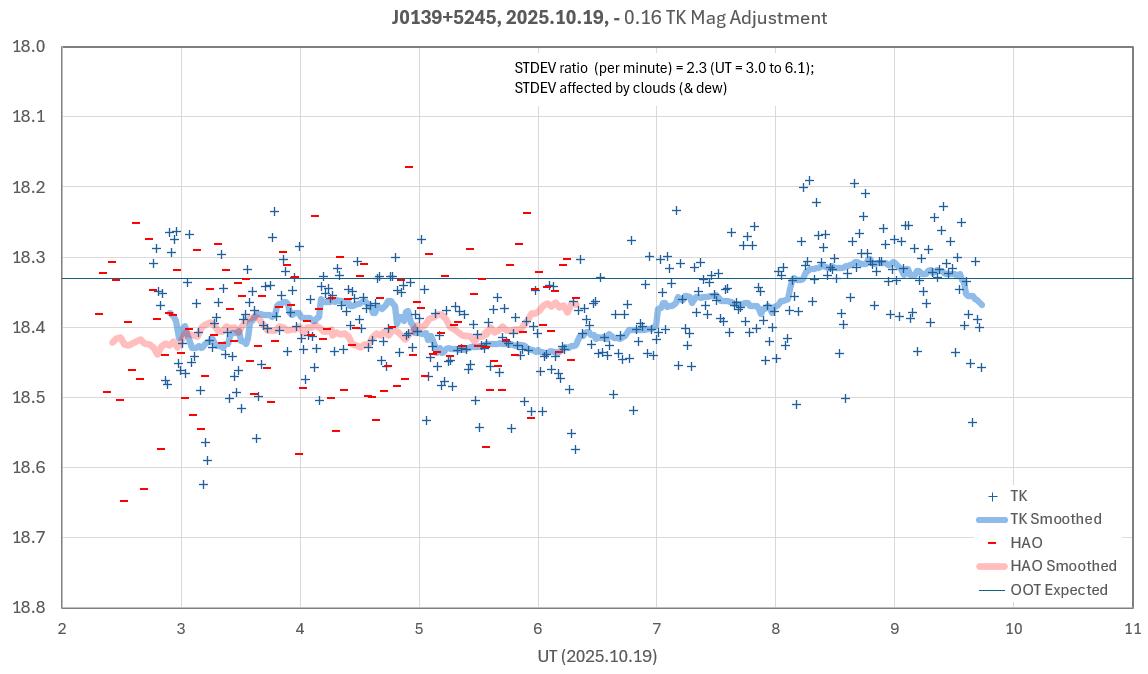
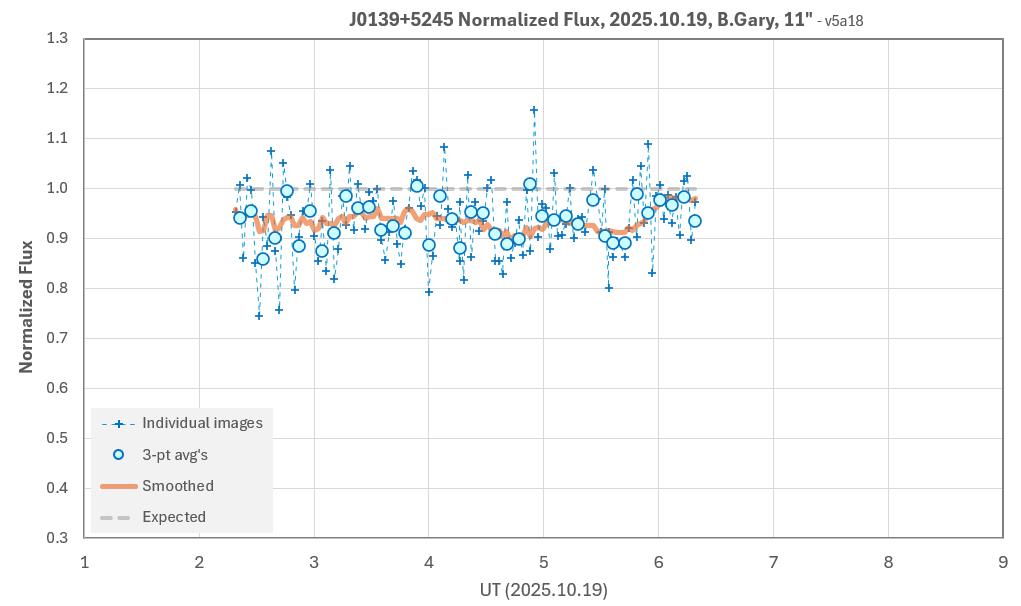
2025.10.19
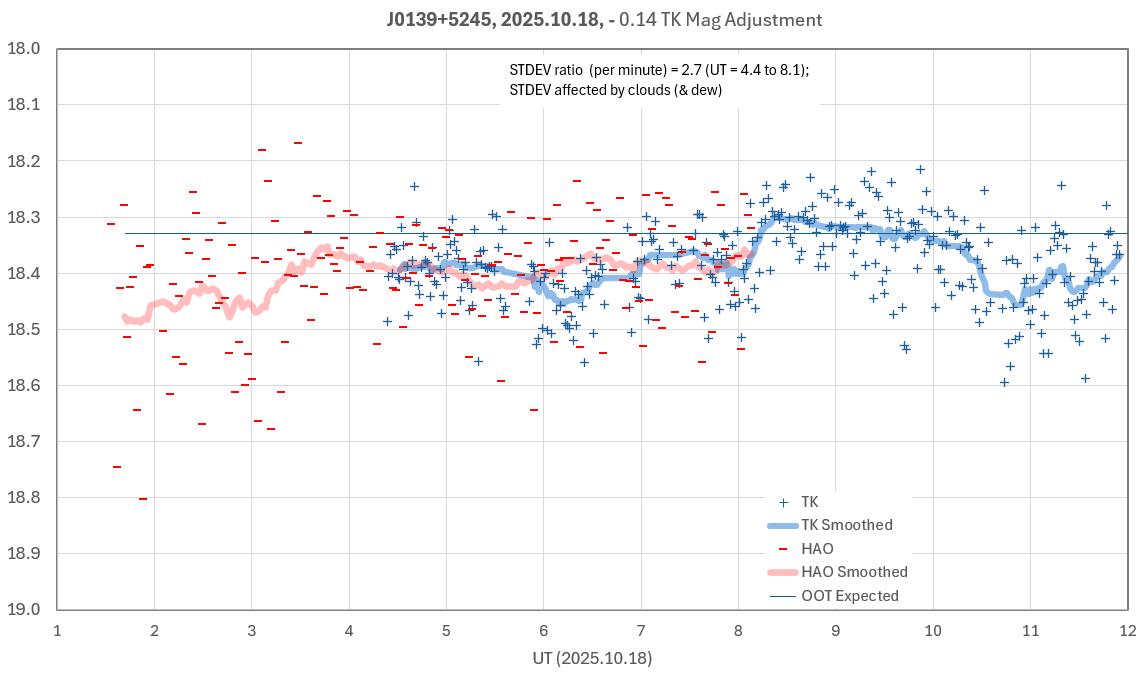
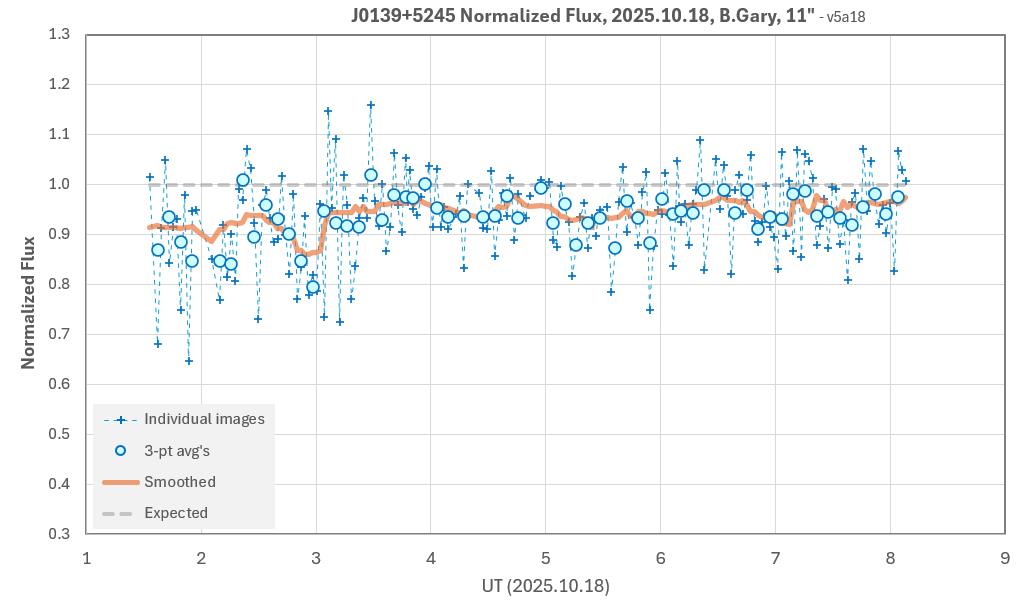
2025.10.18
2025.10.17
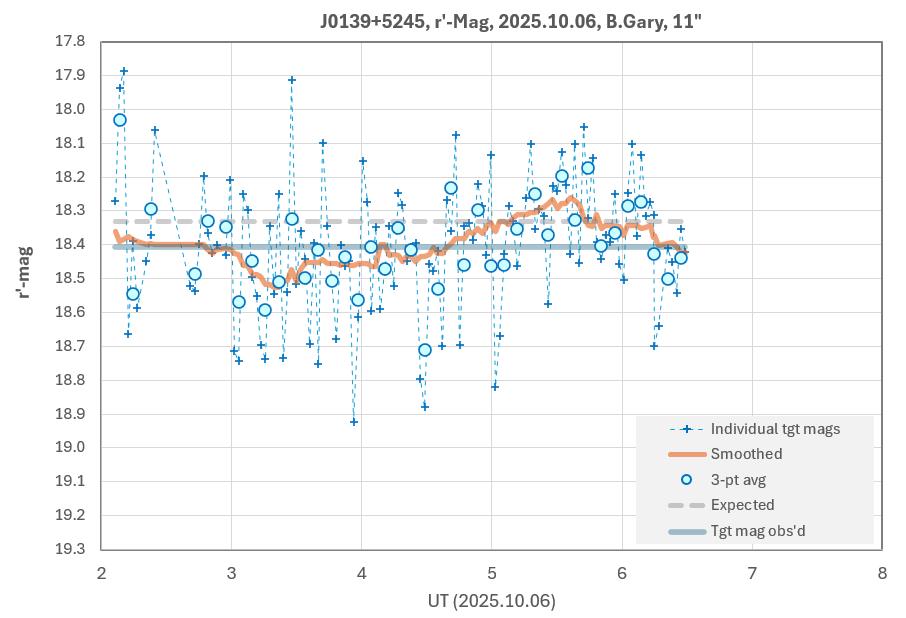
2025.10.06
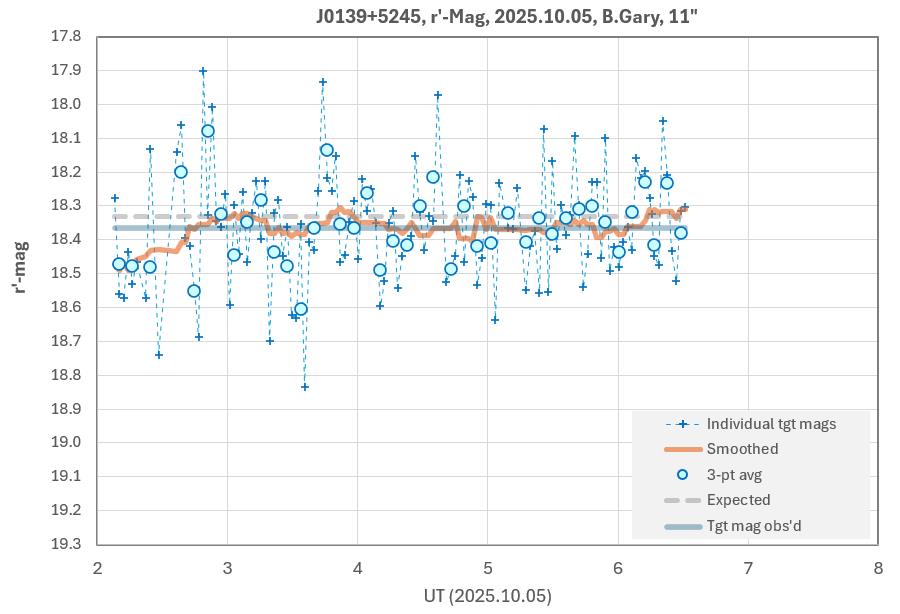
2025.10.05
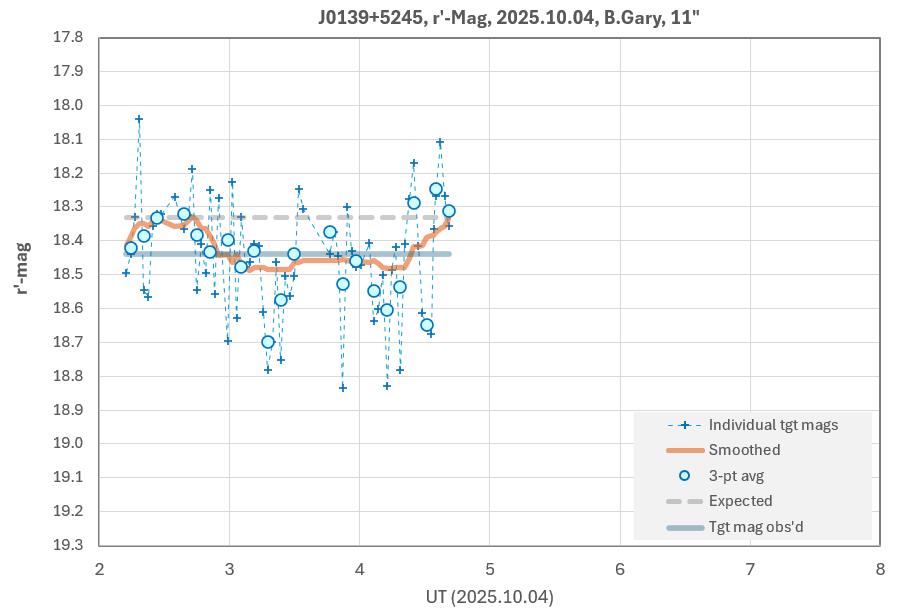
2025.10.04
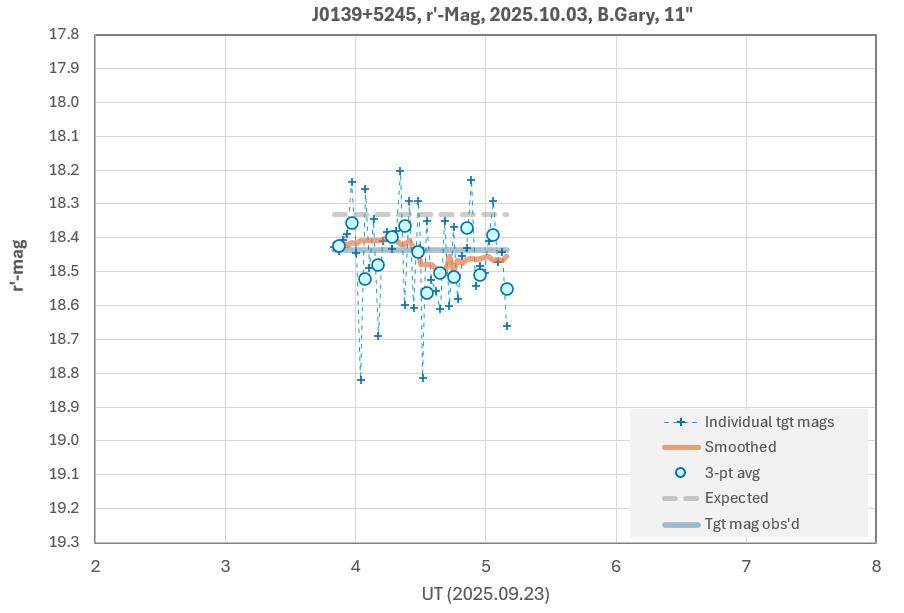
2025.10.03
2025.10.02
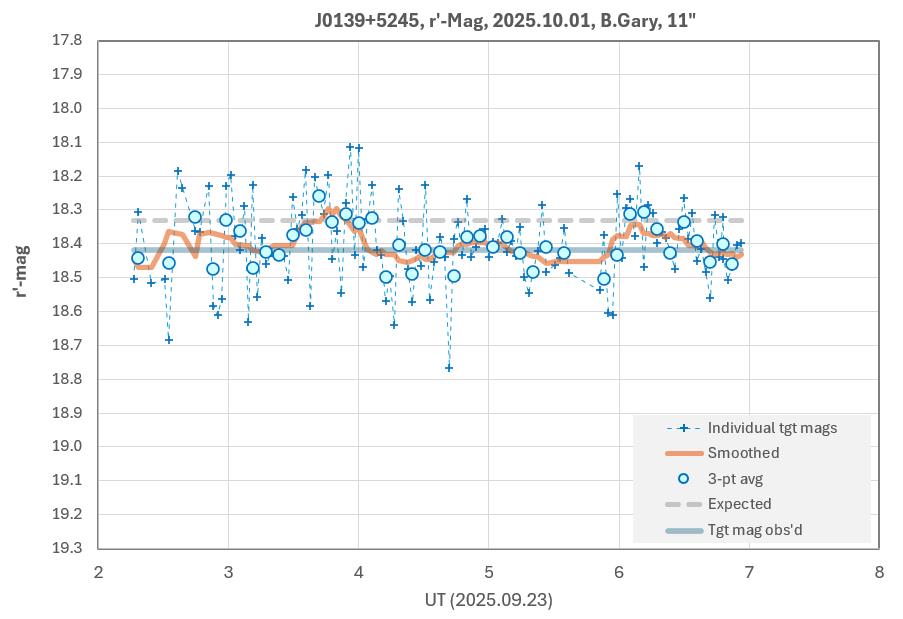
2025.10.01
2025.09.30
2025.09.29
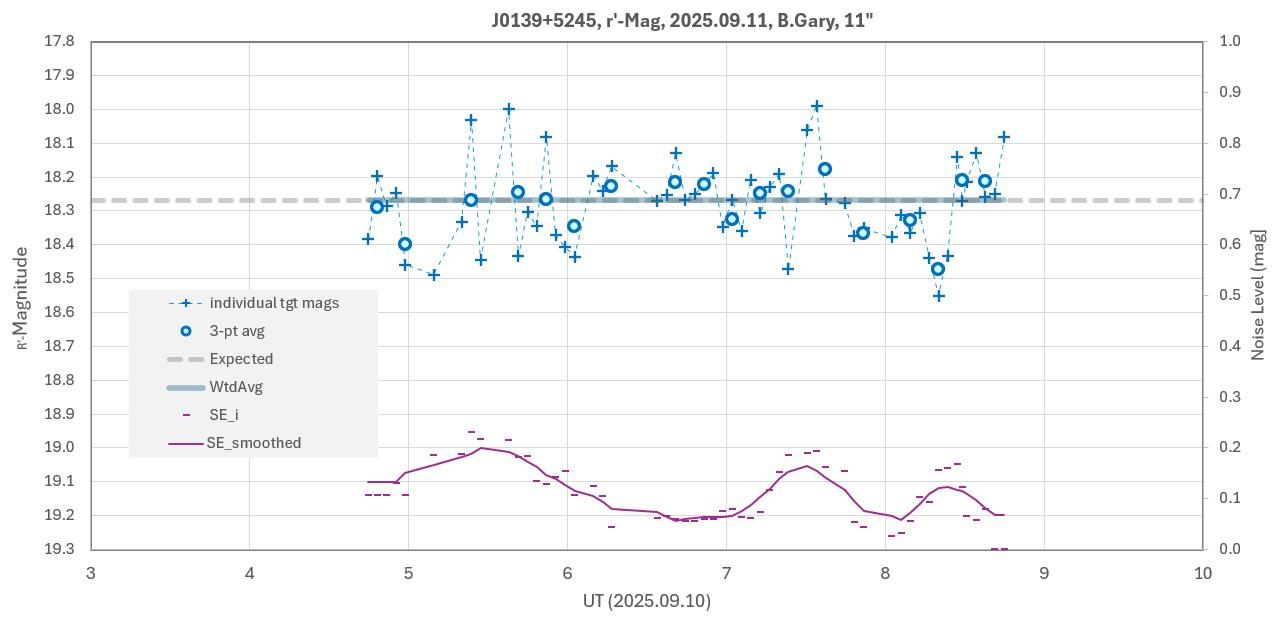
2025.09.11
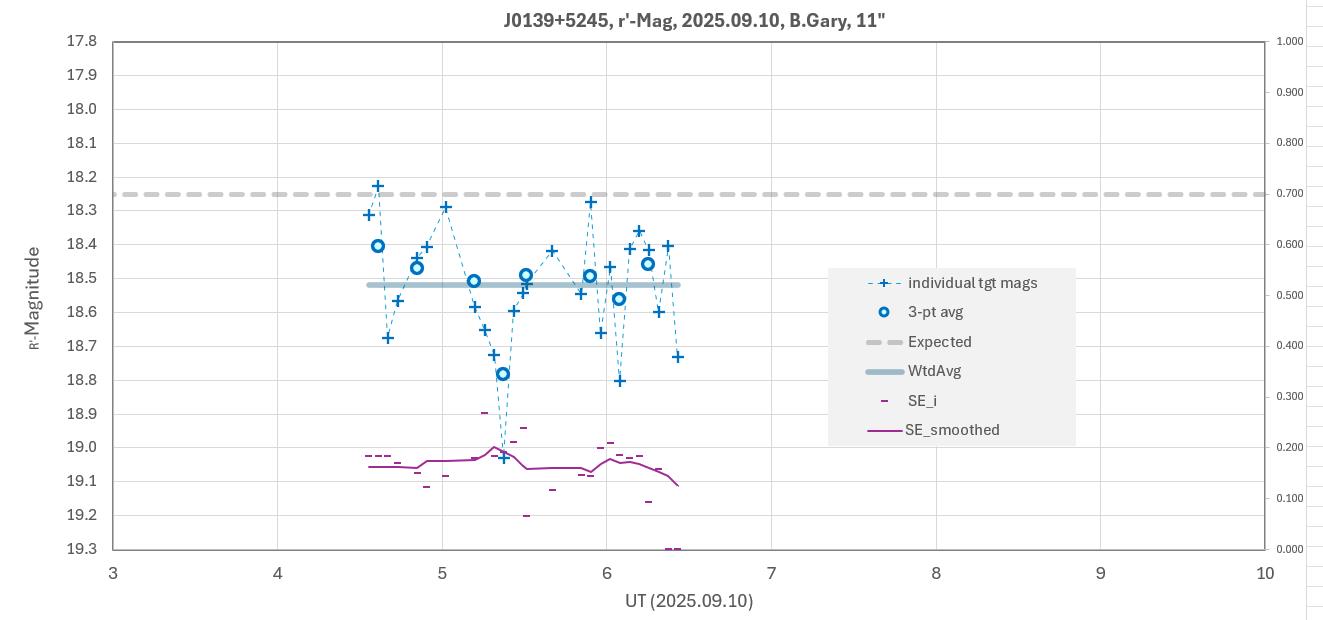
2025.09.10
2025.09.08
2025.08.24
2025.08.22
2020 Fall
2020.12.20
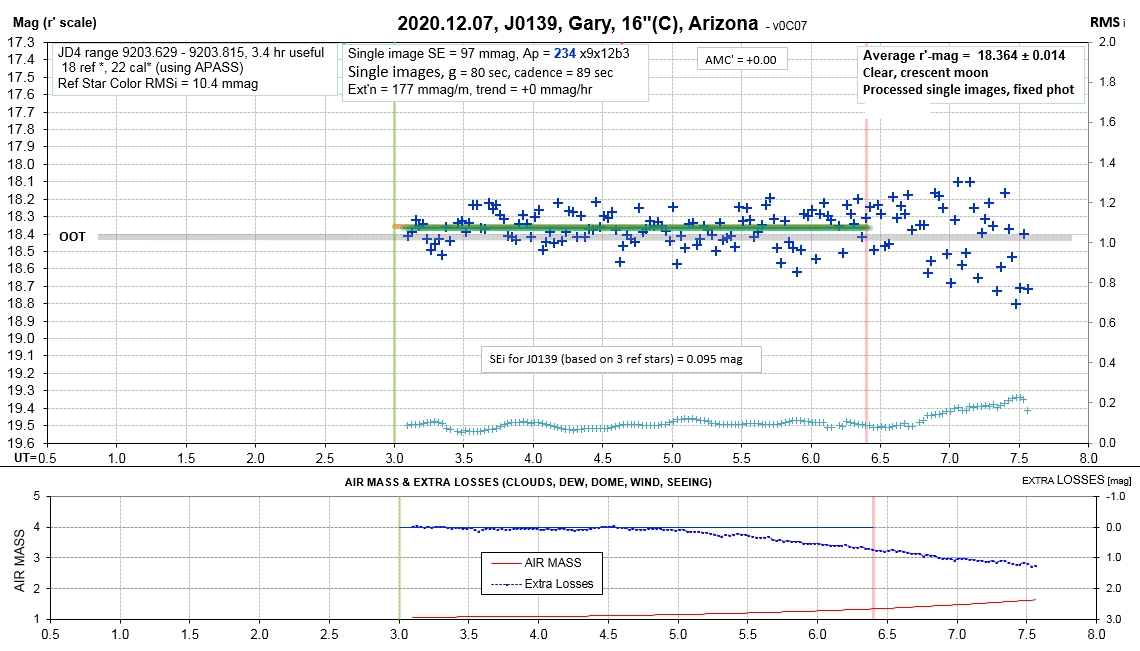
2020.12.07
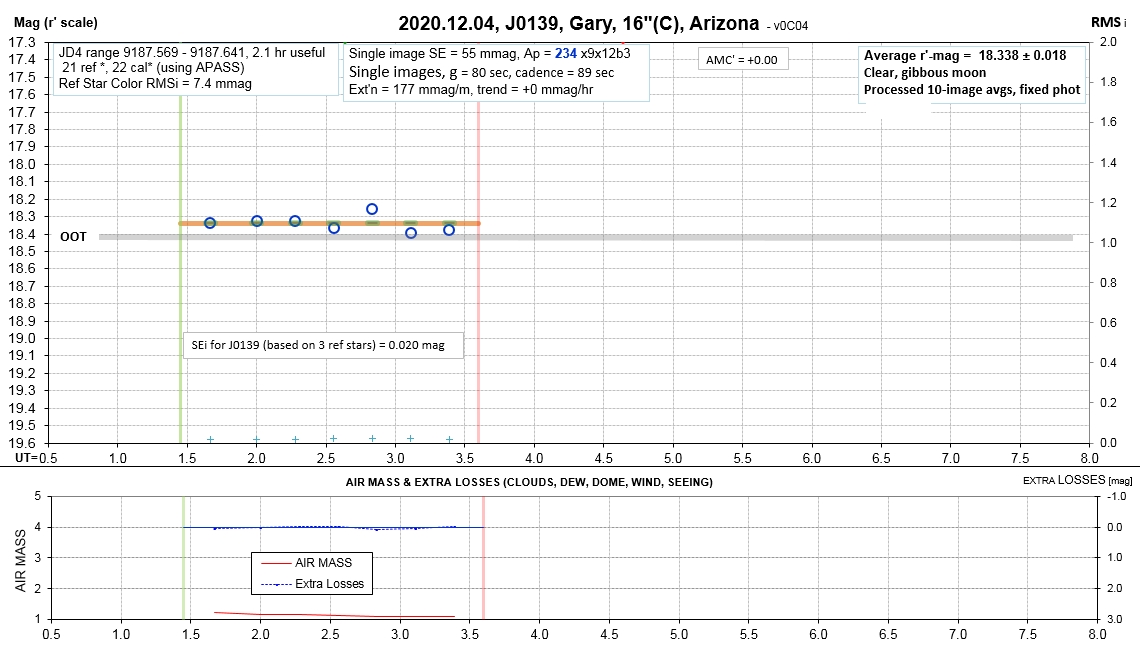
2020.12.04
2020.12.02
2020.12.01
2020.11.30
2020.11.29
2020.11.28
2020.11.27
2020.11.26
2020.11.25
2020.11.23
2020.11.20
2020.11.17
2020.11.16
2020.11.15
2020.11.14
2020.11.13
2020.11.12
2020.11.11
2020.11.10
2020.11.05
2020.11.01
2020.10.28
2020.10.24
2020.10.22
2020.10.19
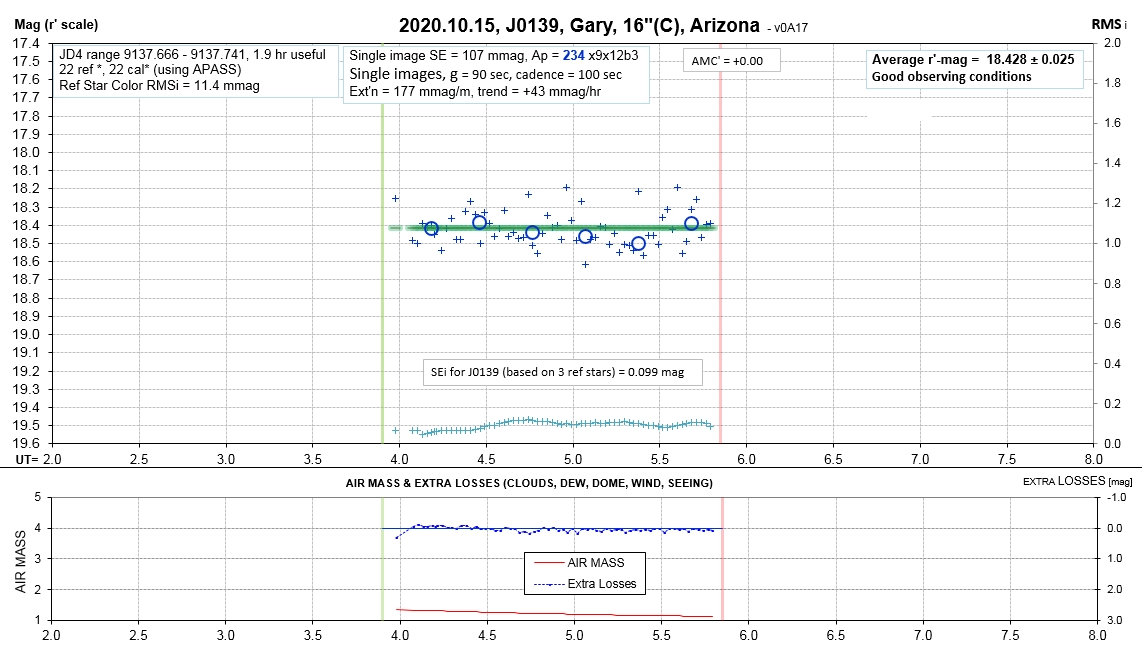
2020.10.15
2020.10.12
2020.10.06
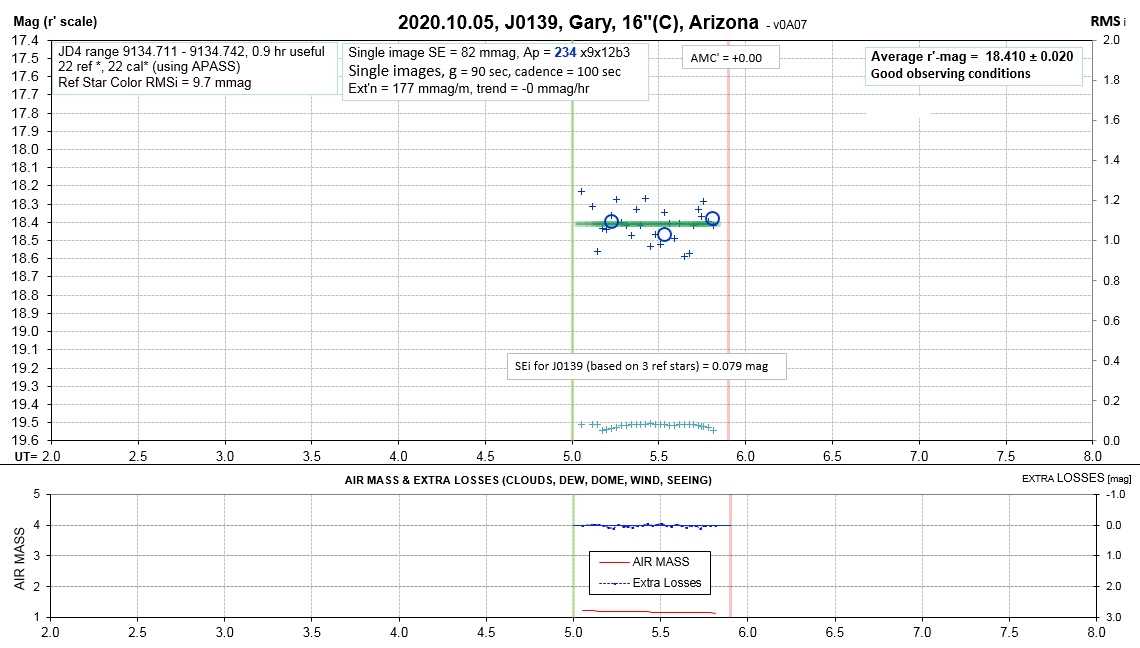
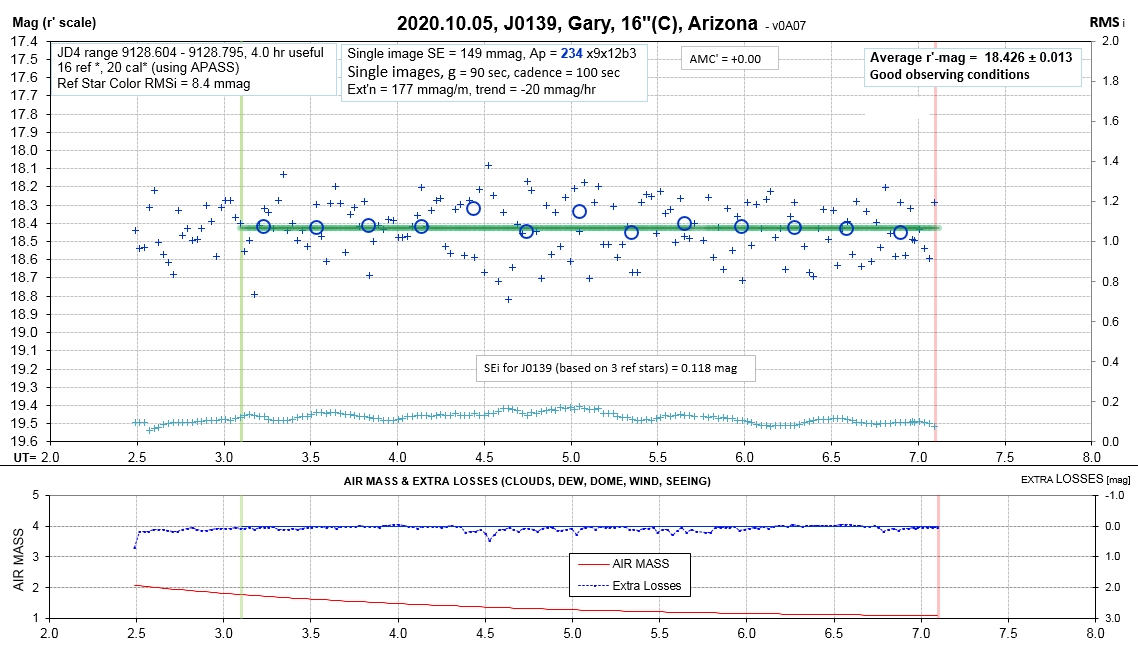
2020.10.05
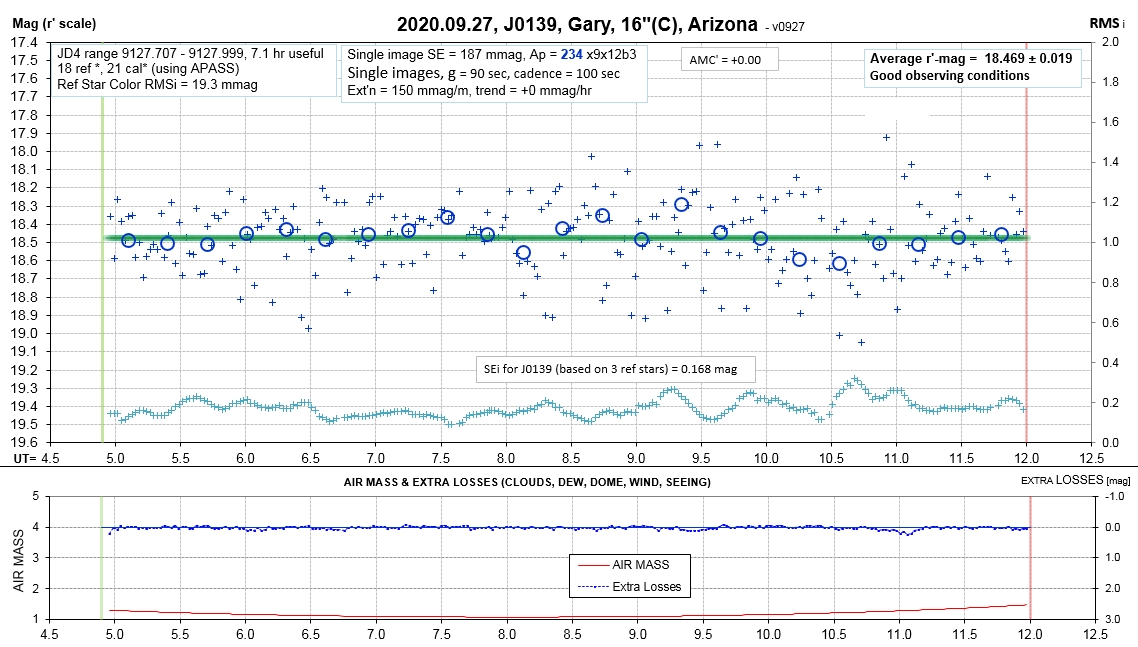
2020.09.27
2020.09.24
2020.09.20
2020.09.17
2020.09.16
2020.09.15
2020.09.11
2020.09.10
2020.09.08
2020.09.06
2020.09.05
2020.08.25
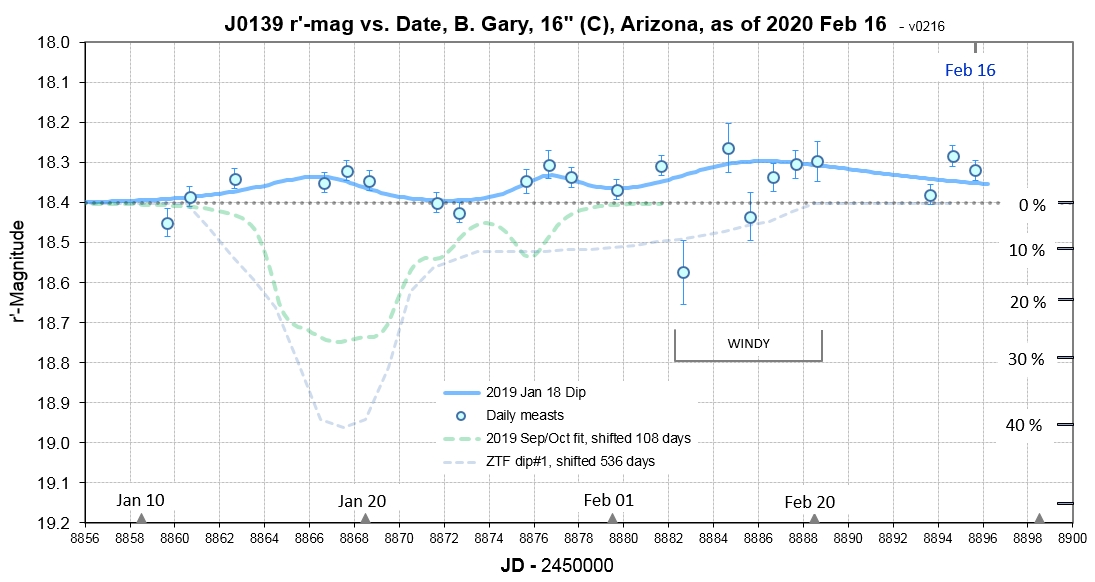
2020 Winter Dip (due 2020 Jan 18)
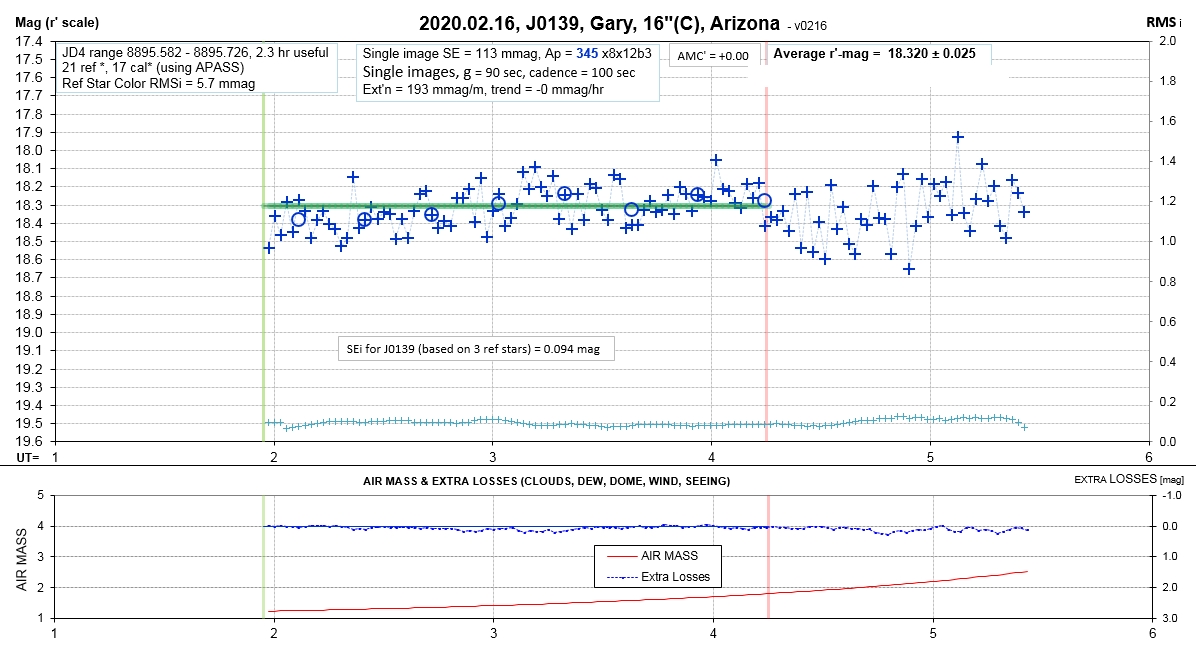
2020.02.16
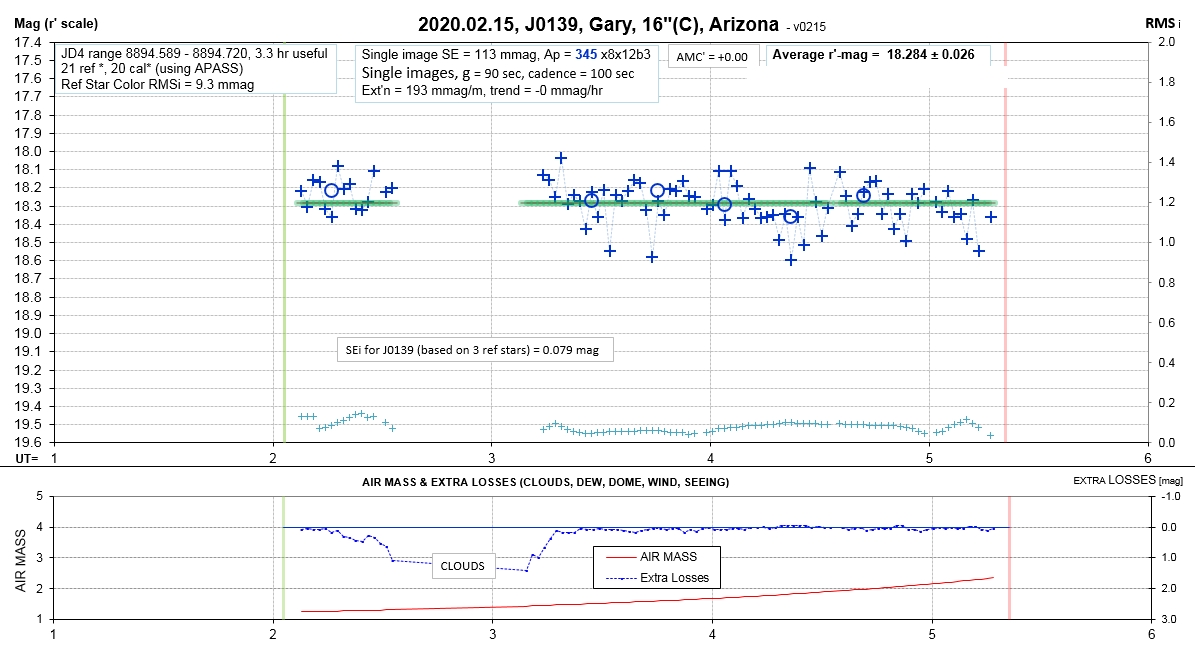
2020.02.15
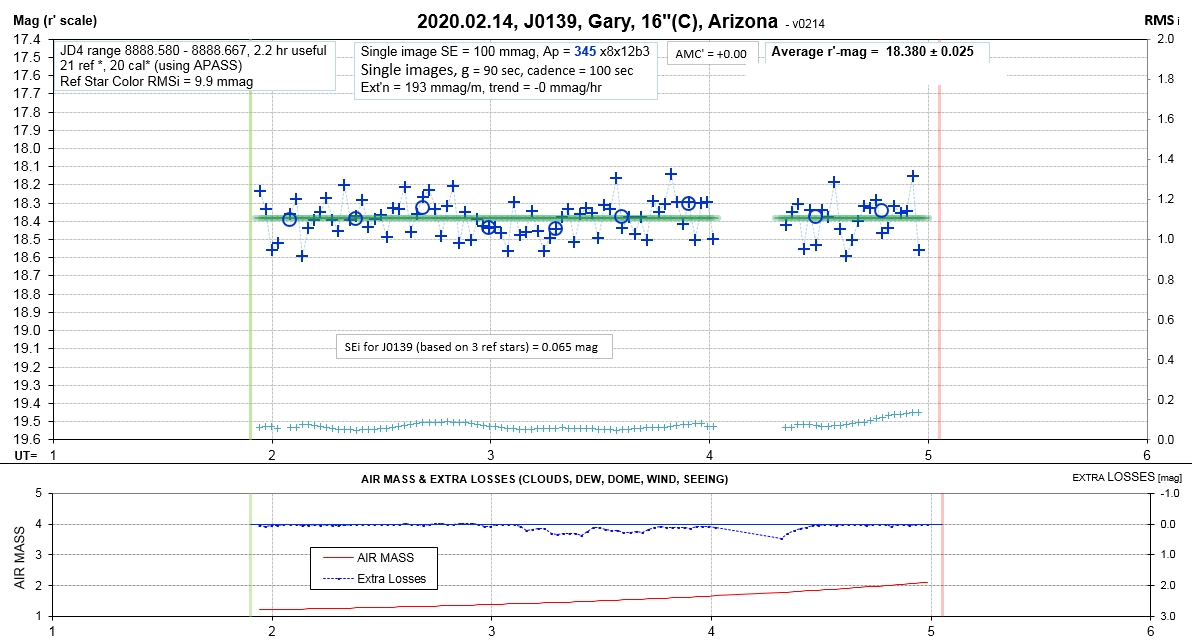
2020.02.14
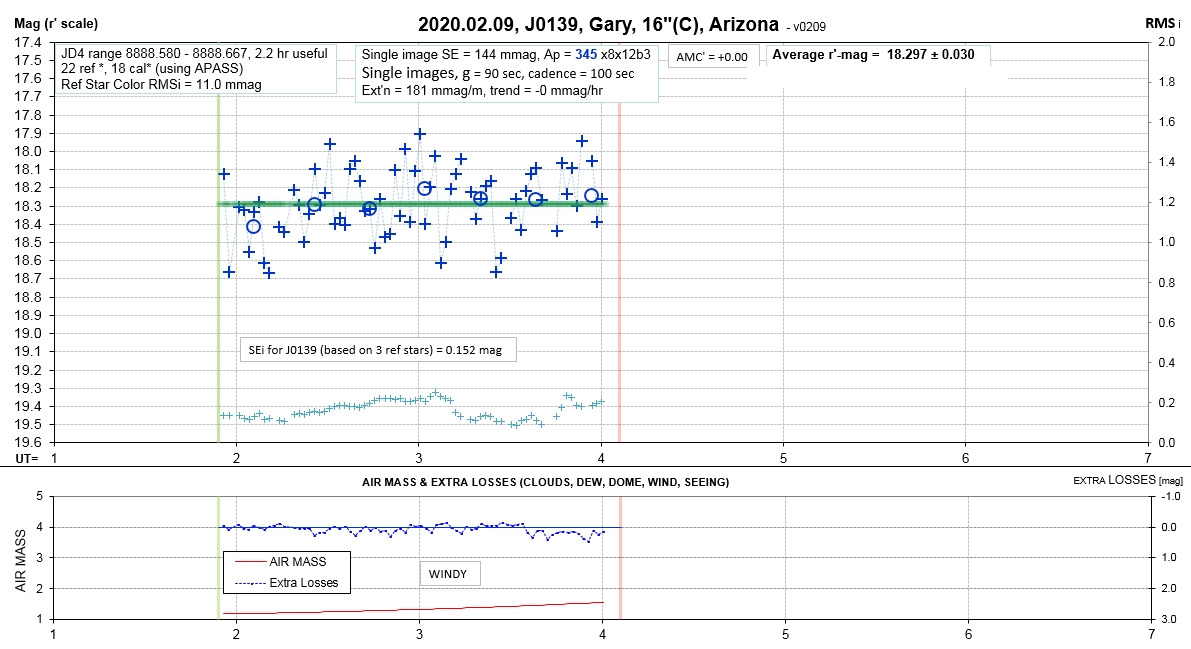
2020.02.09
2020.02.08
2020.02.07
2020.02.06
2020.02.05
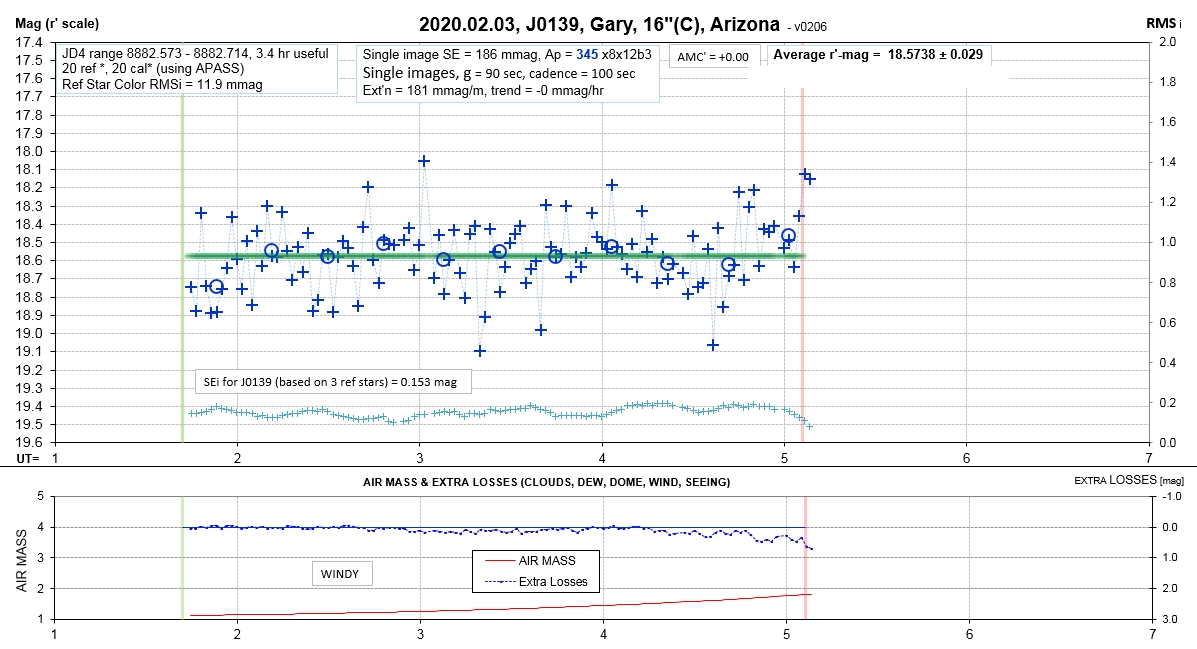
2020.02.03
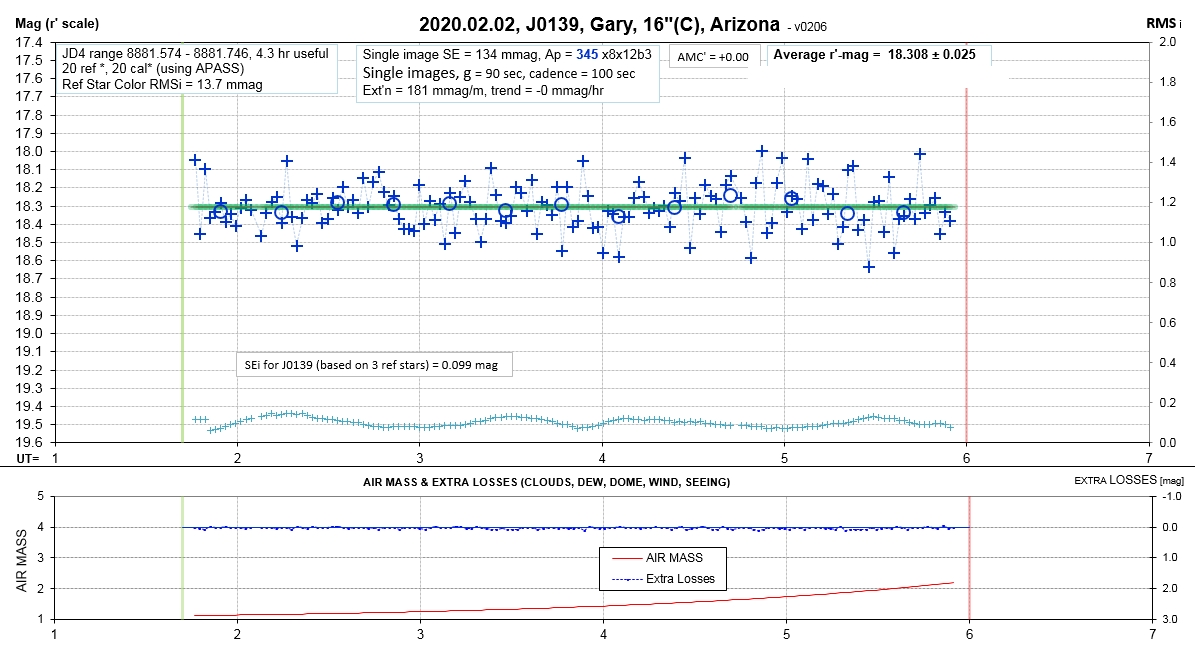
2020.02.02
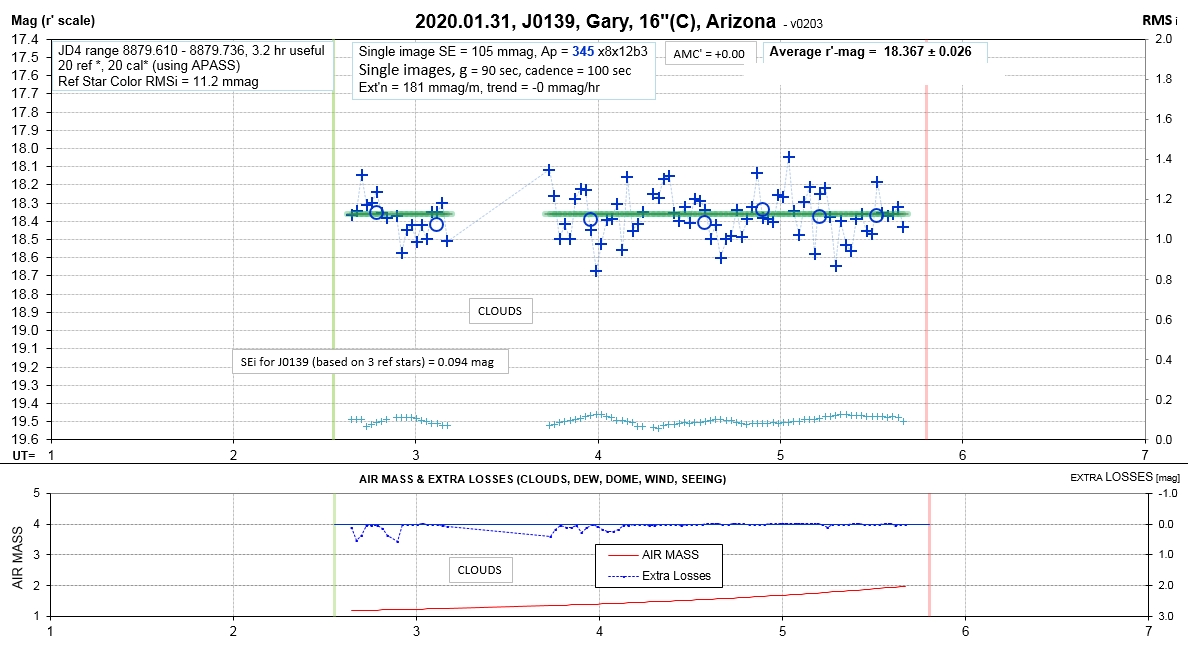
2020.01.31
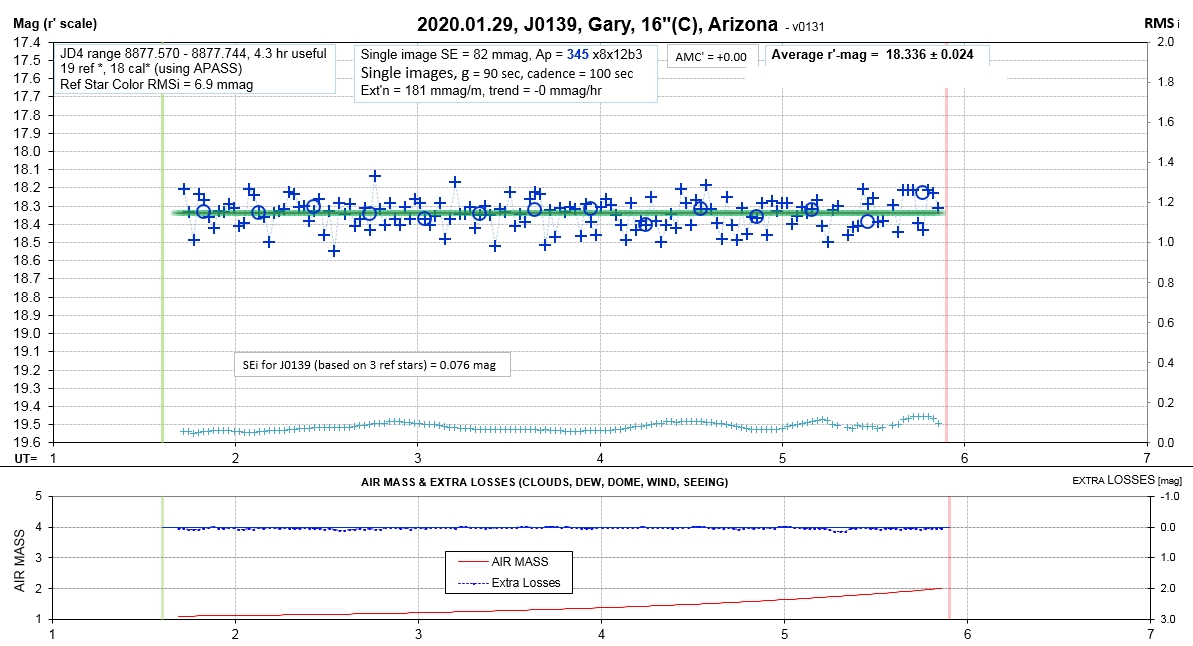
2020.01.29
2020.01.28
2020.01.27
2020.01.24
2020.01.23
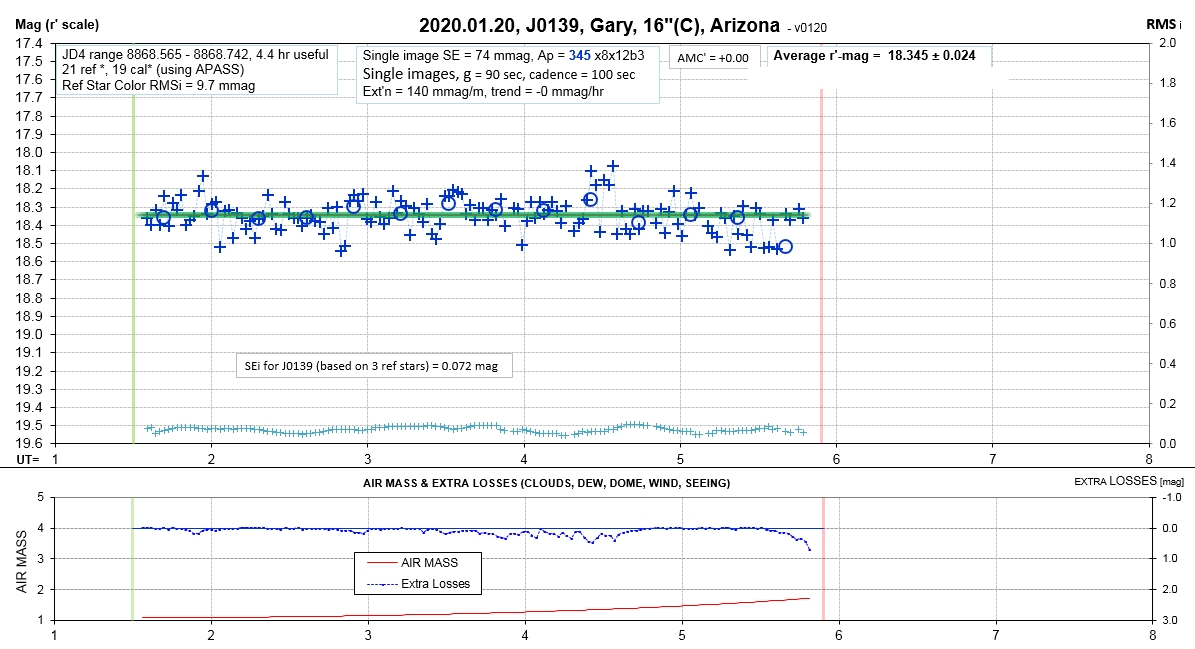
2020.01.20
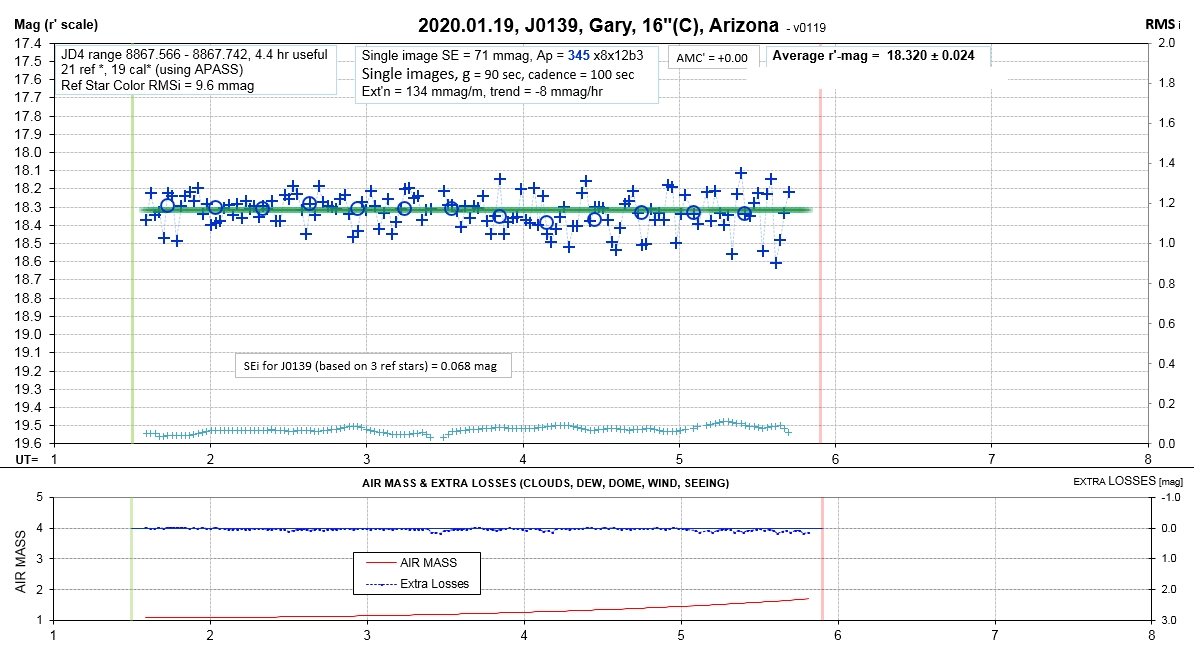
2020.01.19
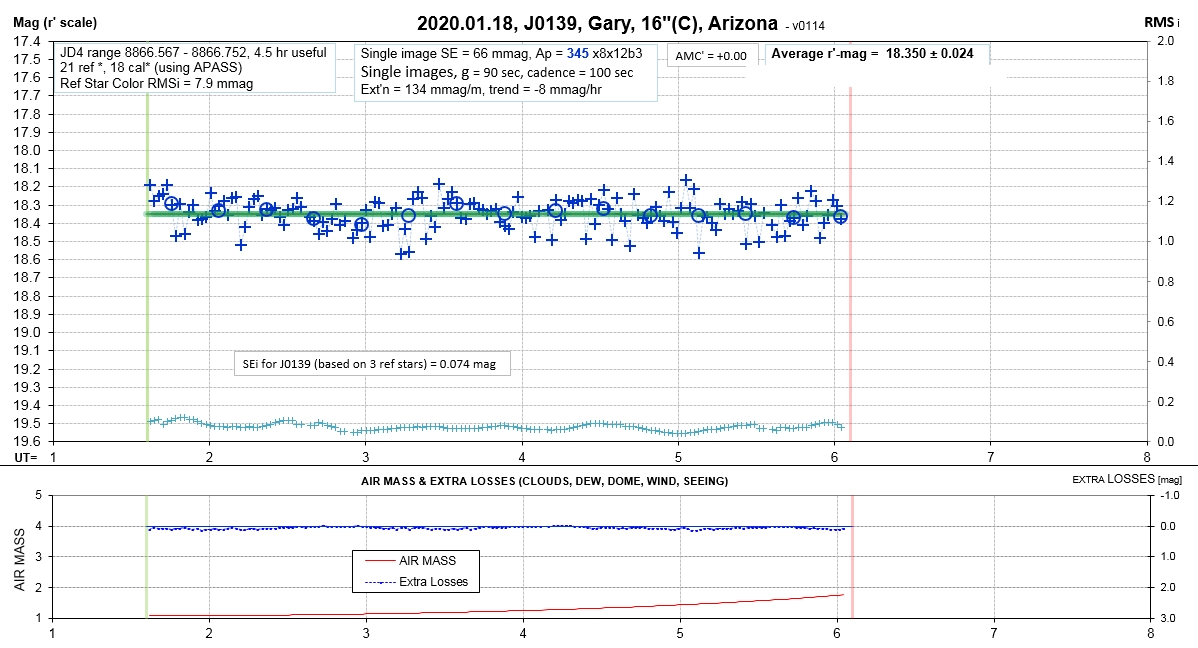
2020.01.18
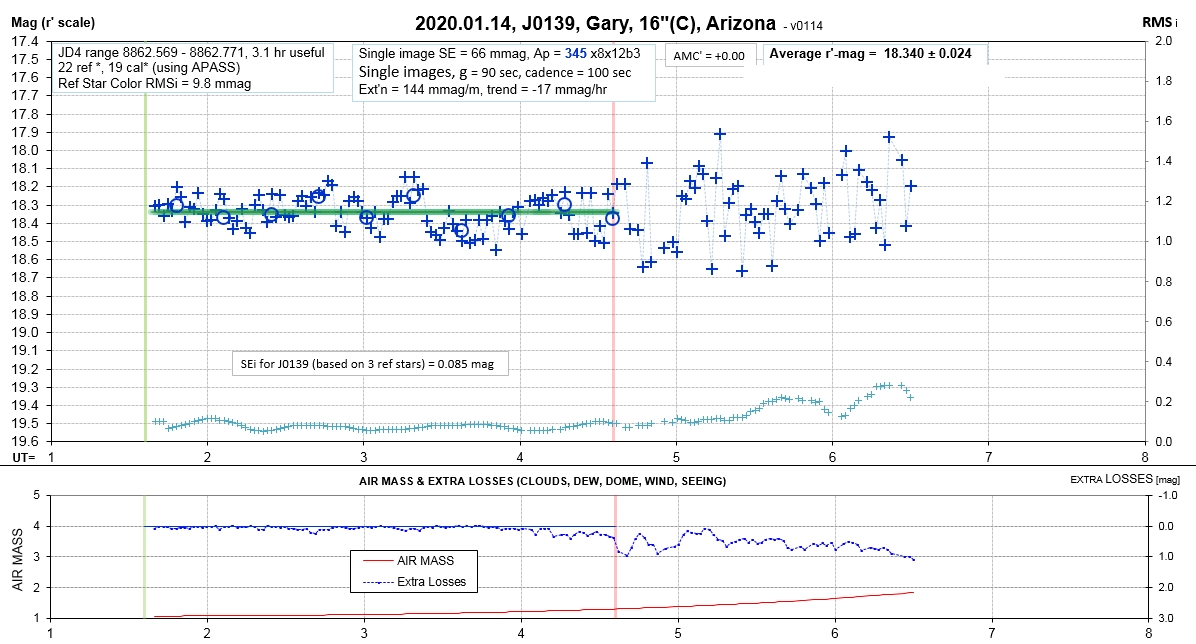
2020.01.14
2020.01.12
2020.01.11
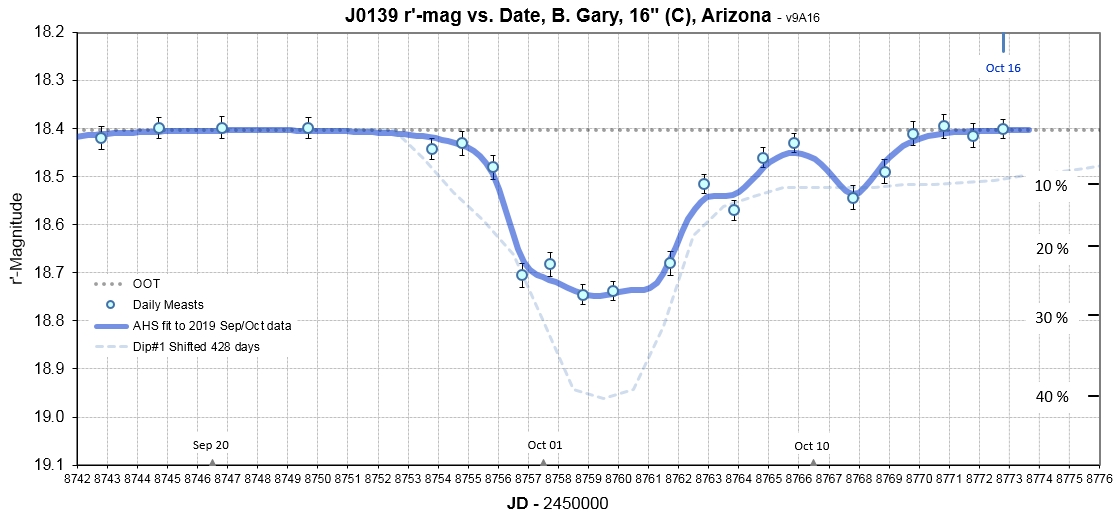
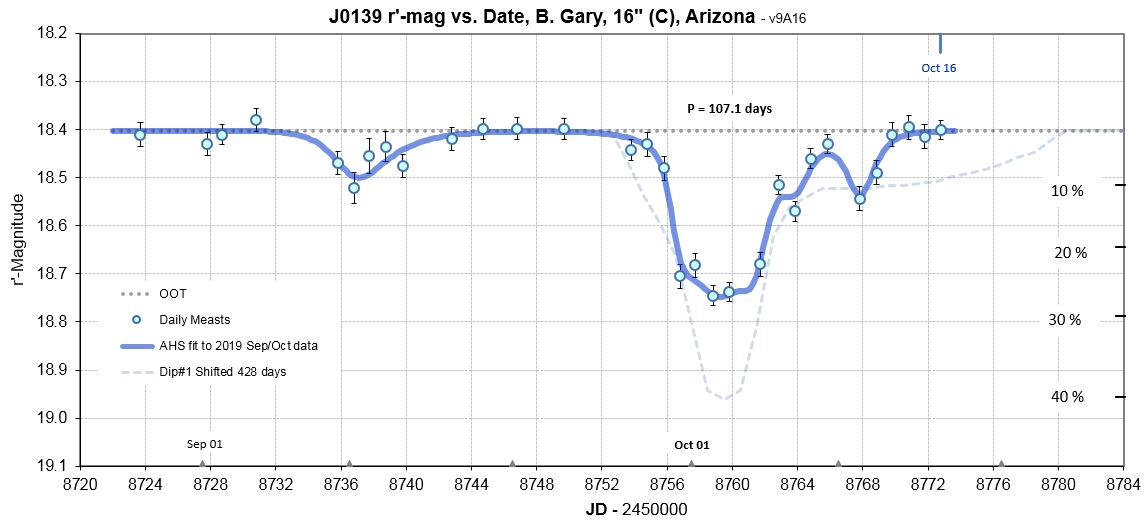
2019 Fall Dip
2019.10.16
2019.10.15
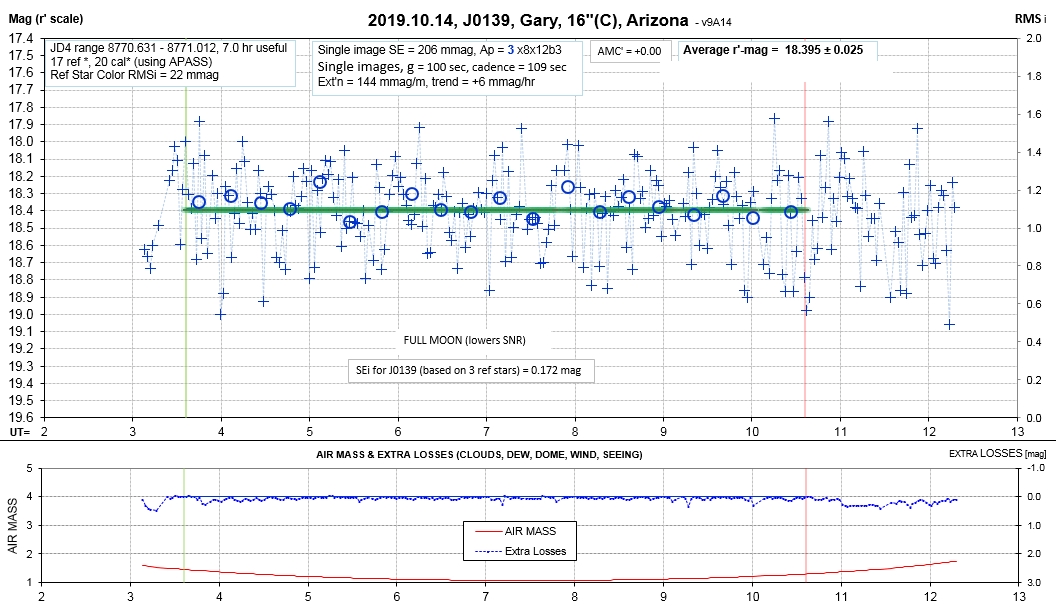
2019.10.14
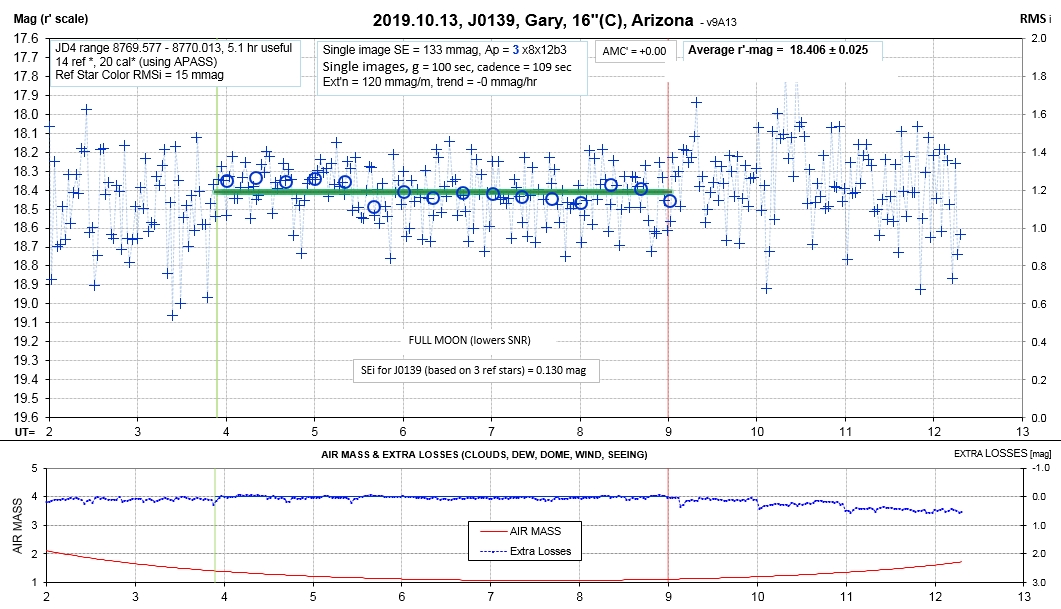
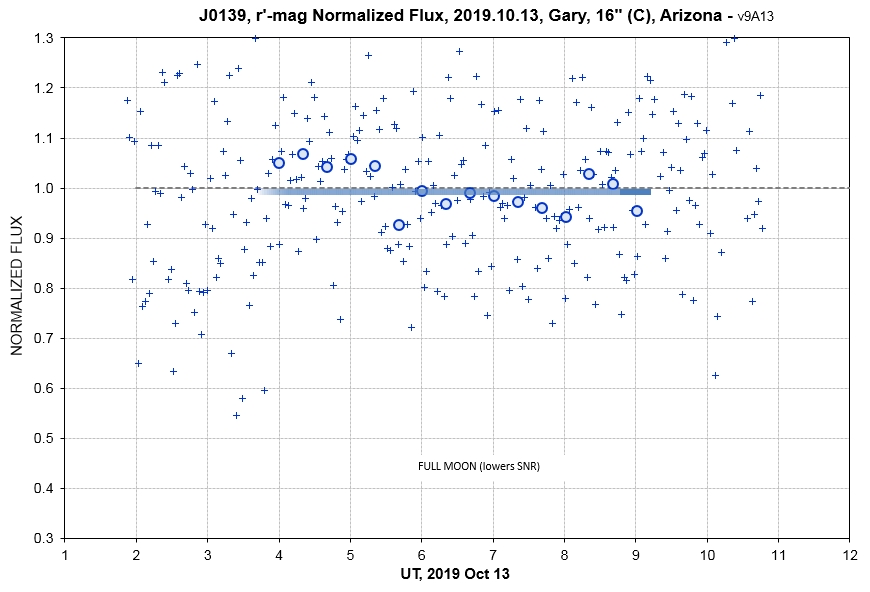
2019.10.13
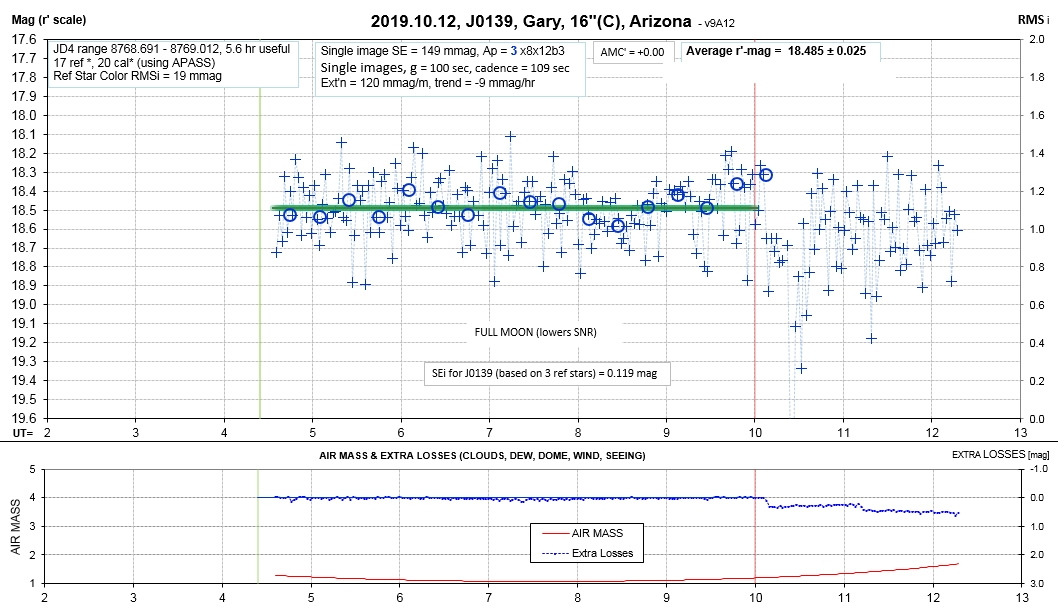
2019.10.12
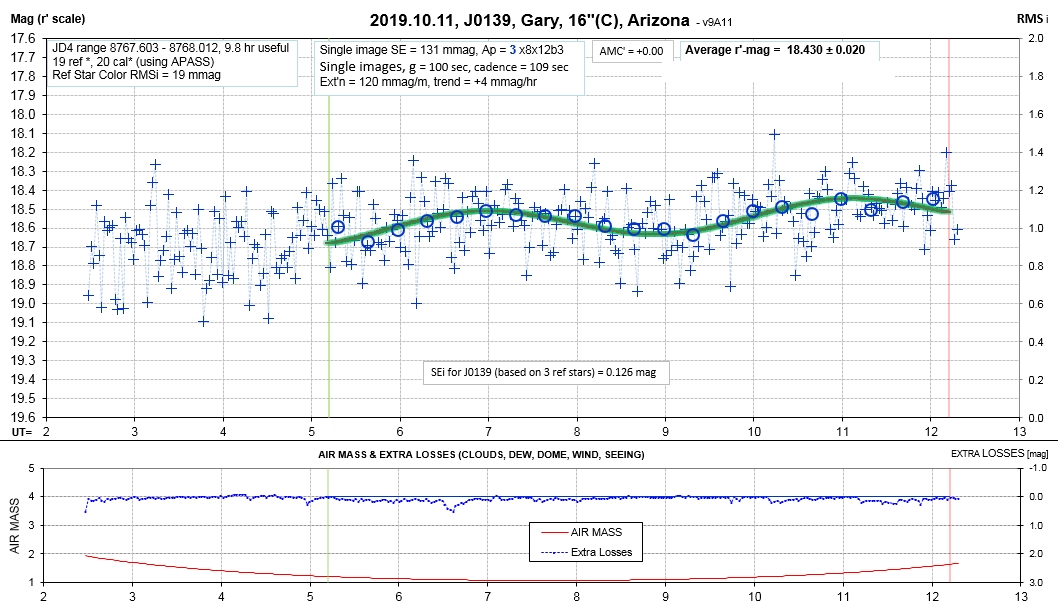
2019.10.11
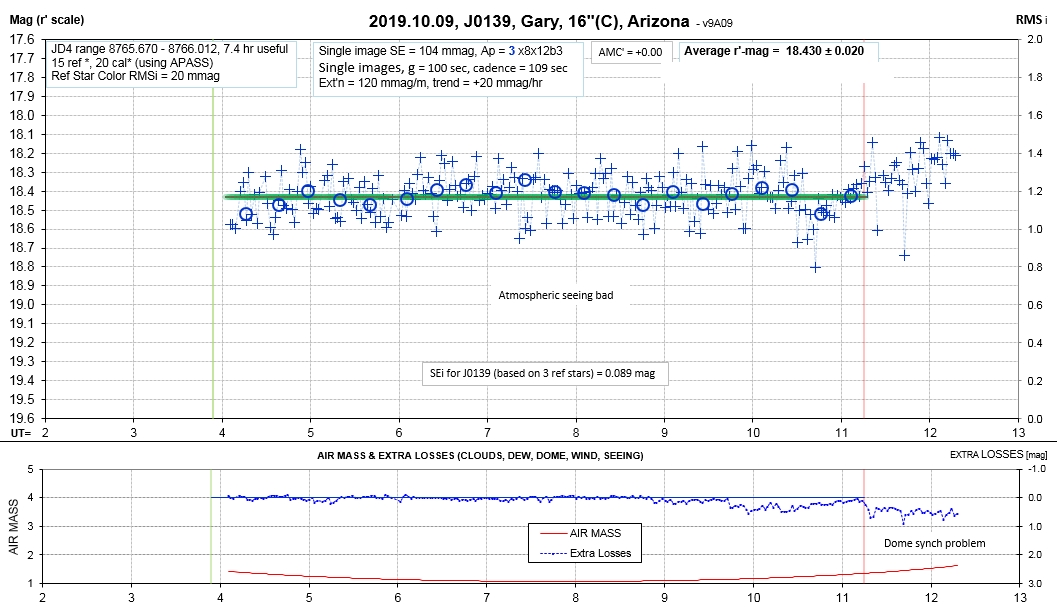
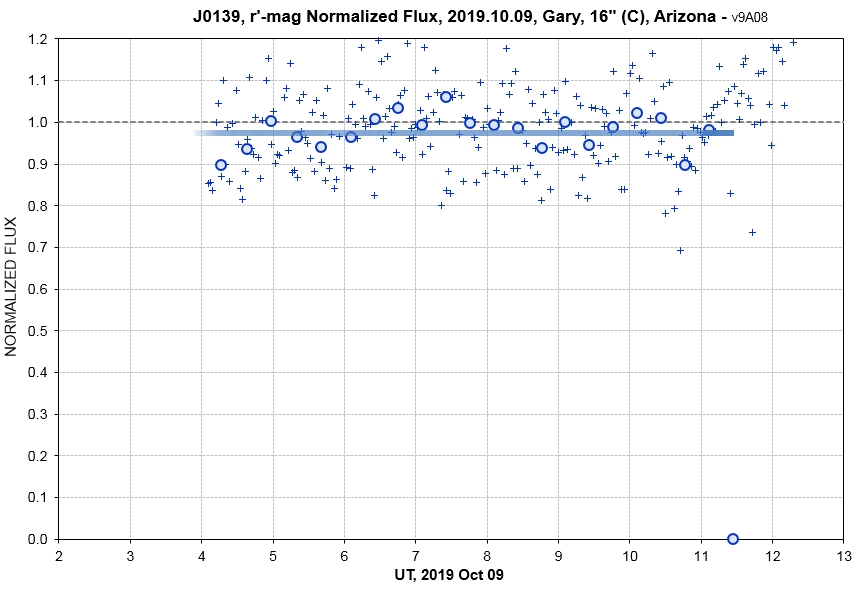
2019.10.09
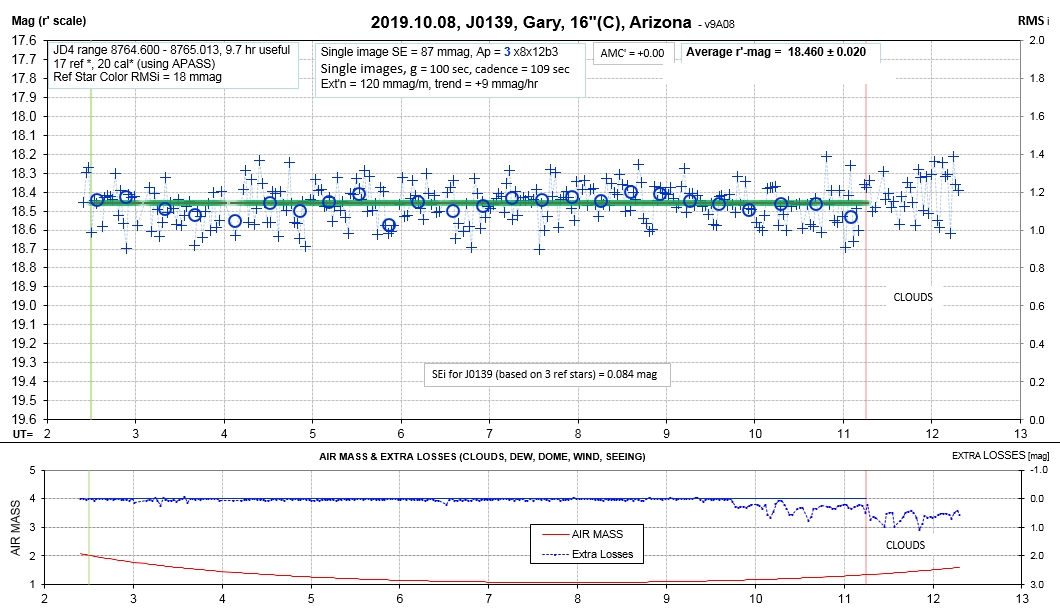
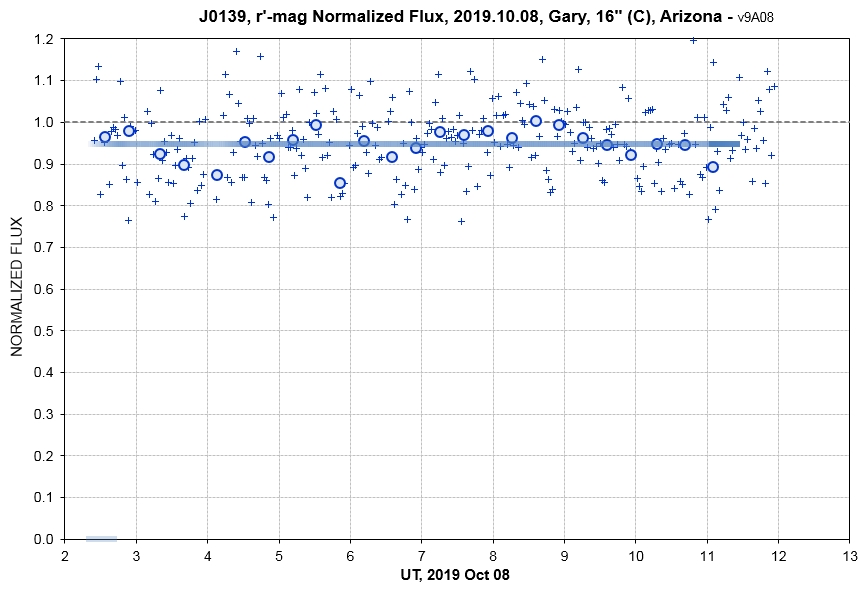
2019.10.08
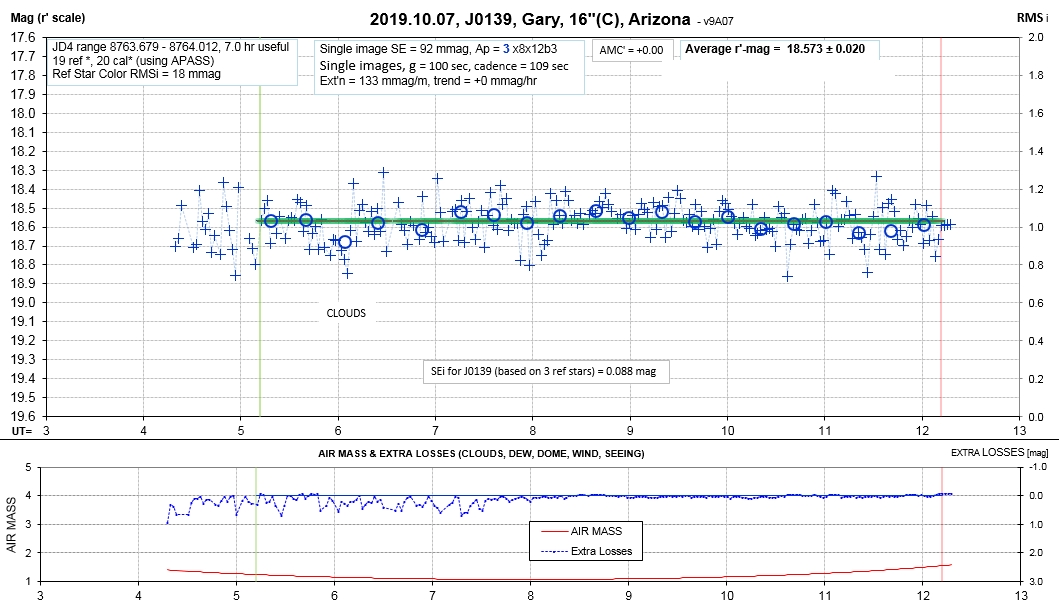
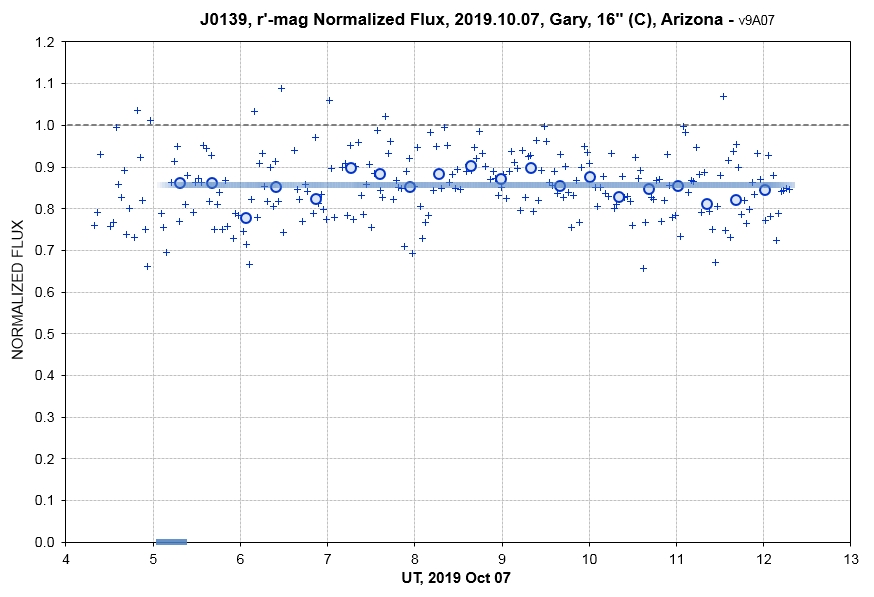
2019.10.07
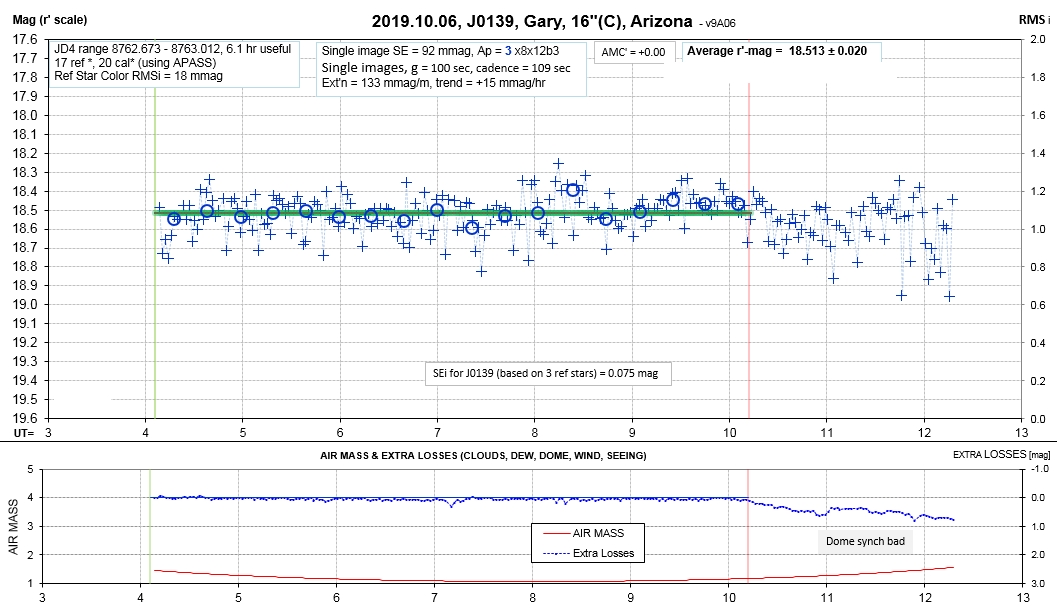
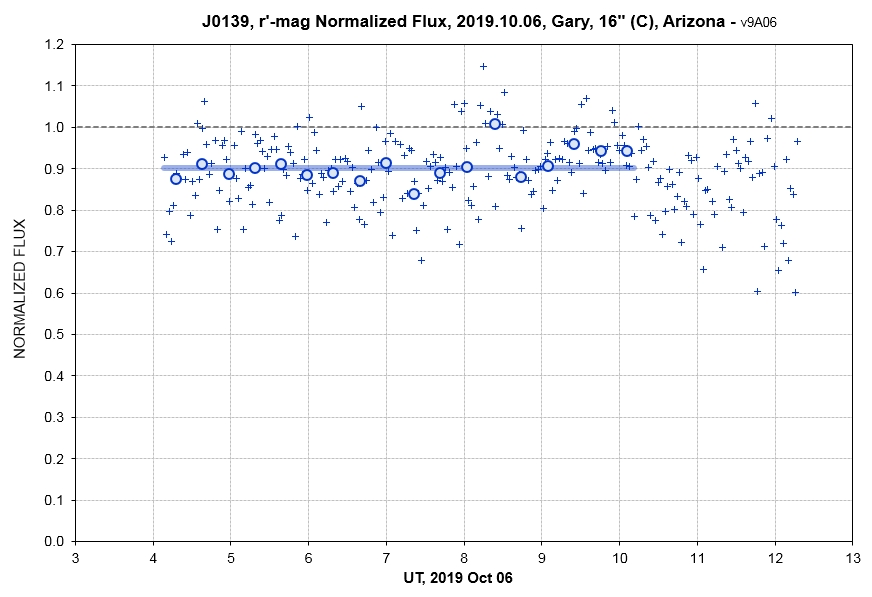
2019.10.06
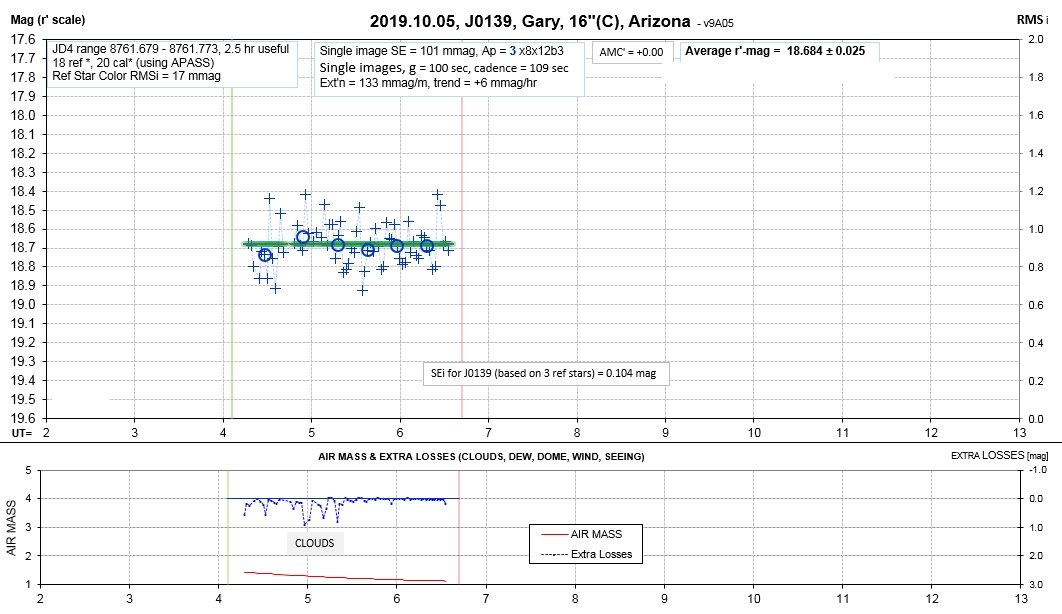
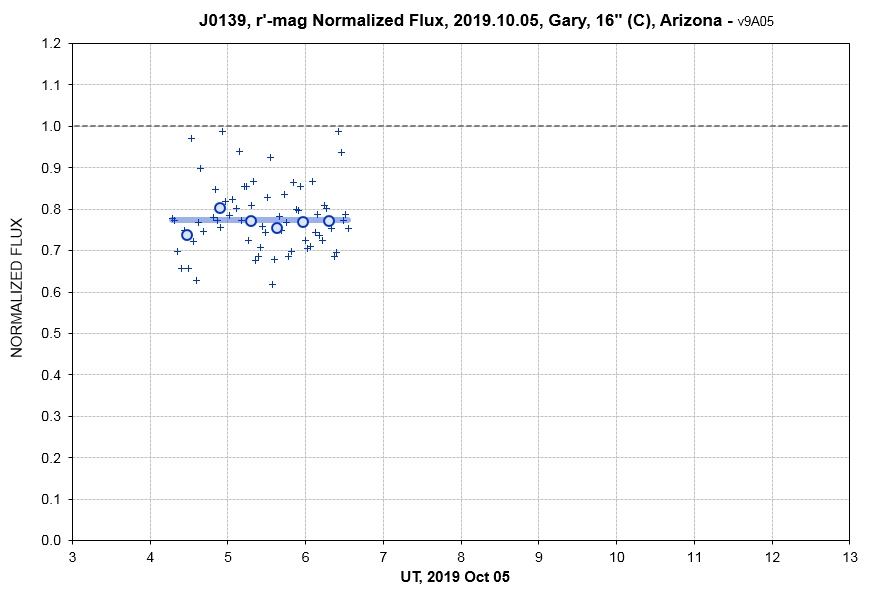
2019.10.05
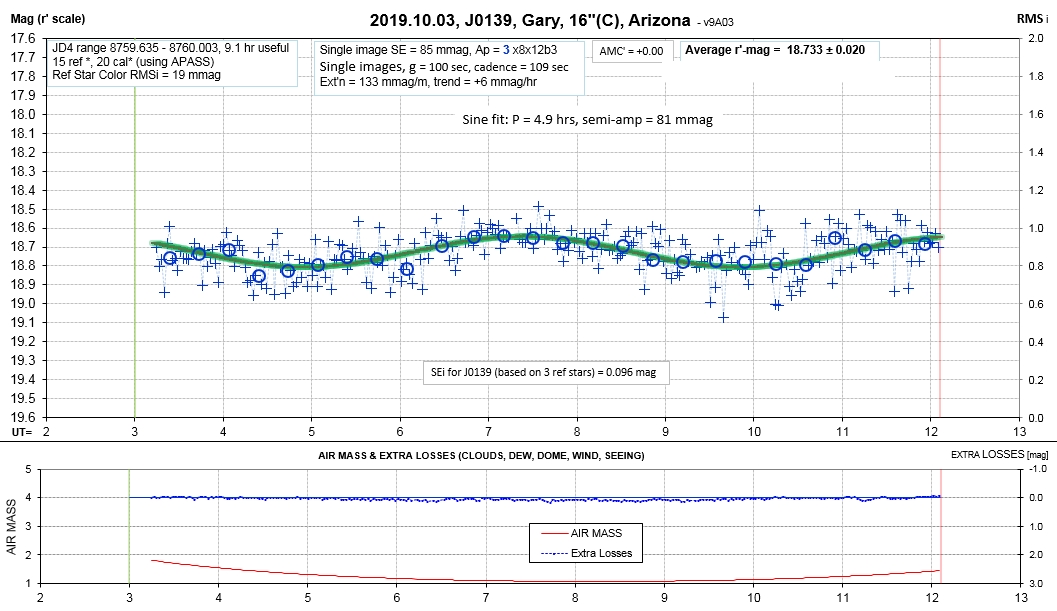
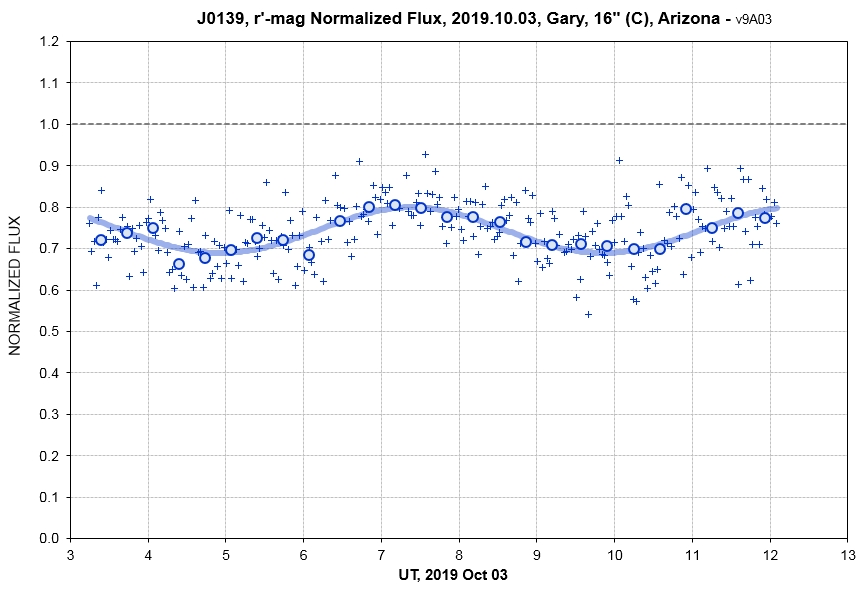
2019.10.03
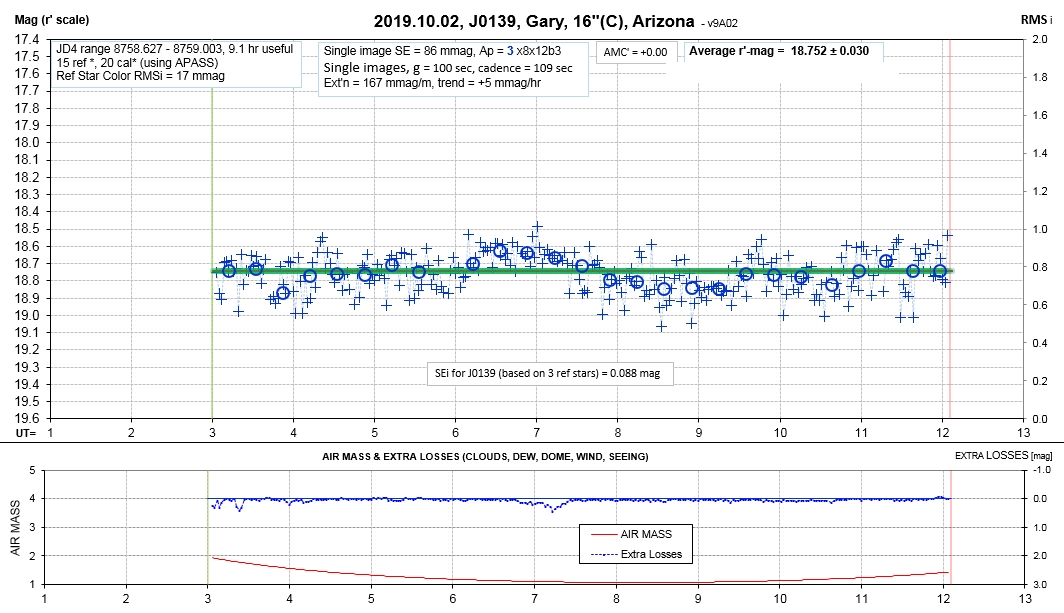
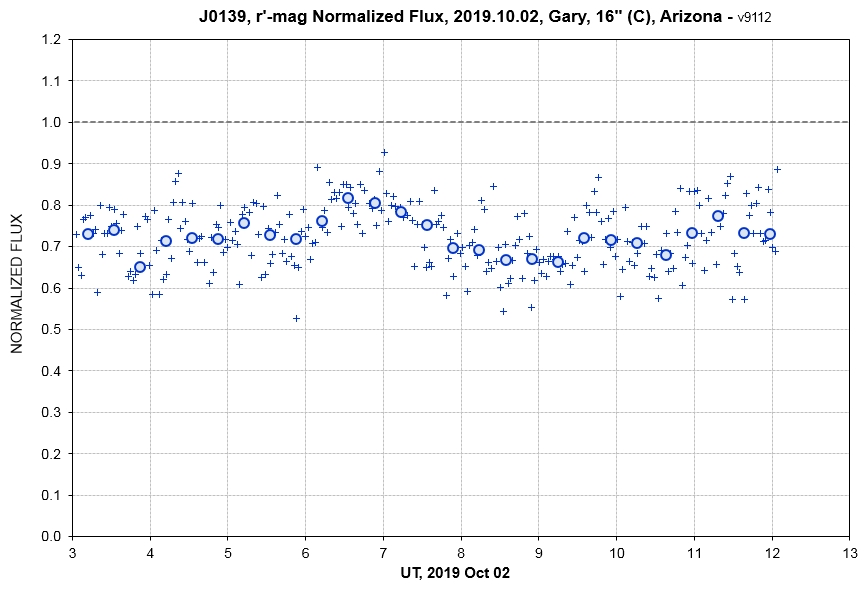
2019.10.02
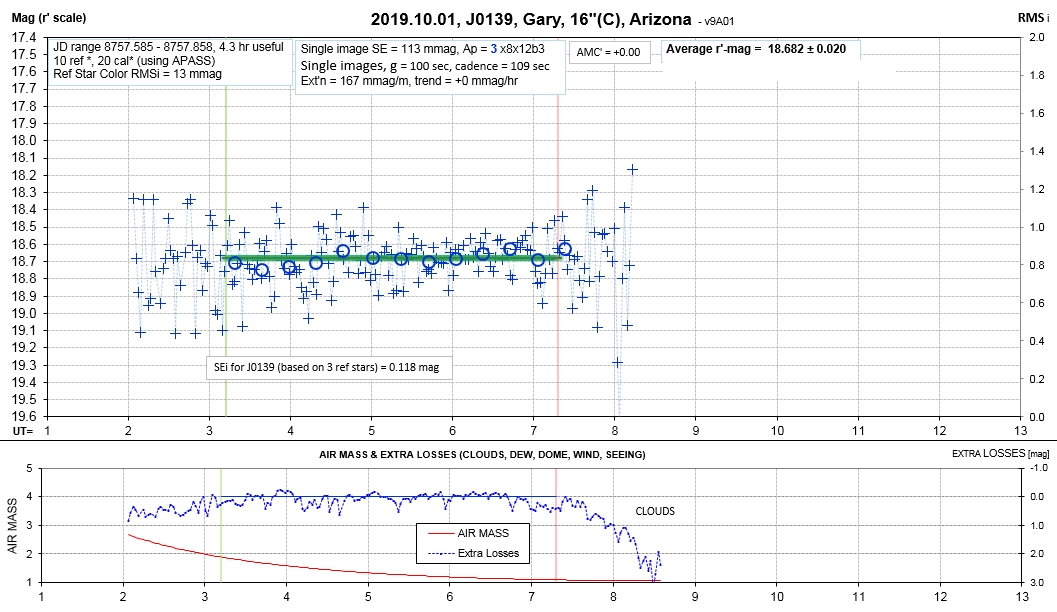
2019.10.01
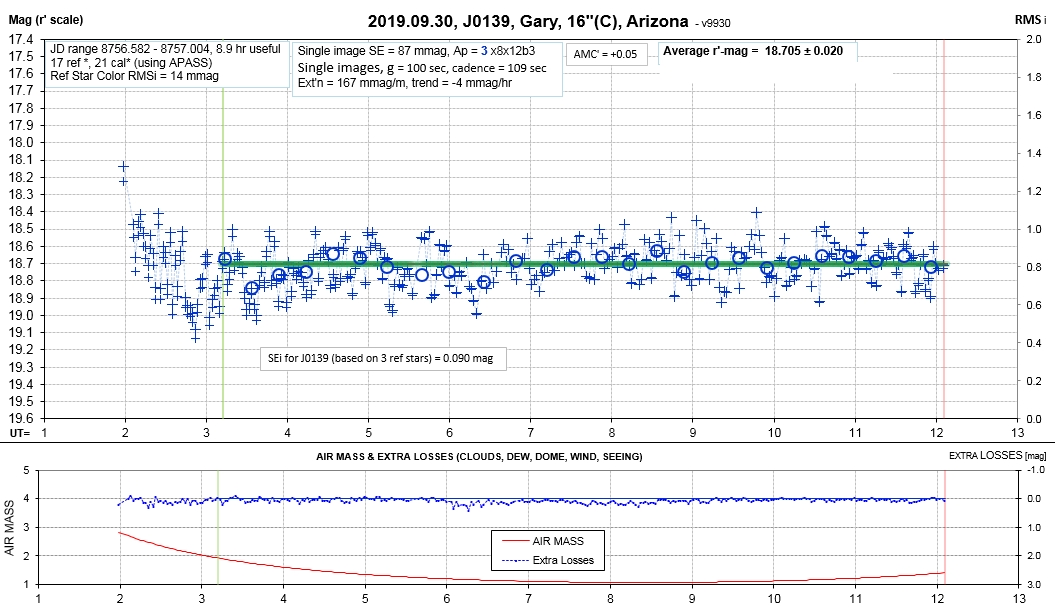
2019.09.30
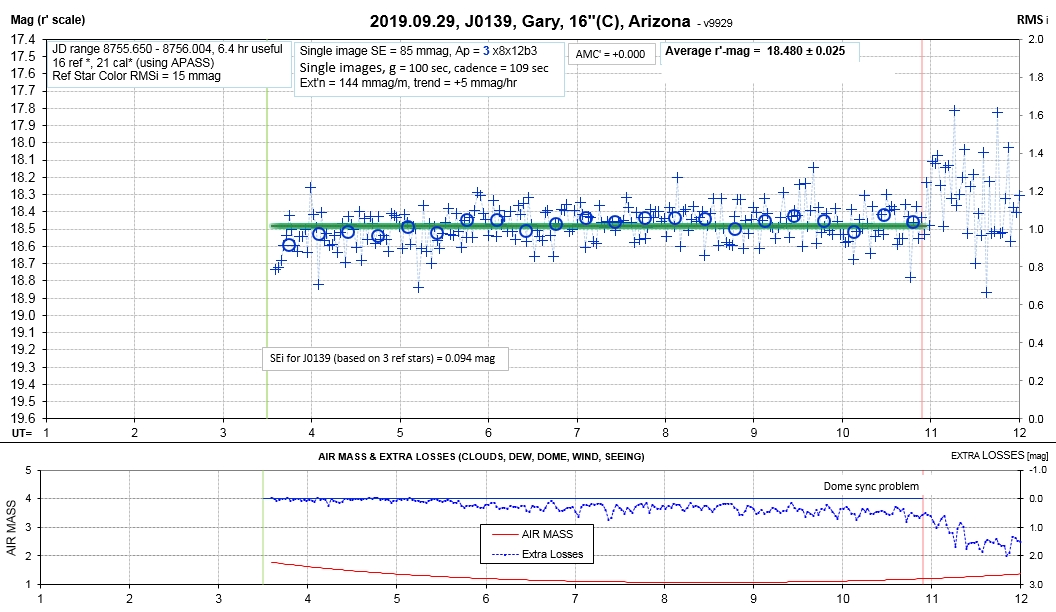
2019.09.29
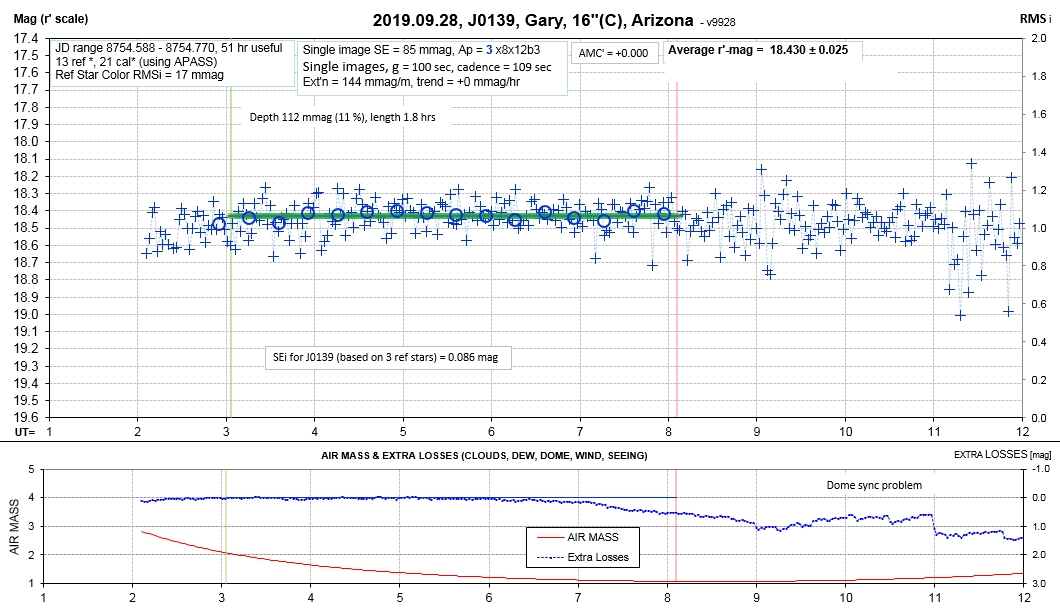
2019.09.28
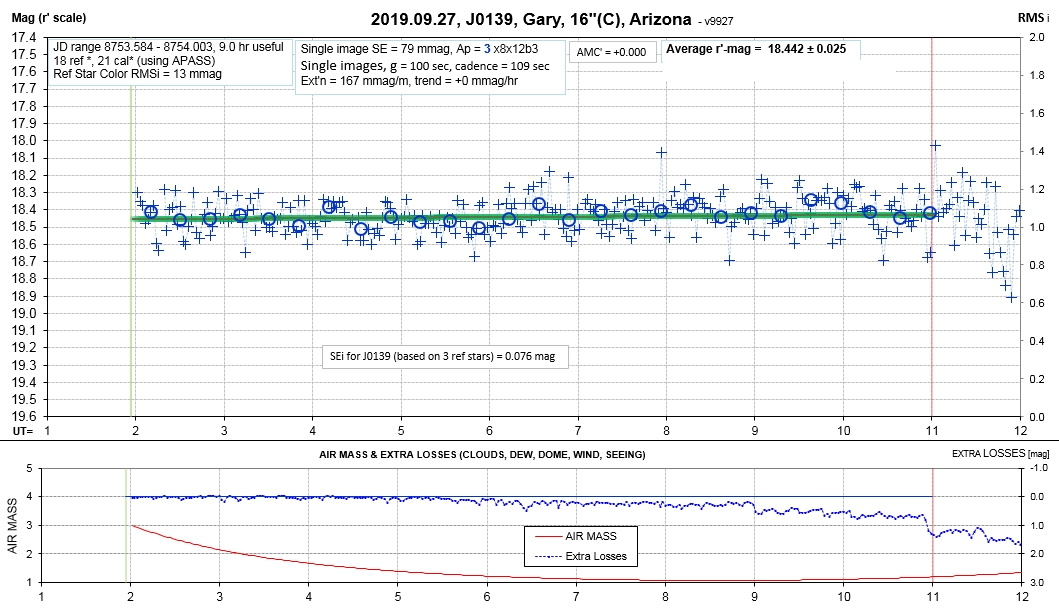
2019.09.27
2019.09.23
2019.09.20
2019.09.18
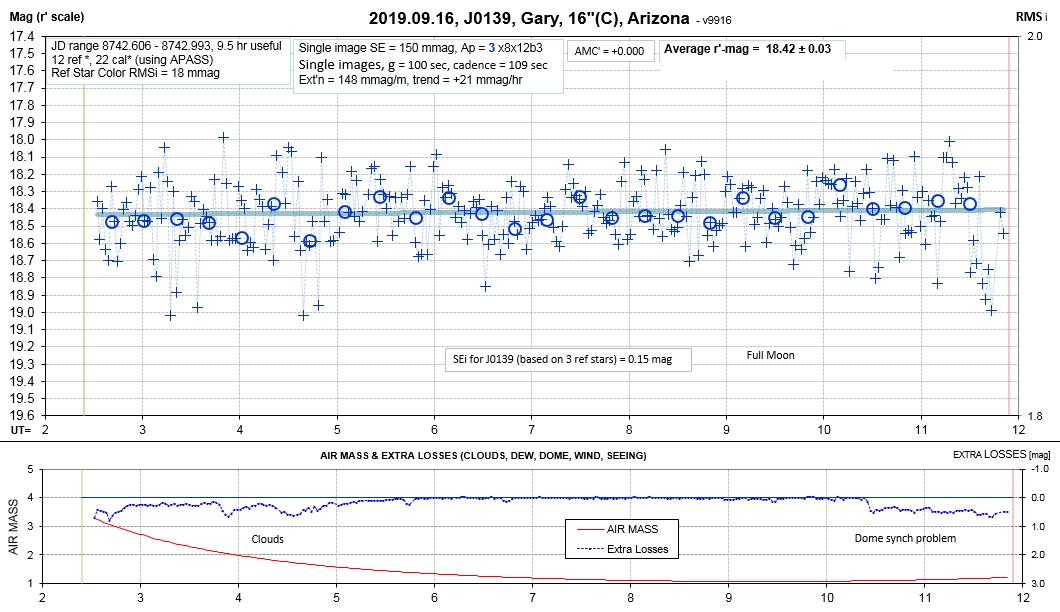
2019.09.16
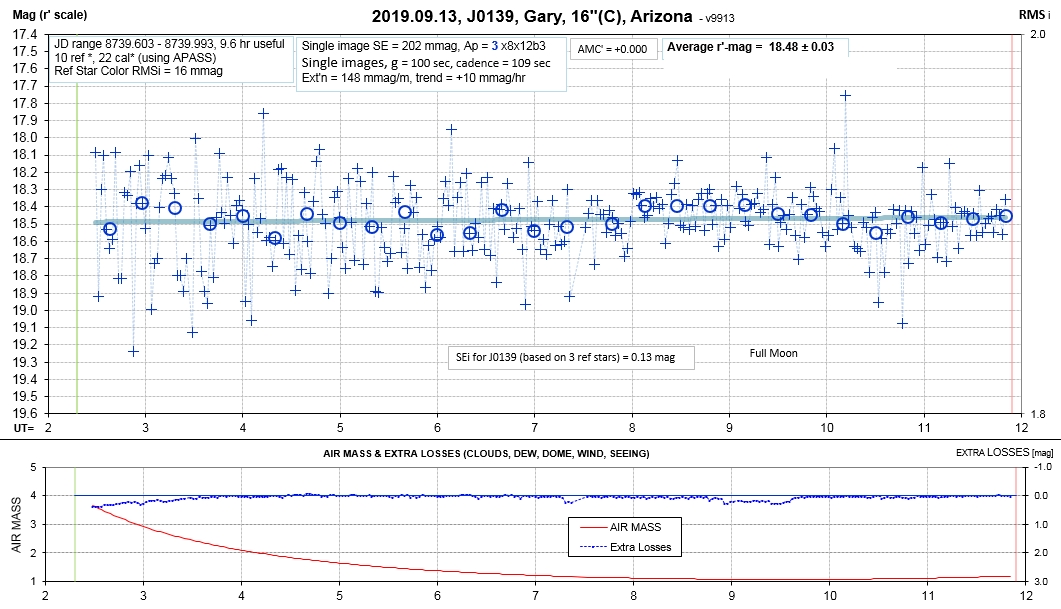
2019.09.13
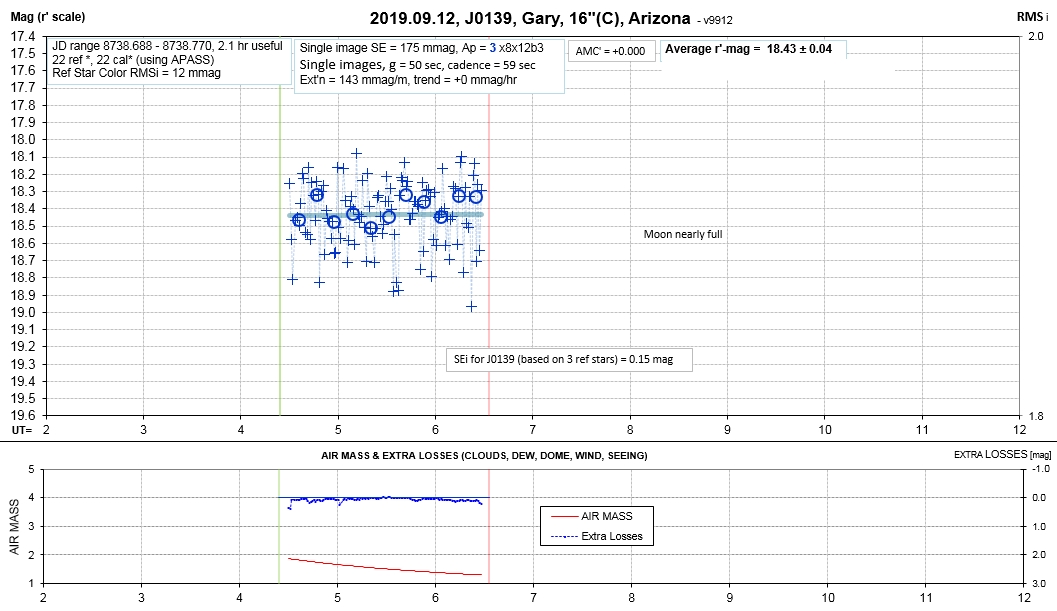
2019.09.12
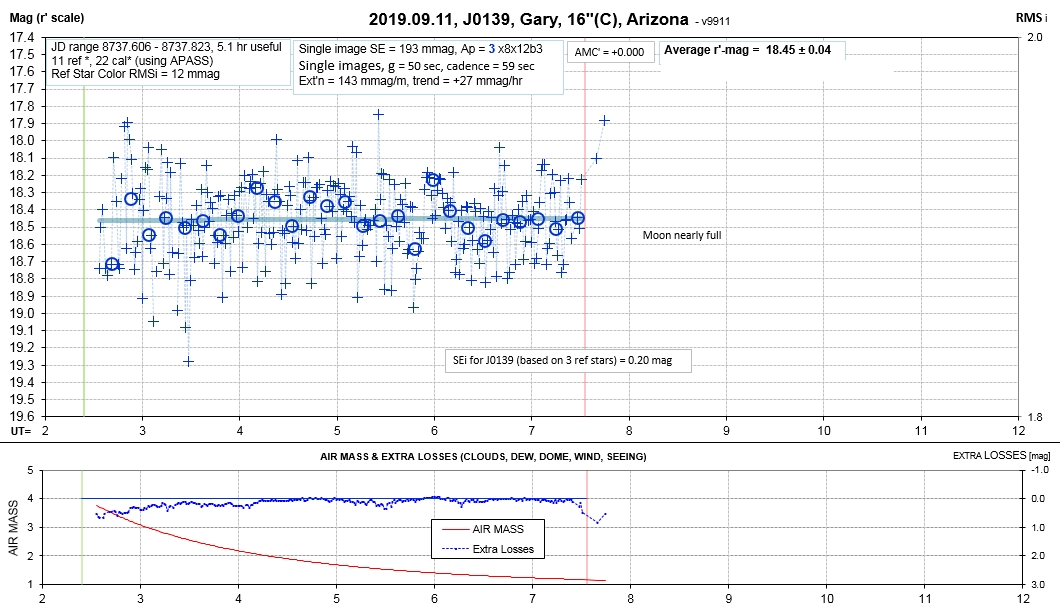
2019.09.11
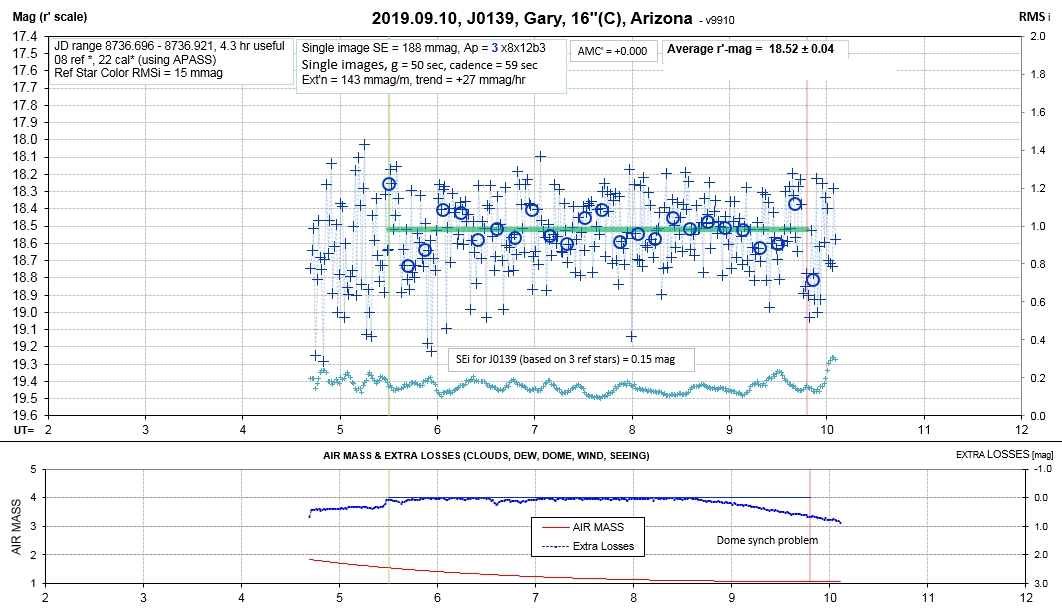
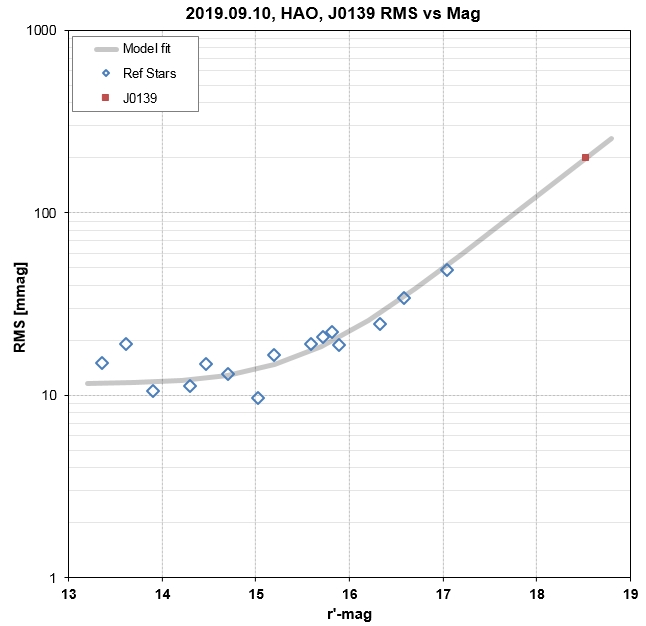
2019.09.10
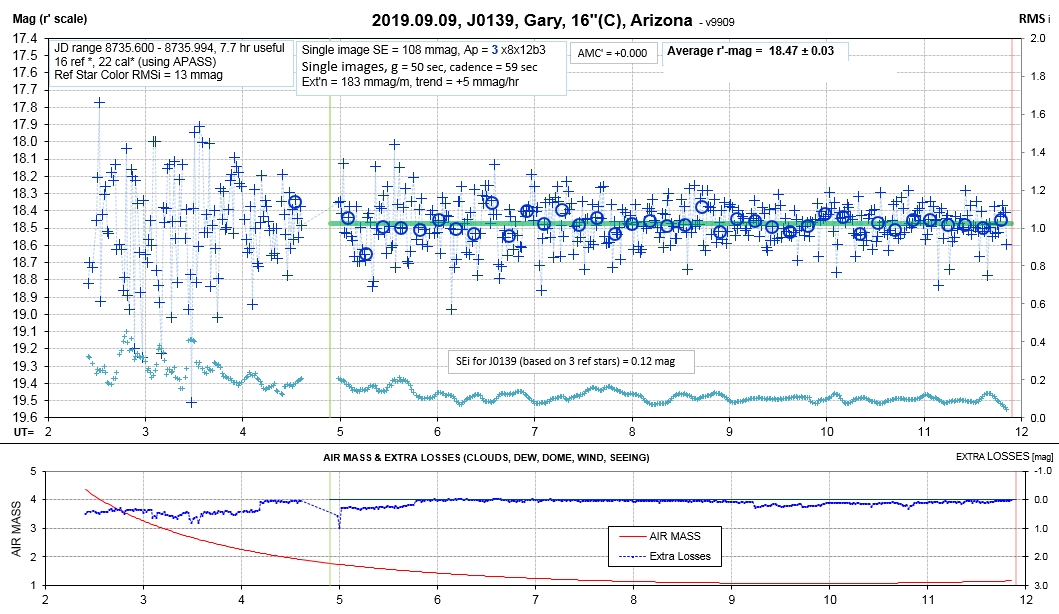
2019.09.09
2019.09.04
2019.09.02
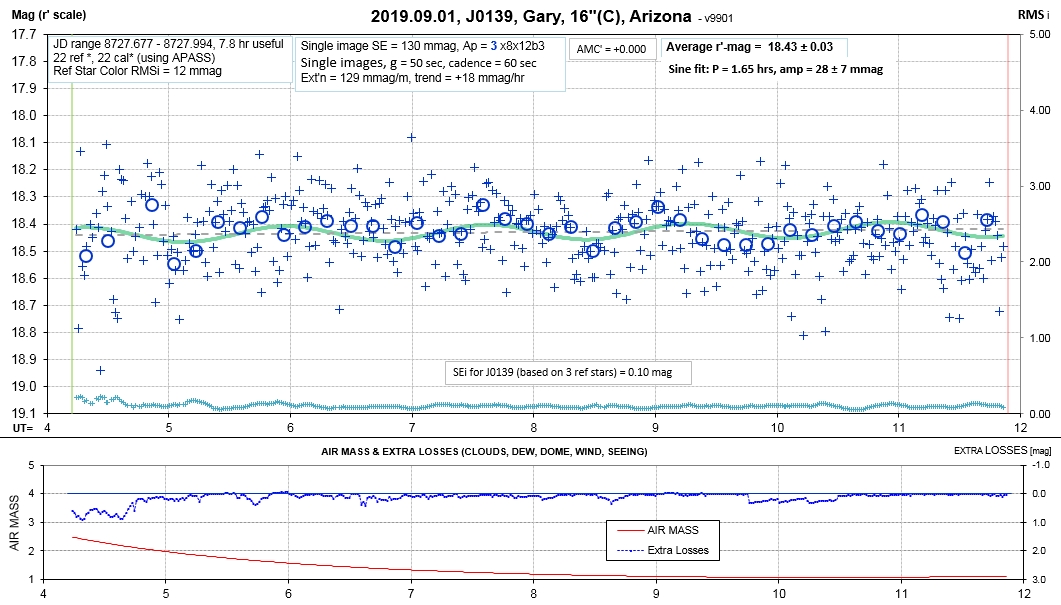
2019.09.01
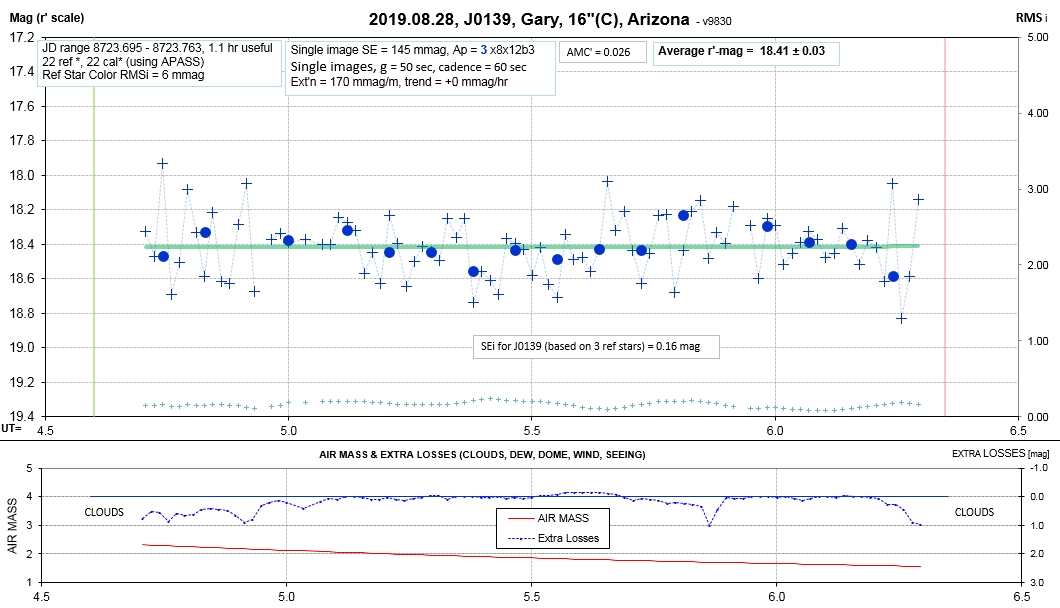
2019.08.28
______________________________ Observing Session
Details (Nightly Light Curves)
___________________________
2025.10.04
2025.10.03
2025.10.02
2025.10.01
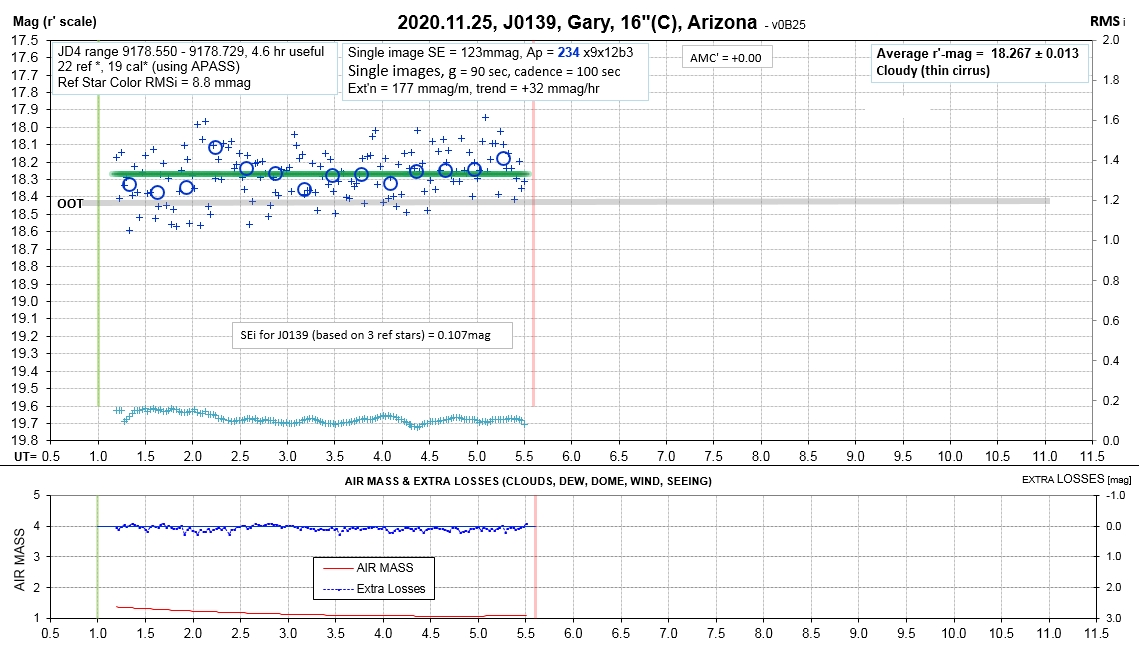
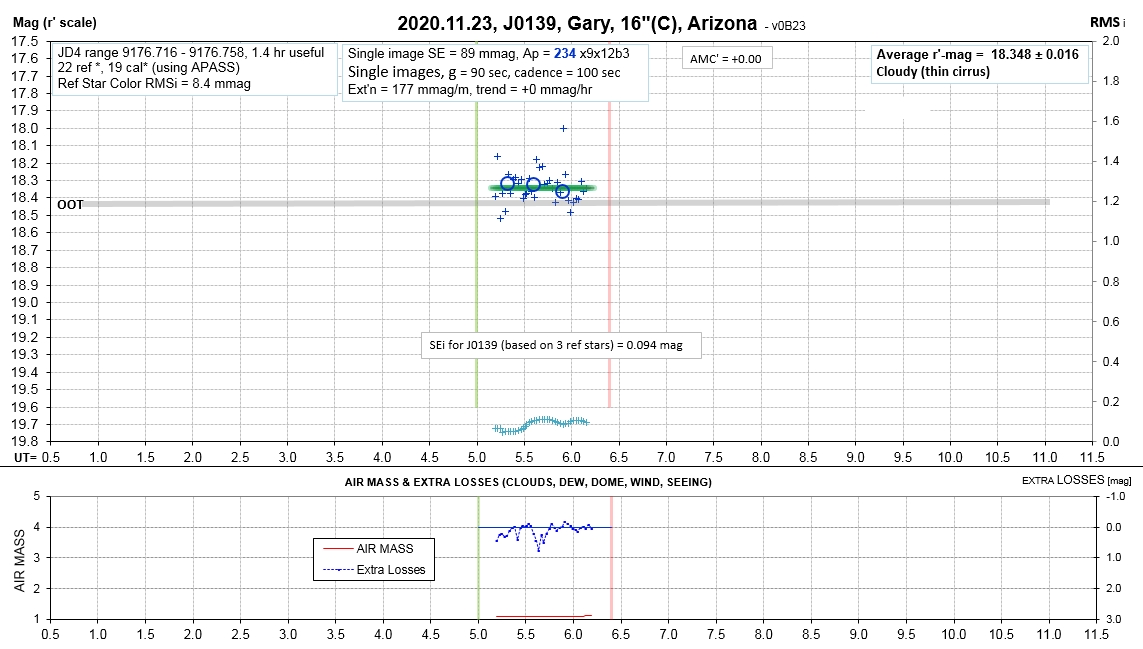
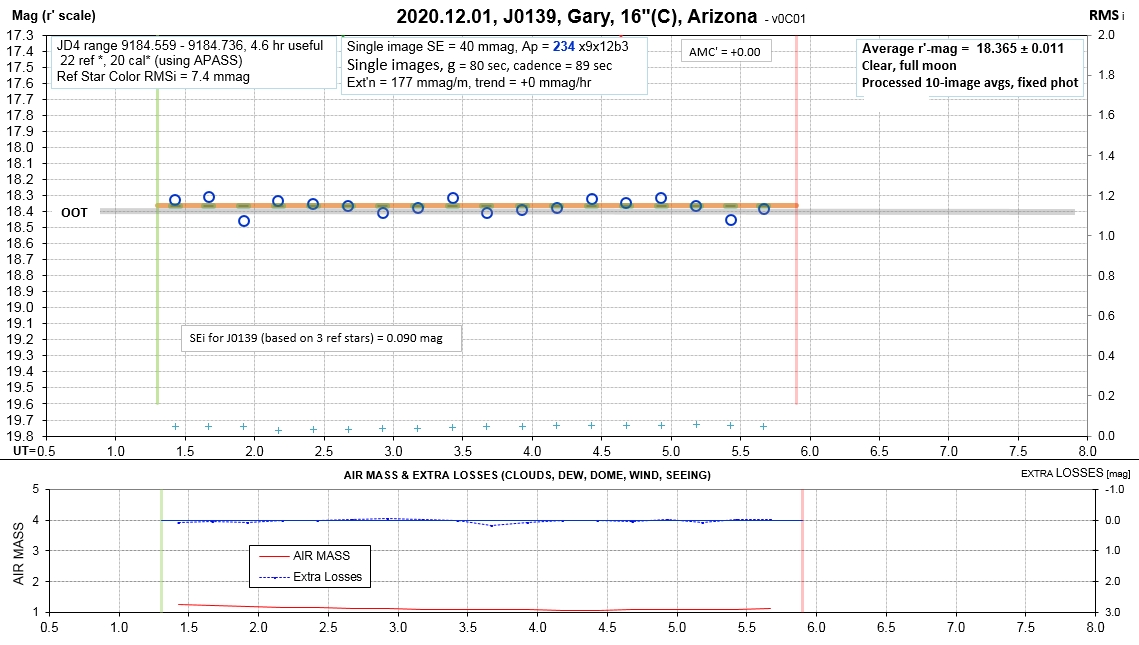
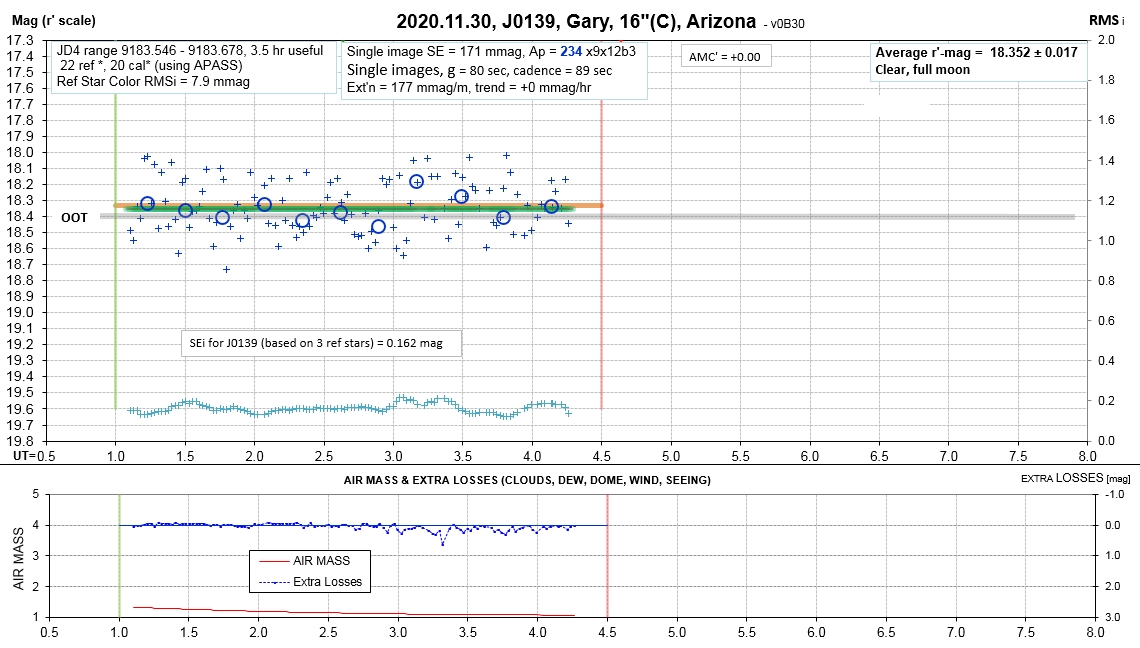
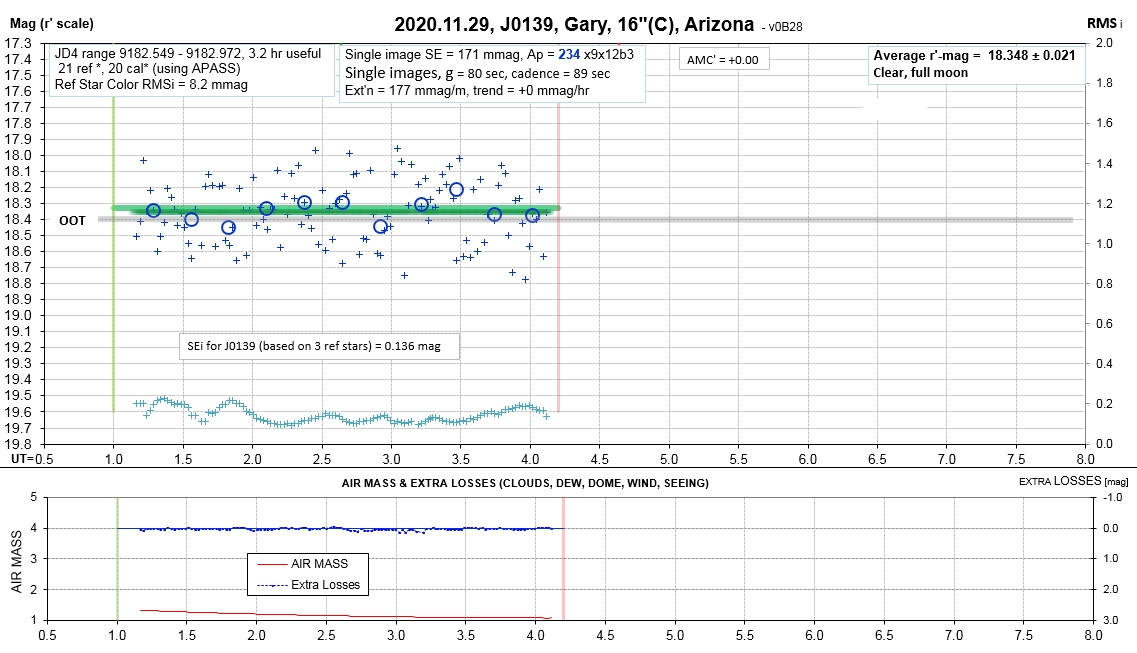
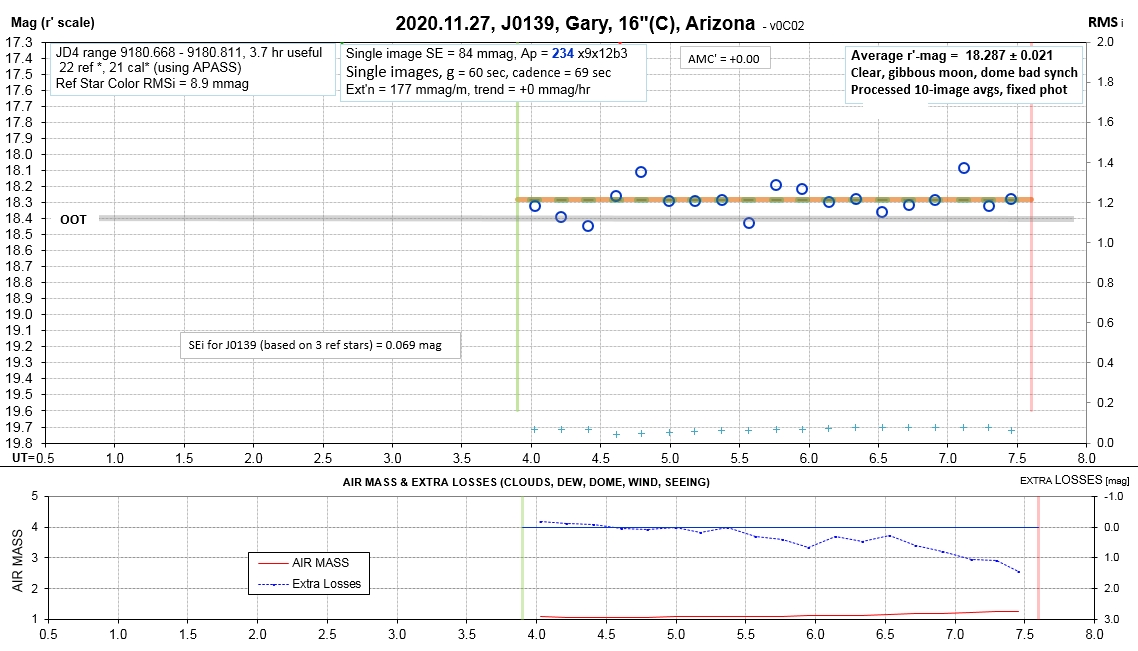
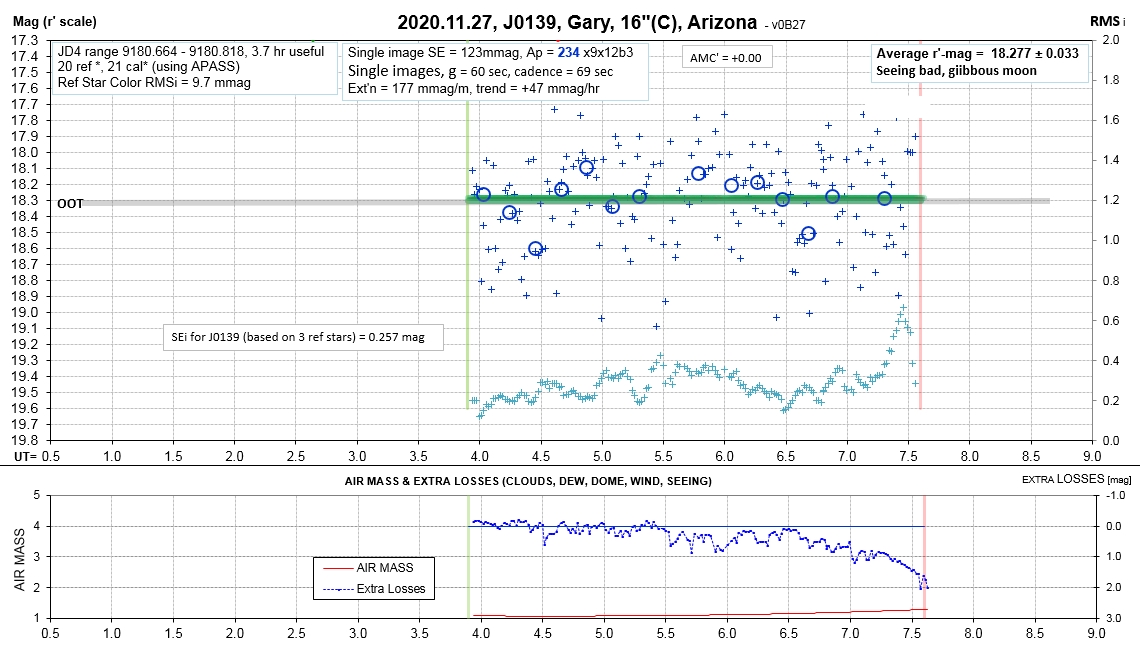
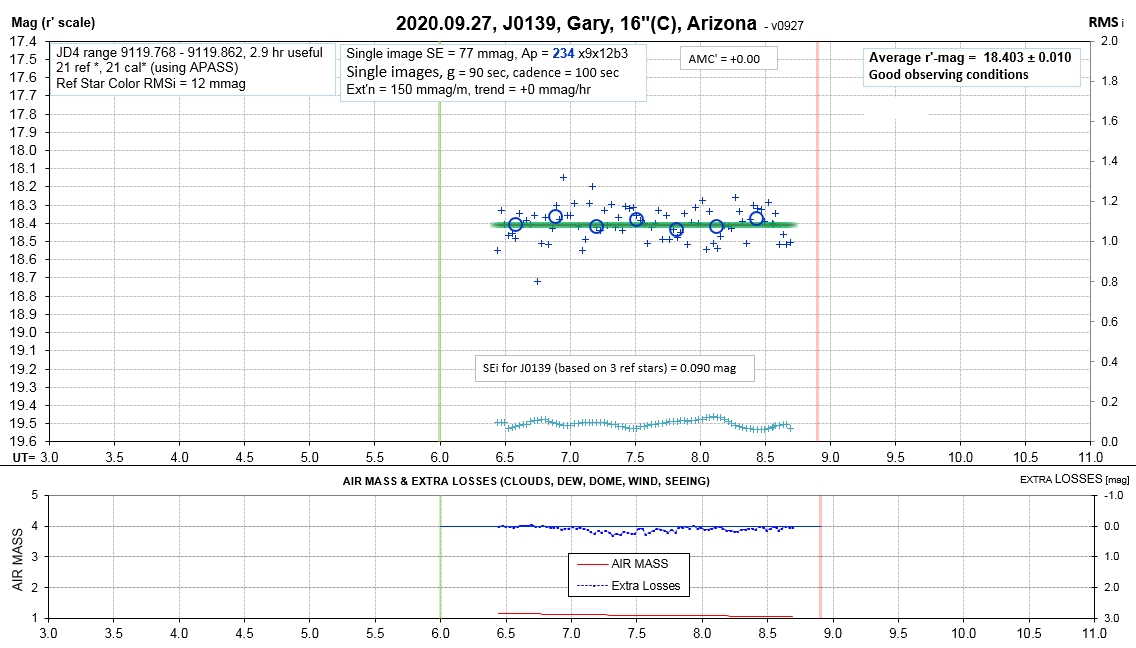
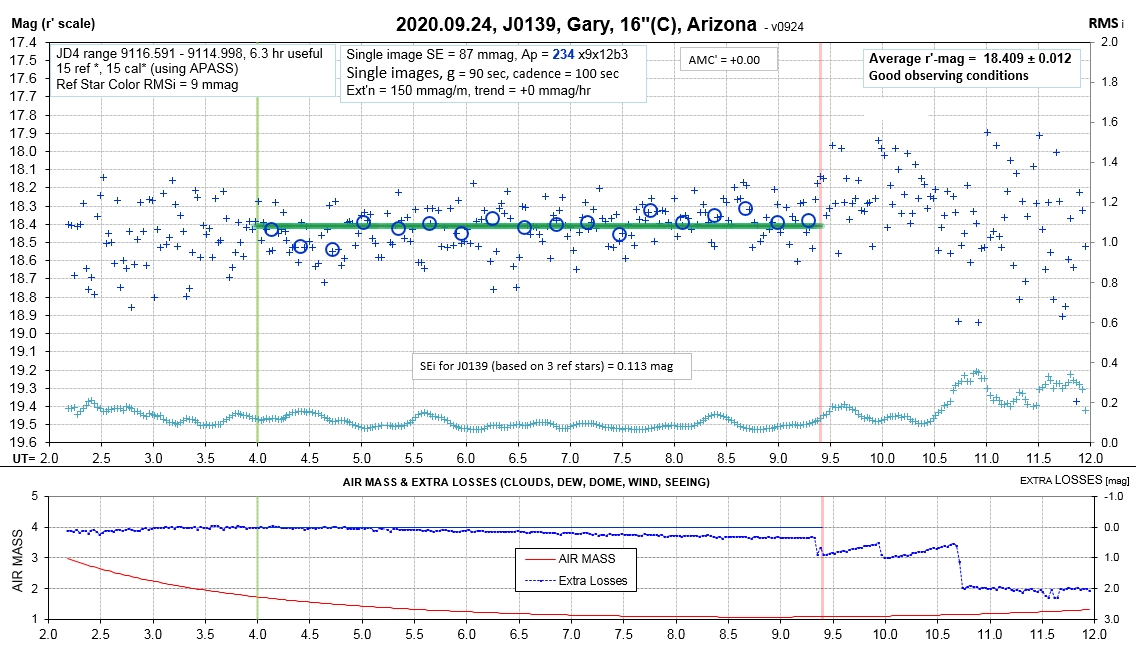
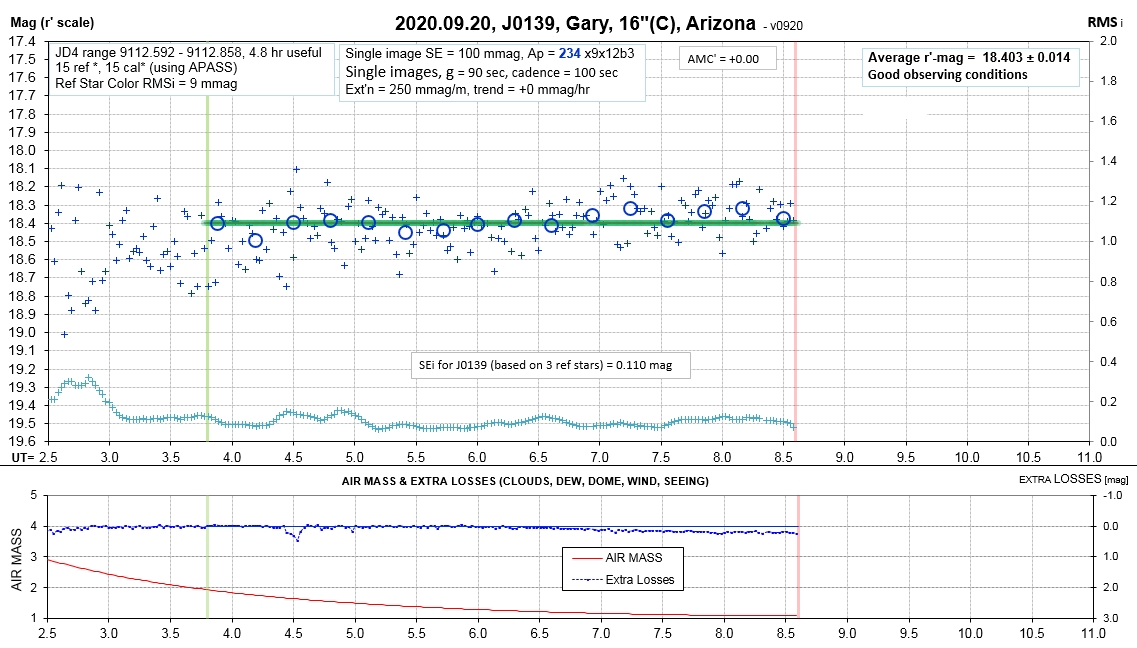
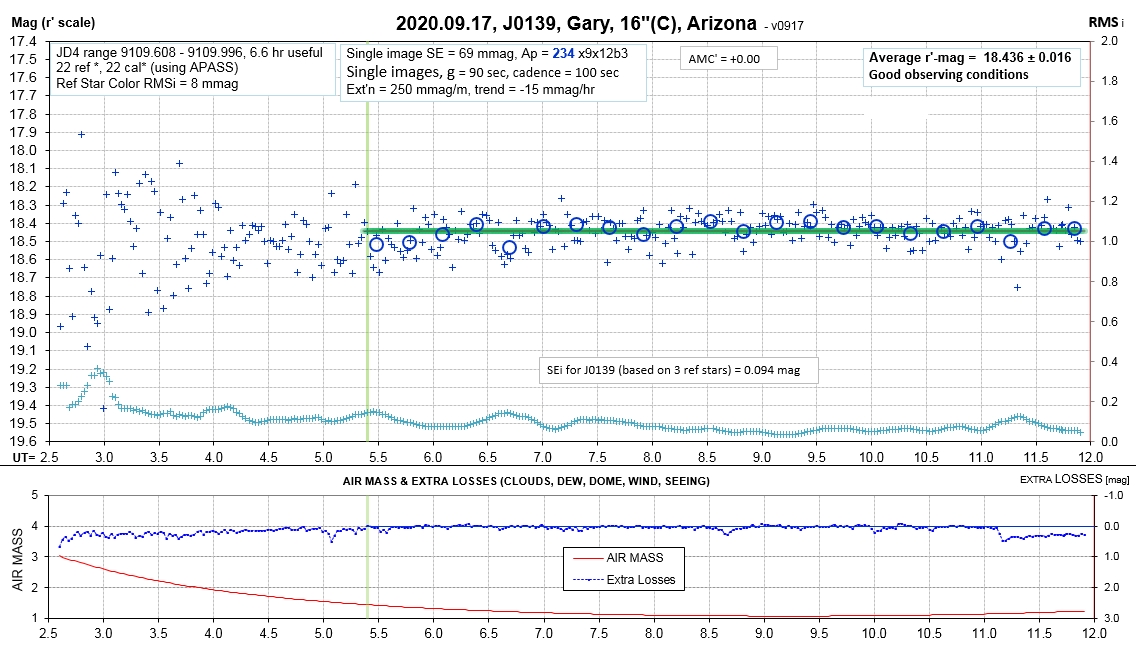
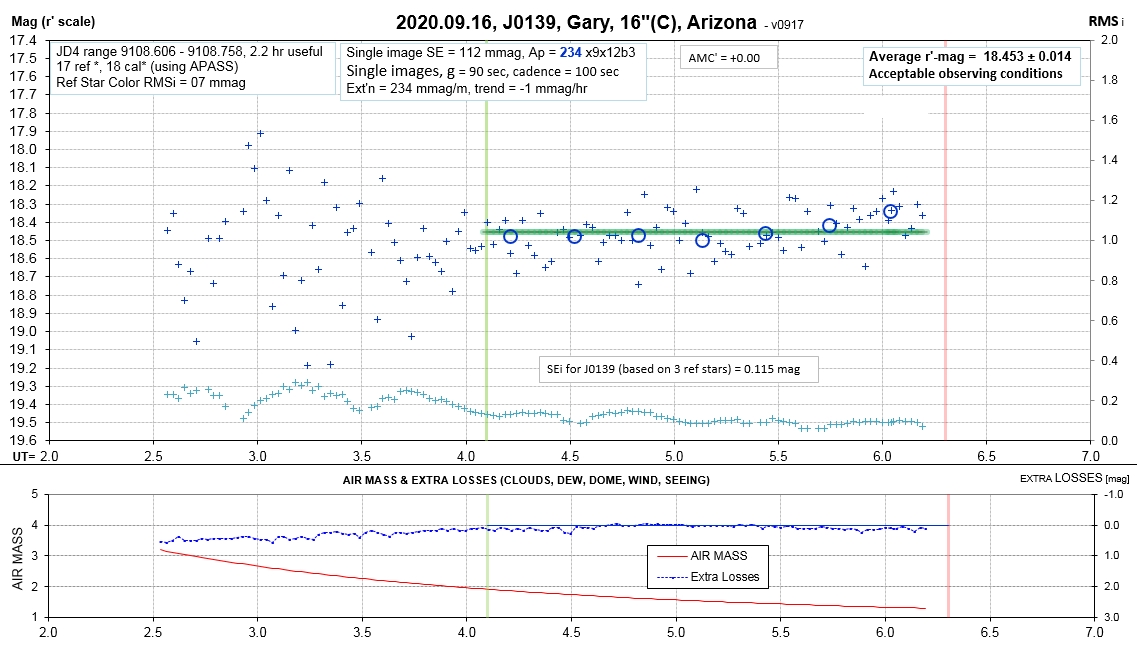
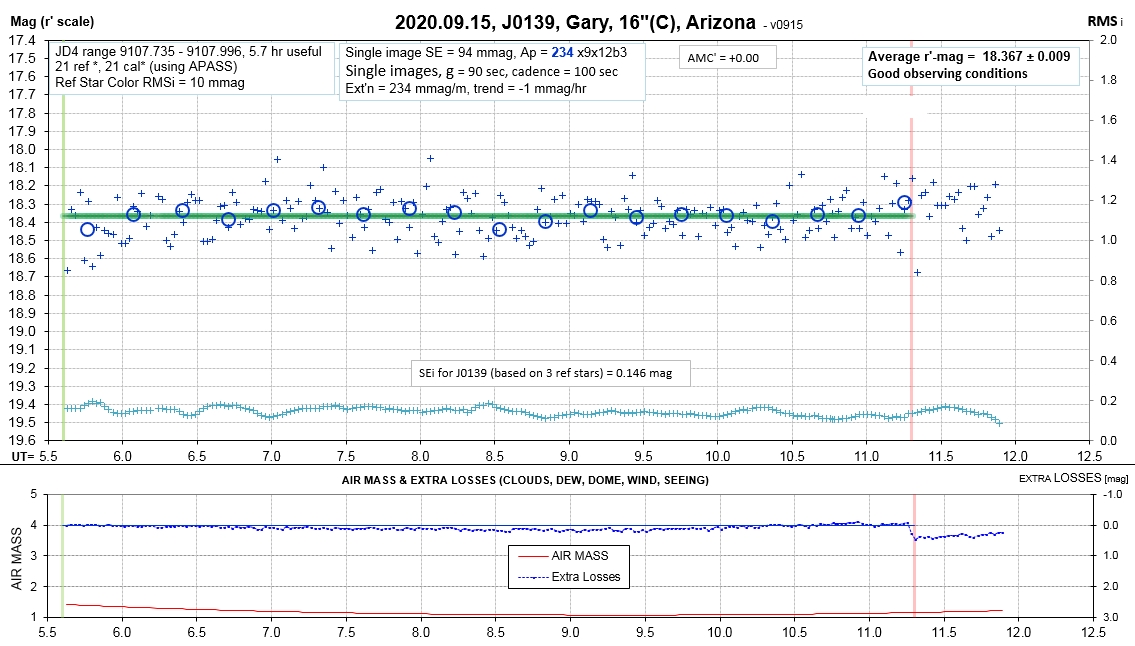
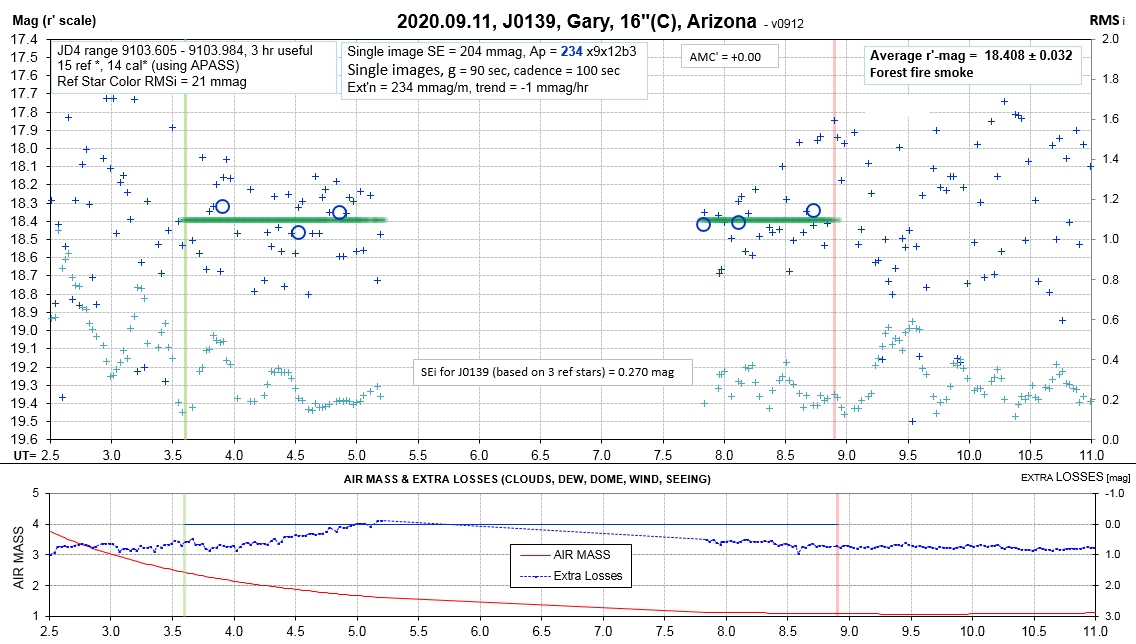
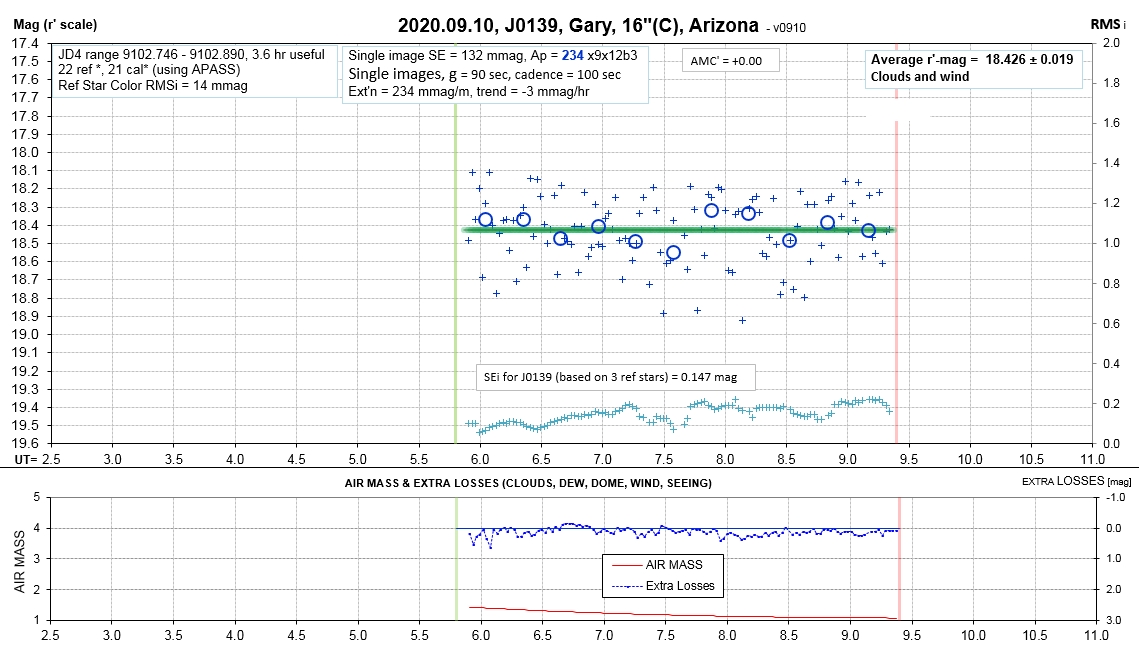
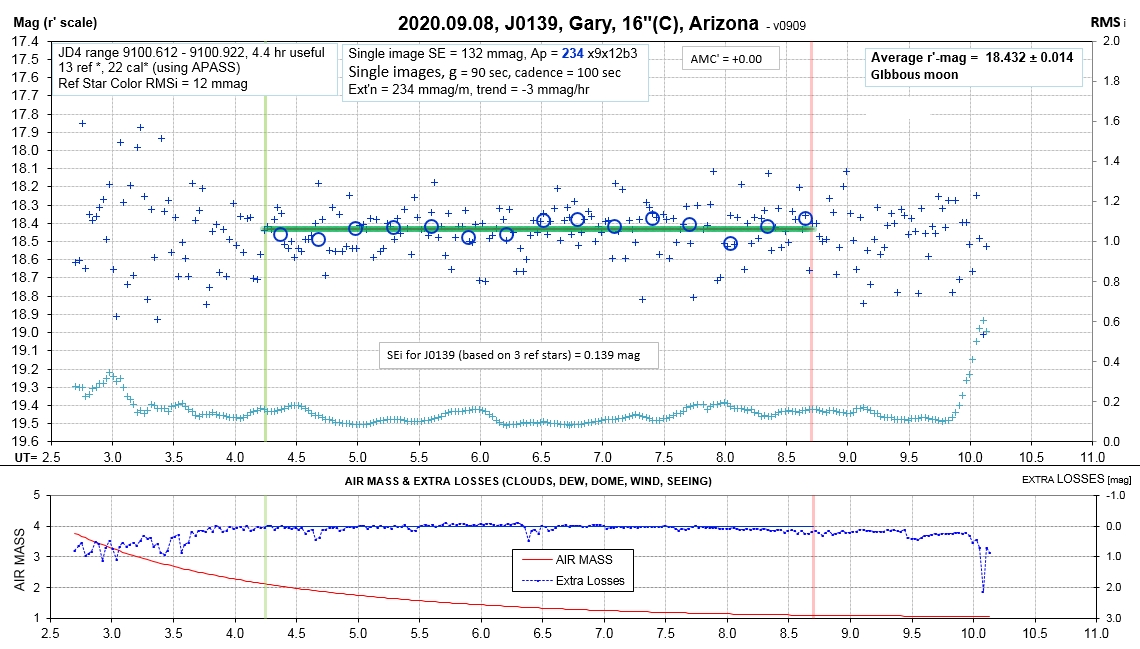
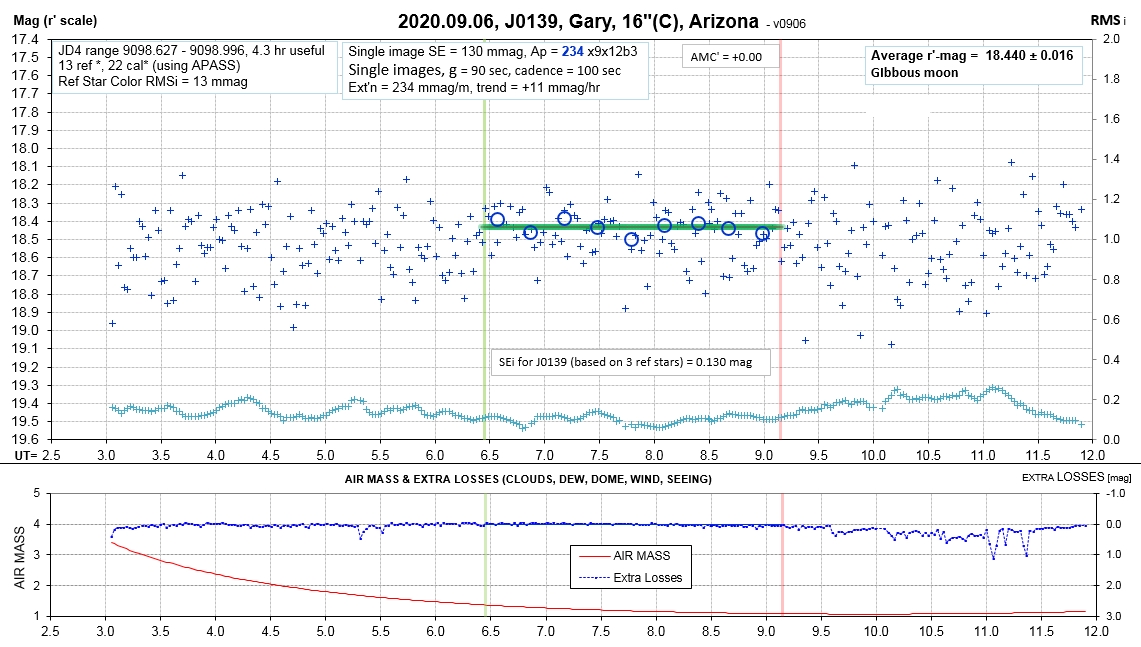
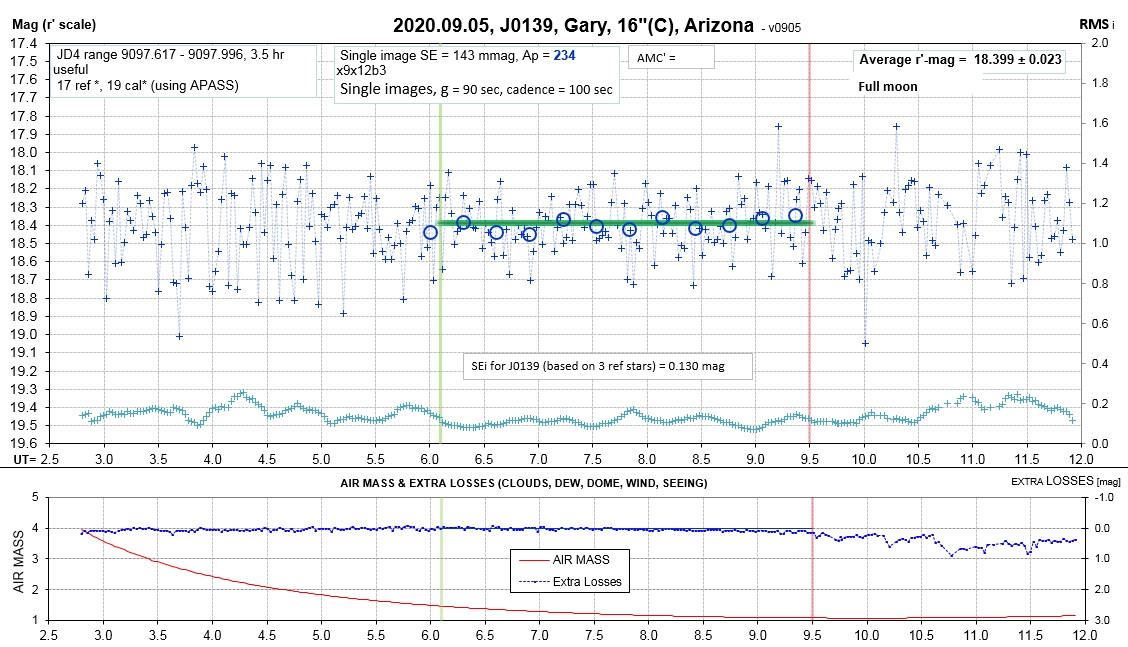
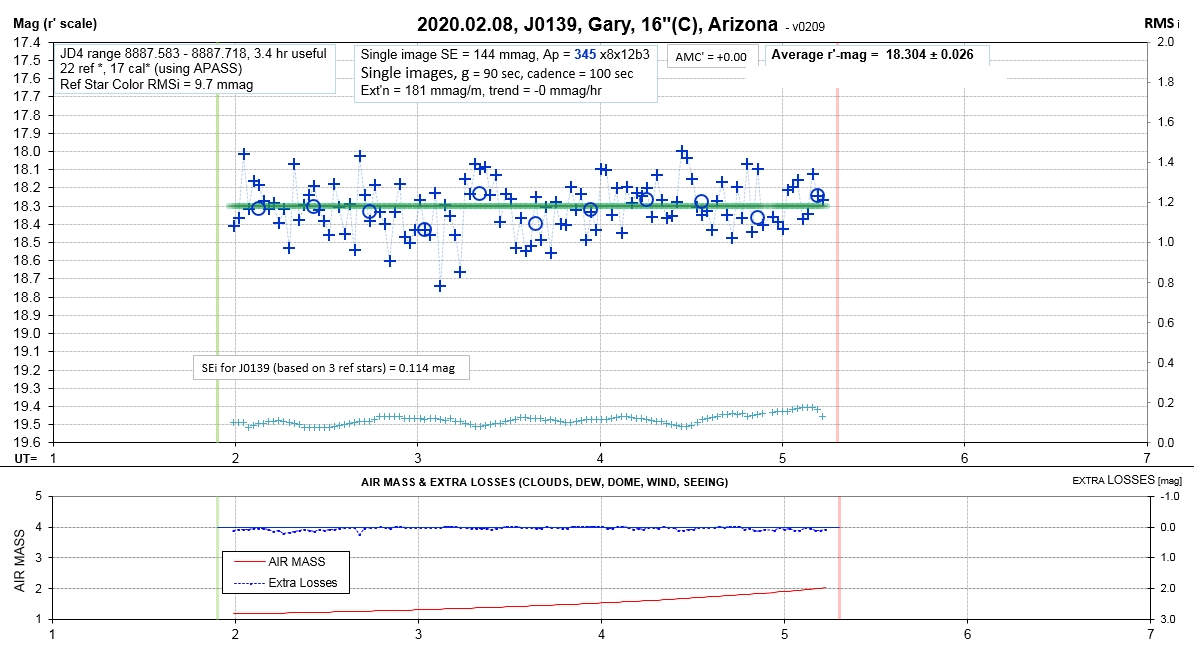
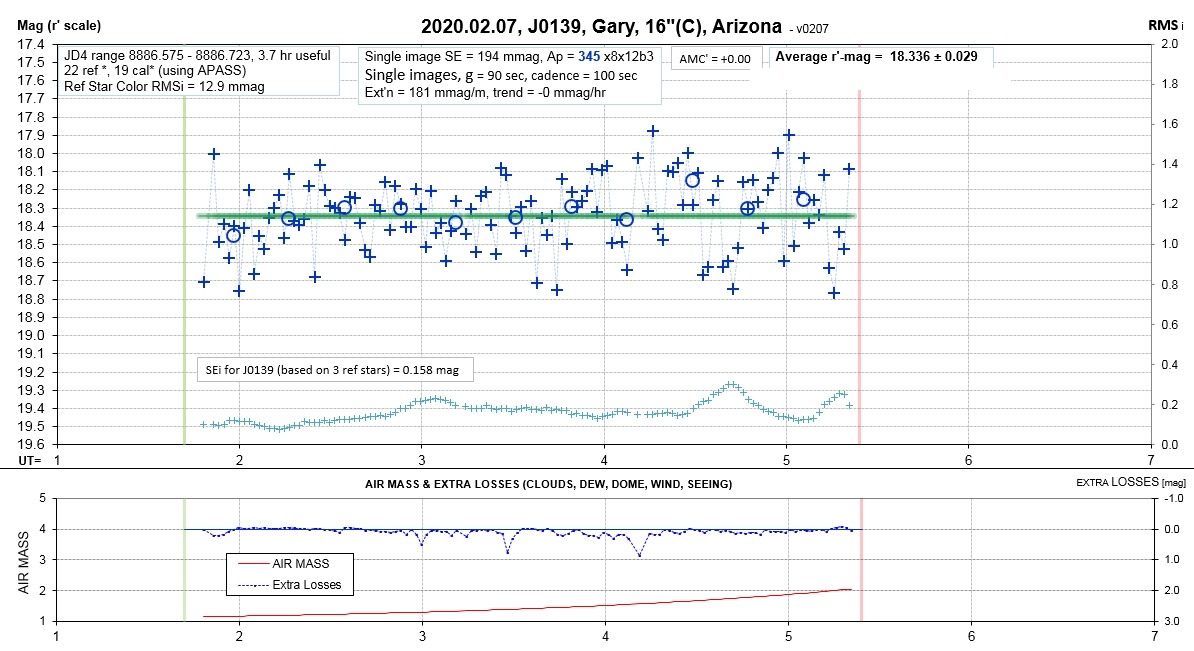
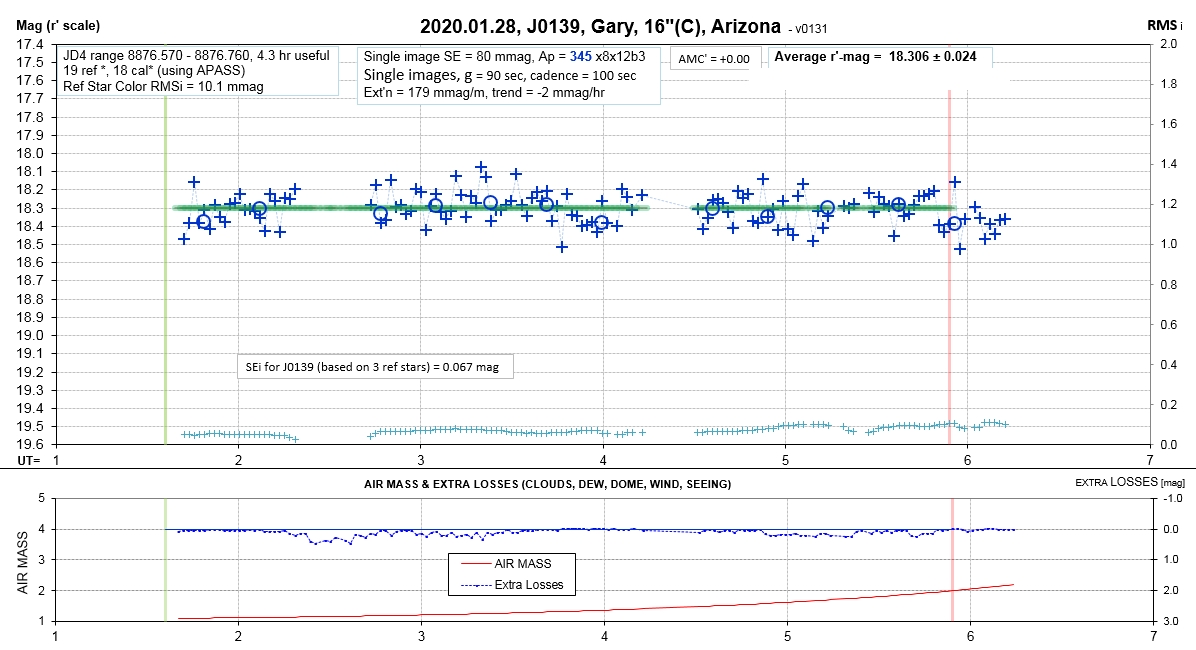
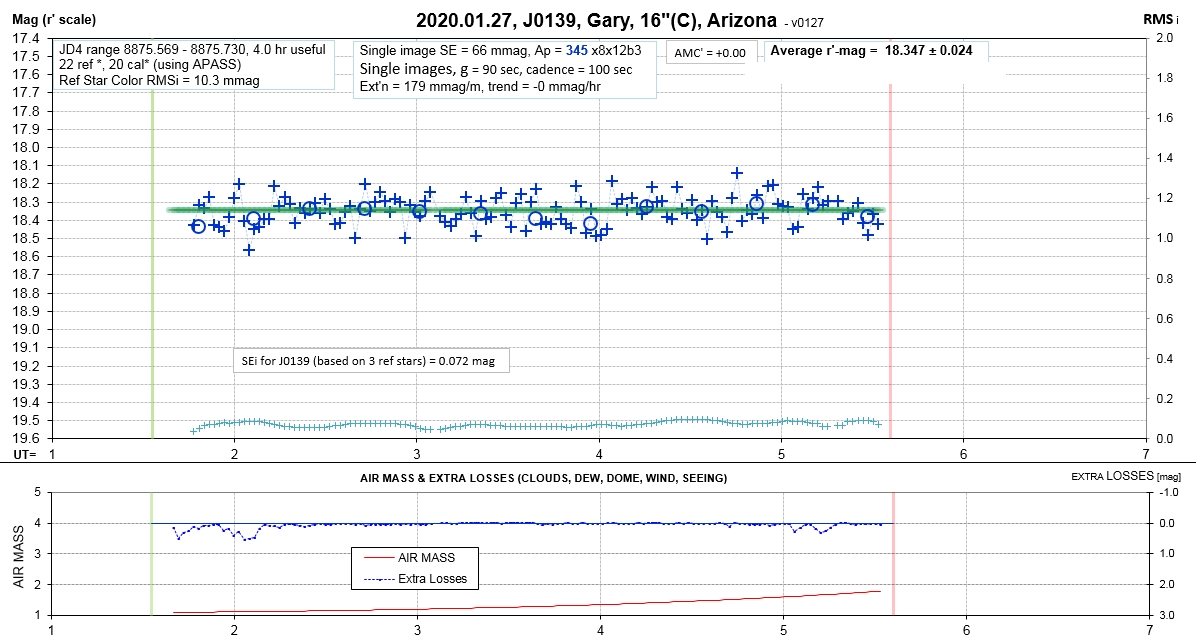
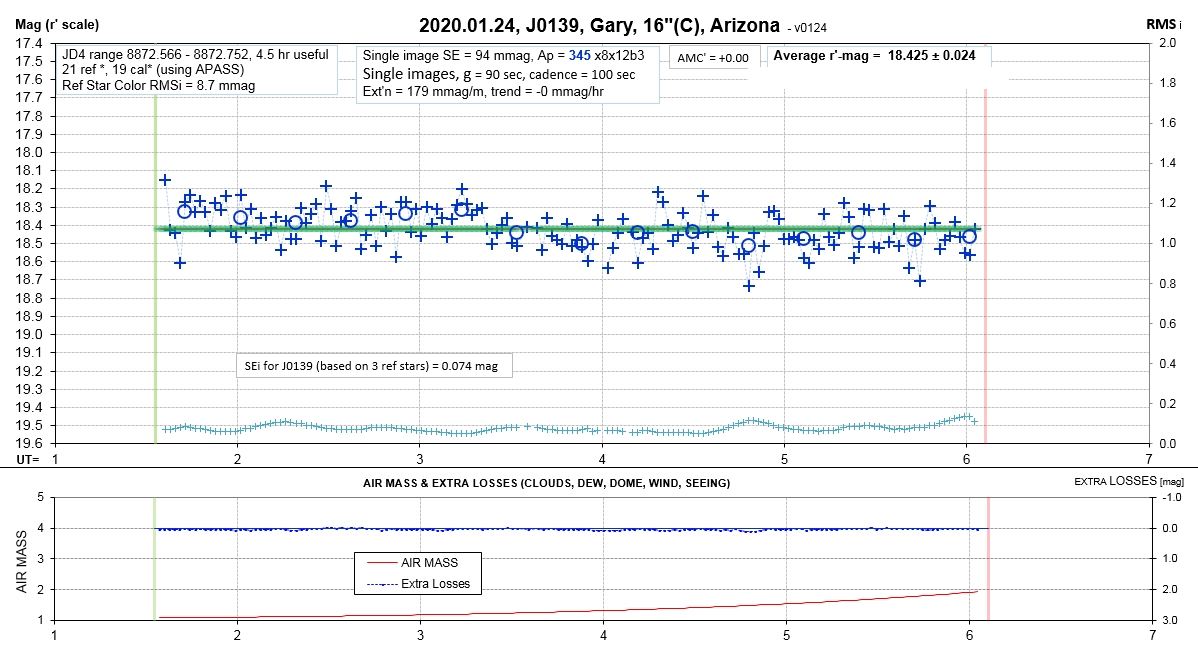
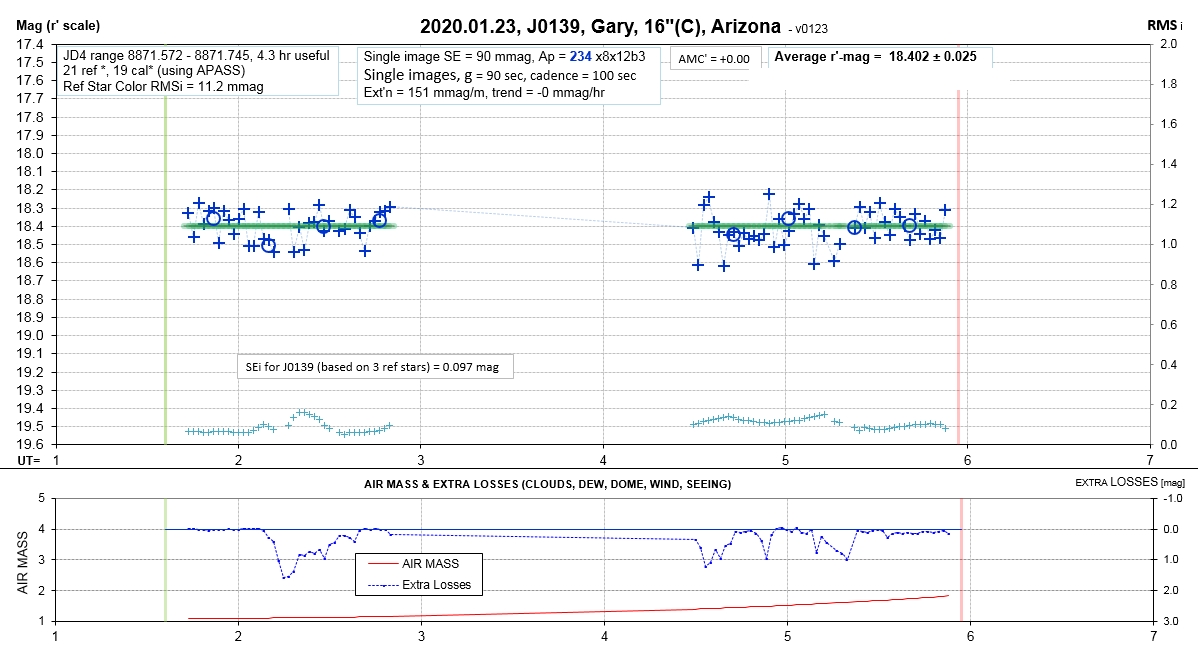
:Light Curves for 2020 Season
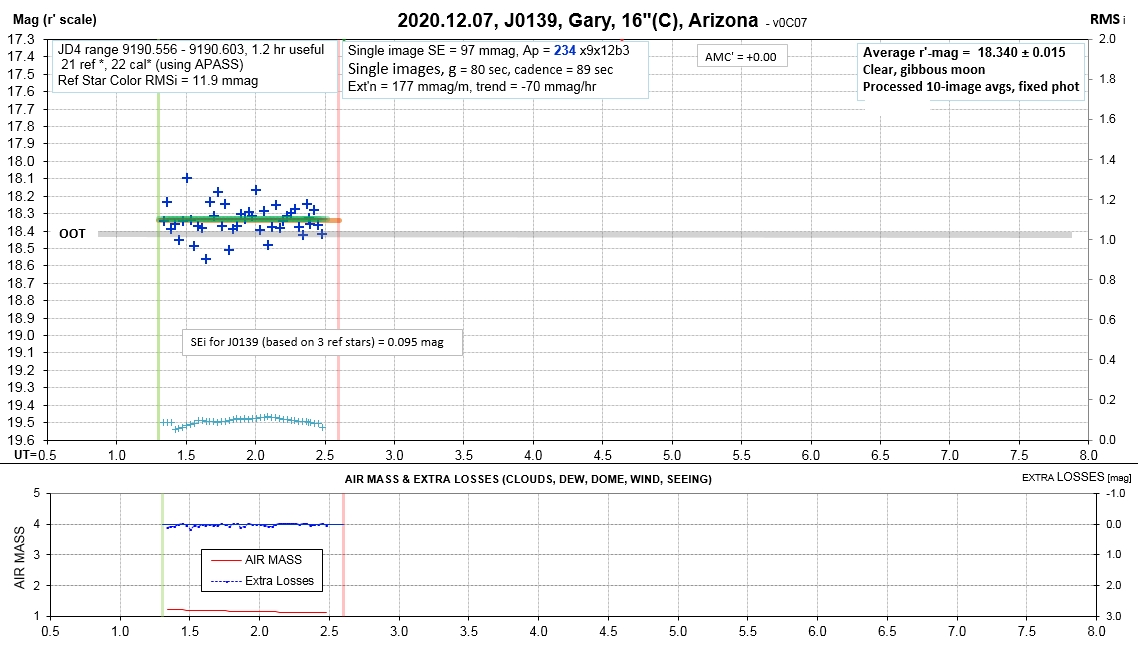
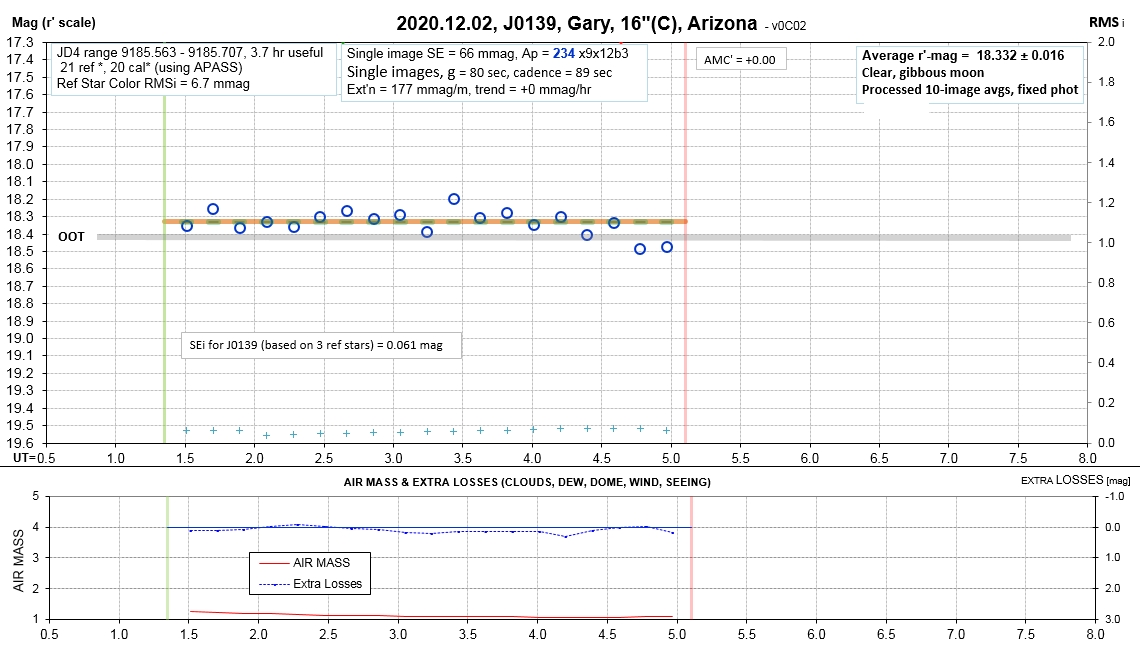
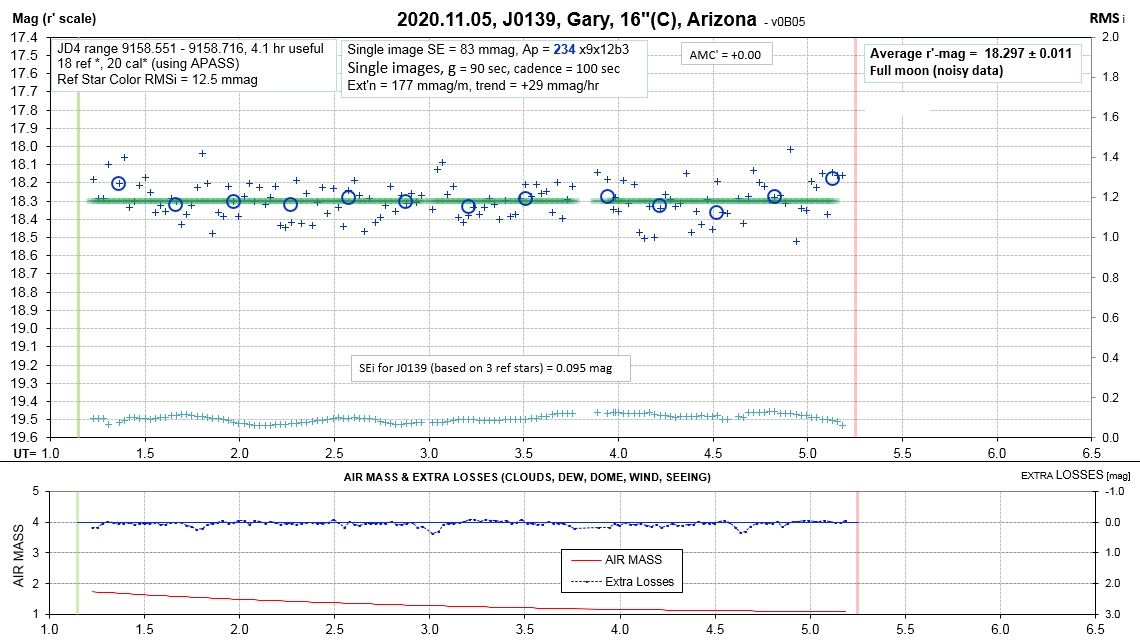
Full moon degraded SNR so I averaged groups of 10 images &
processed them as usual.
2020.11.28
I processed this long observing session as two segments to see if there was a trend within a 10-hour interval. There wasn't..
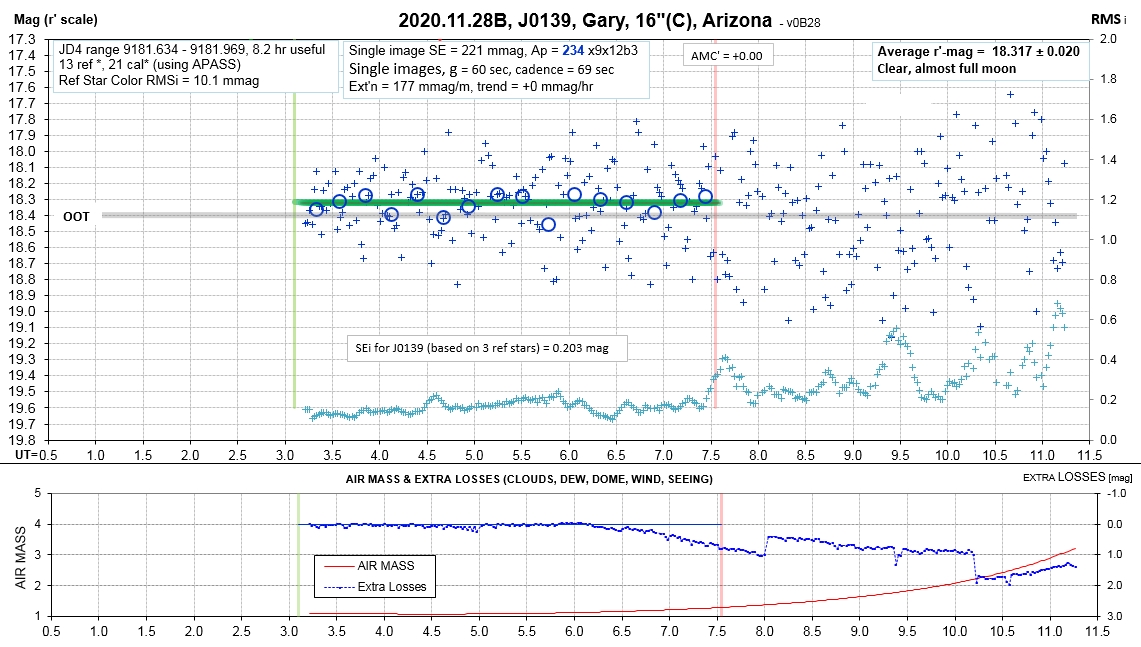
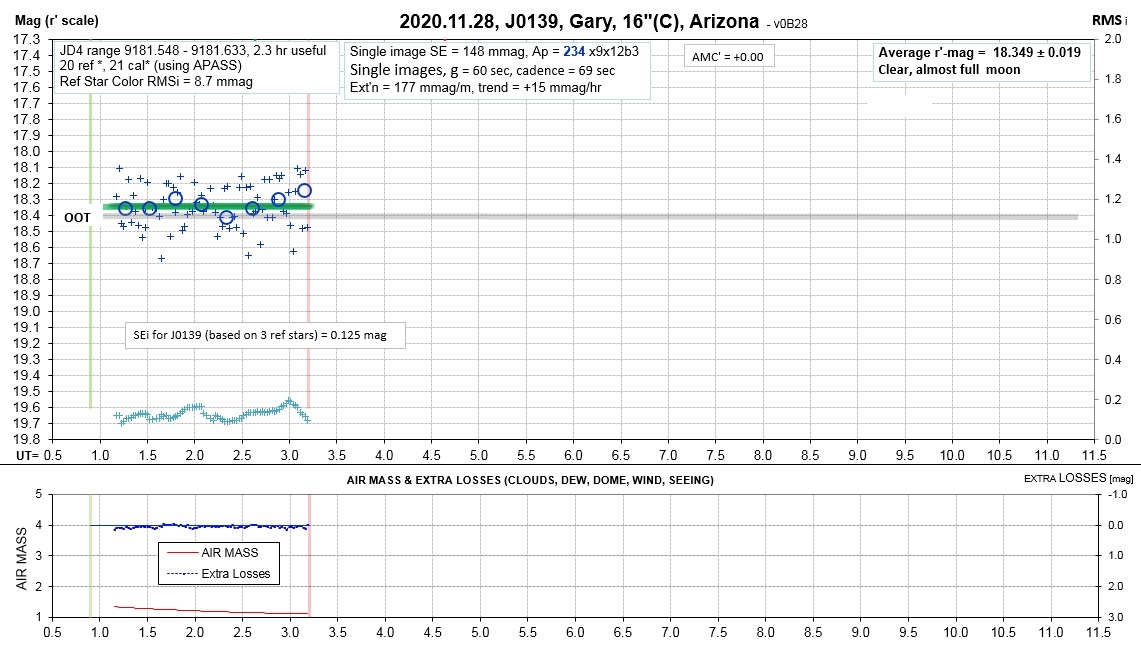
Image set processed two ways, and both give similar answer.
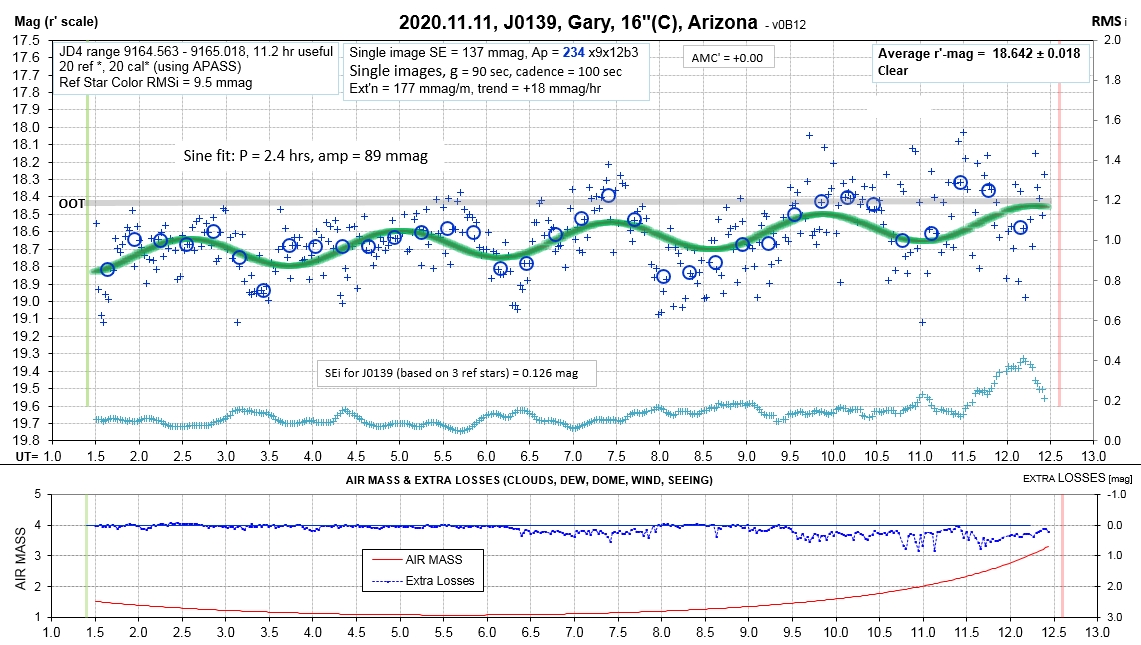
The 2.4-hr sinusoidal variation and slope are
statistically significant. A recovery appears to be in
progress.
It appears that a dip has begun with a priod of 104.6 days.
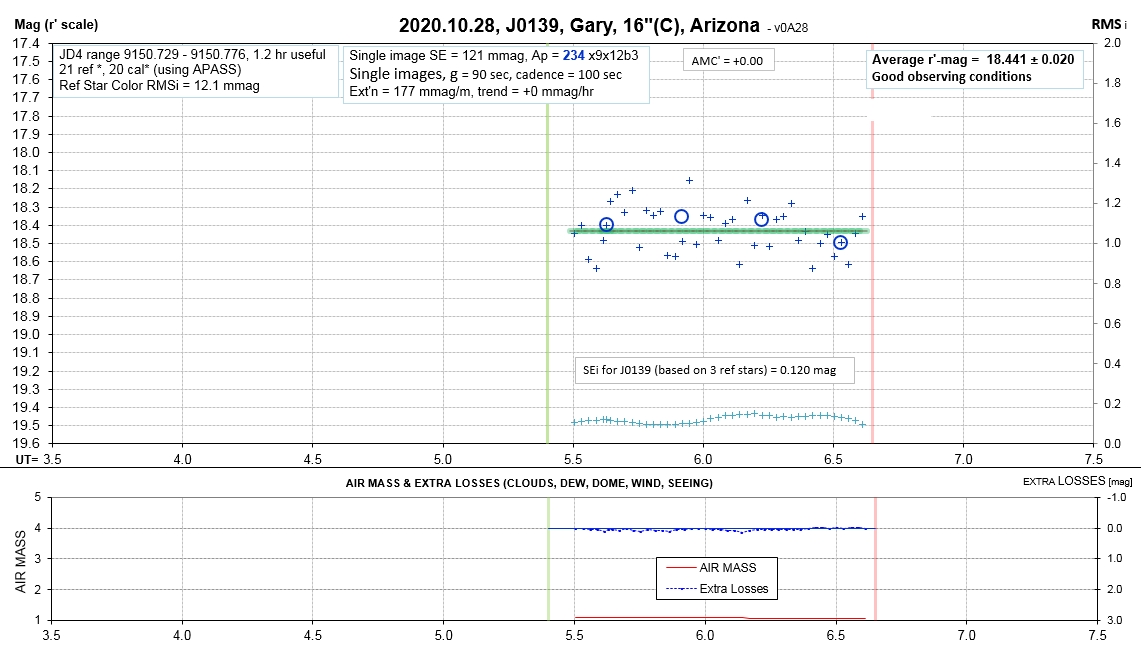
2020.10.24
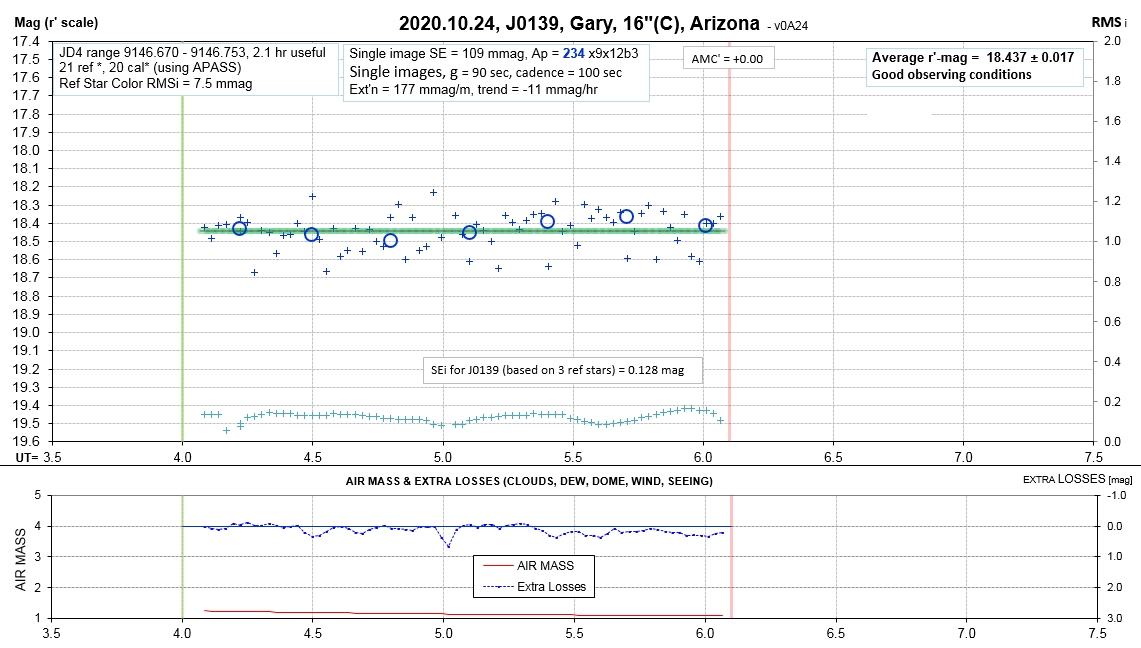
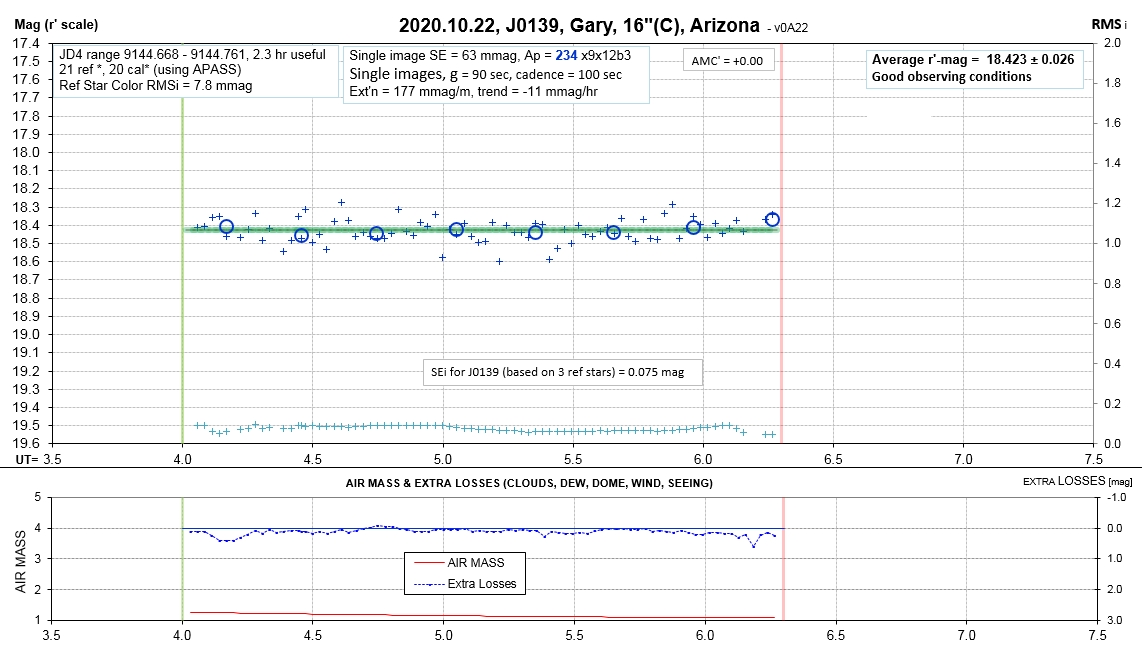
2020.10.19
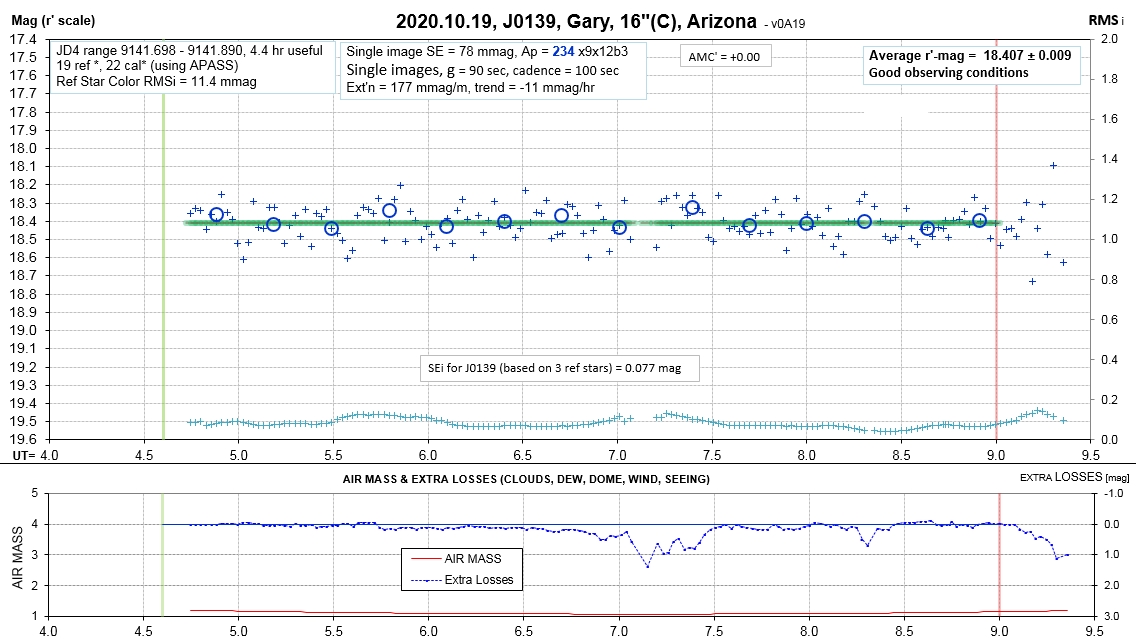
Disregard the date in the title.
Weighted average = 18.385 ± 0.020
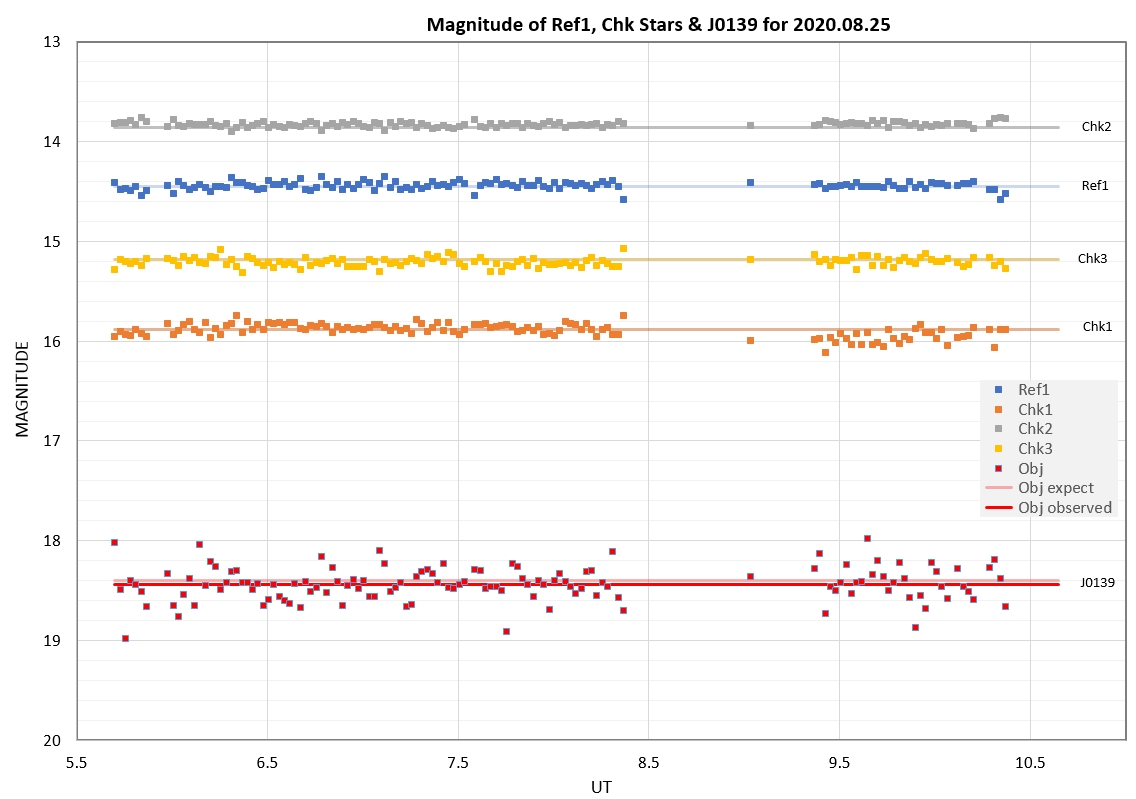
Starting now, 2020.08.25, I will use a different image procedure
procedure. It emphasizes the small photometry aperture
measurements.
_________________________________________________________
end of "Winter 2020"
______________________________________________________________________
Finally, some good weather!
Very windy, so systematic error is likely.
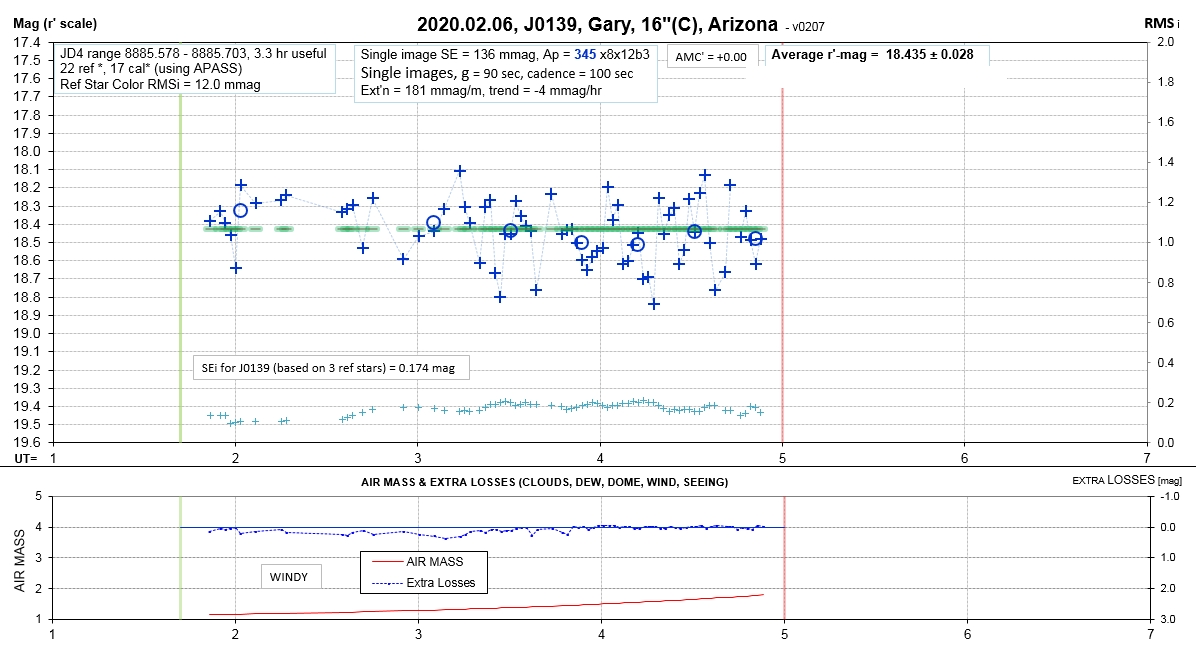
Very windy, so systematic error is likely.
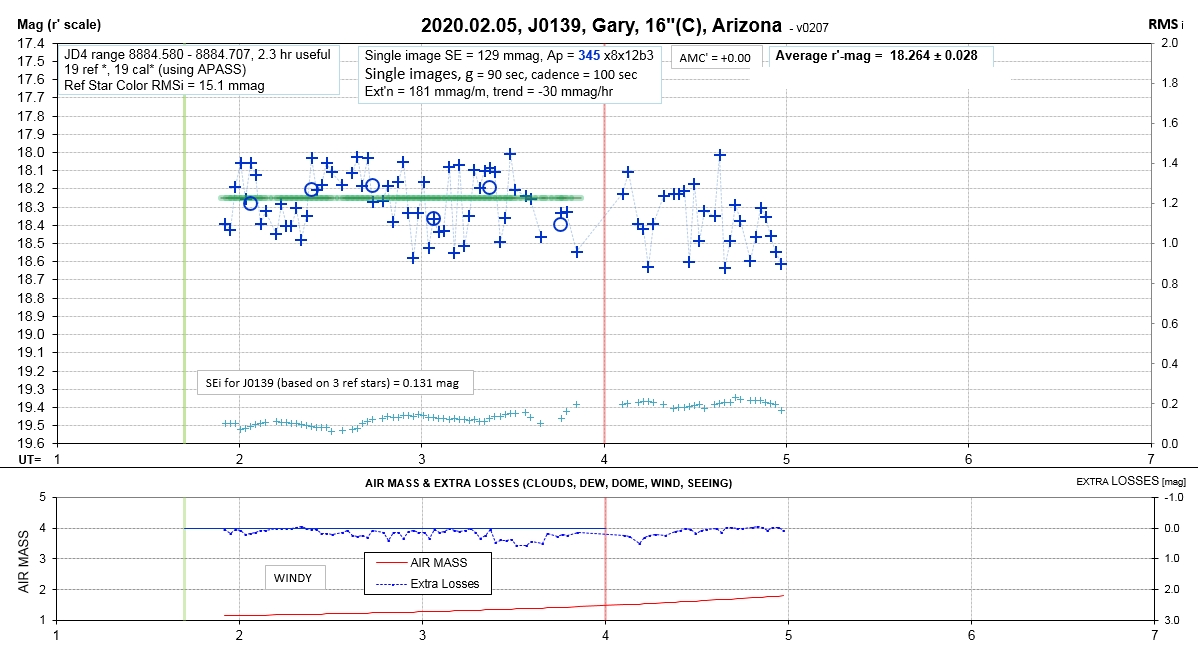
Very windy, so systematic error is likely.
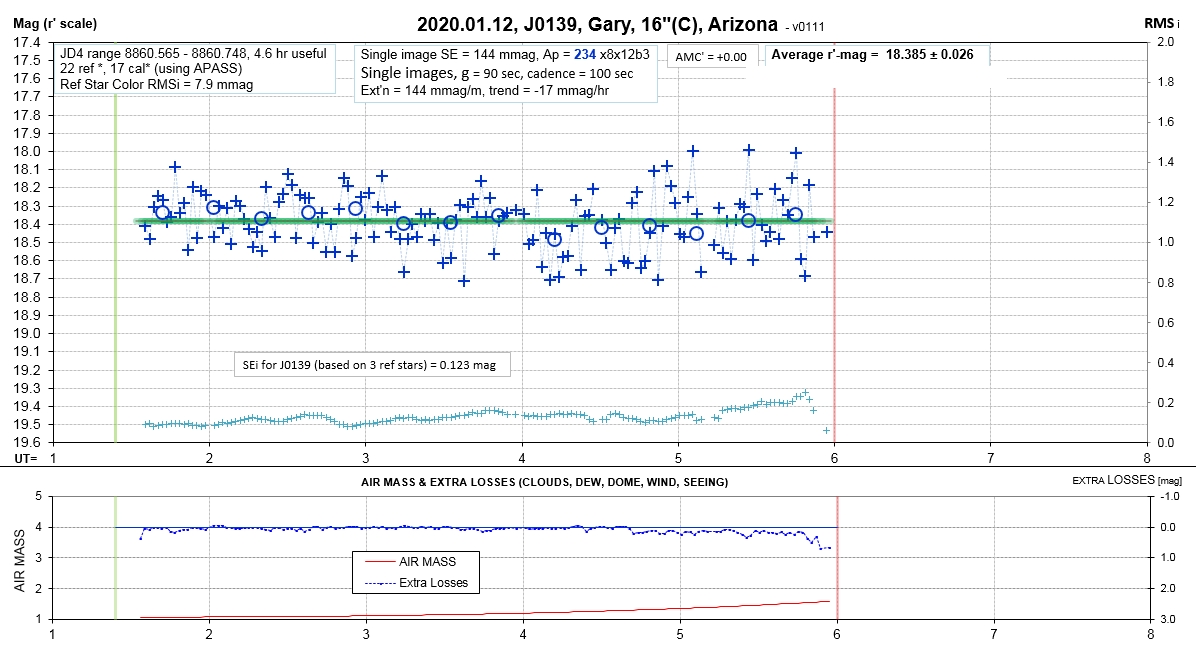
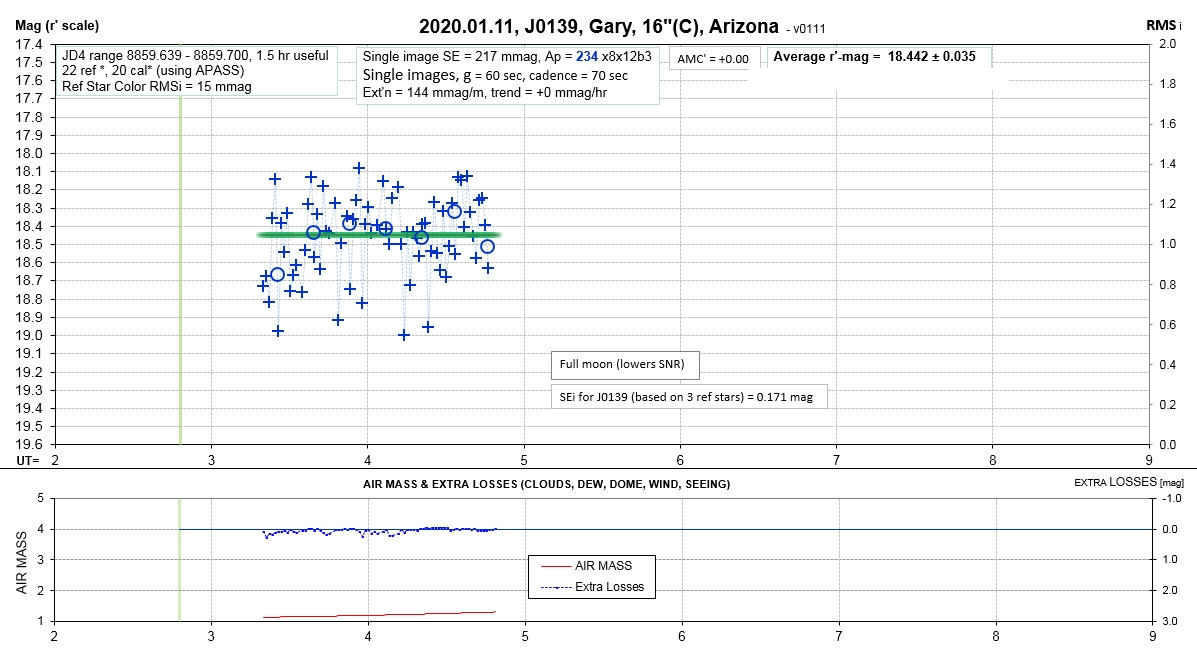
2020.01.11
___________________________________________________
PREVIOUS DIP
____________________________________________________
Need someone else's LC to know if this sinusoidal variation is
real.
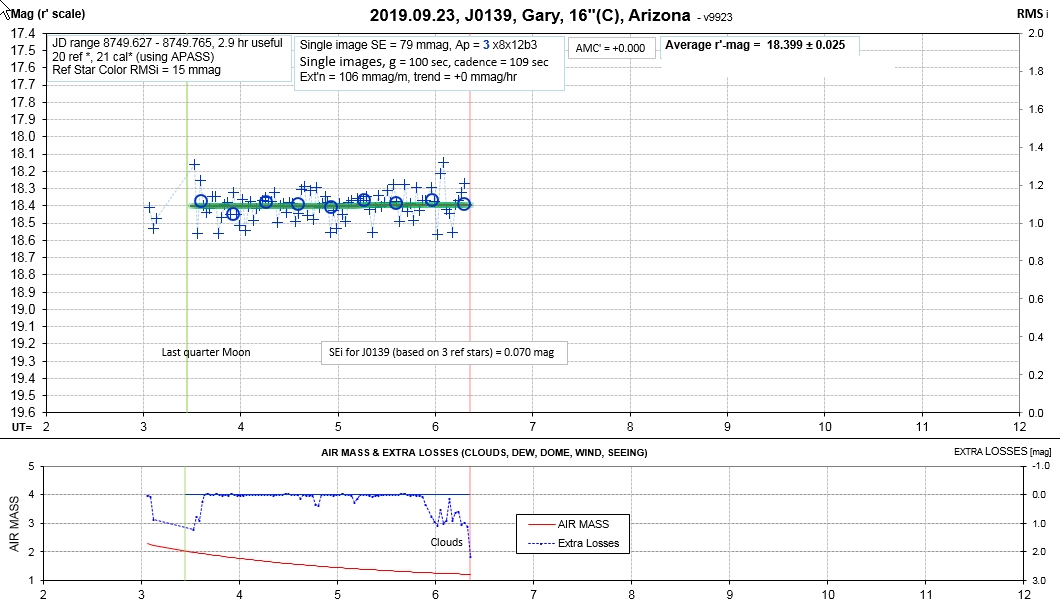
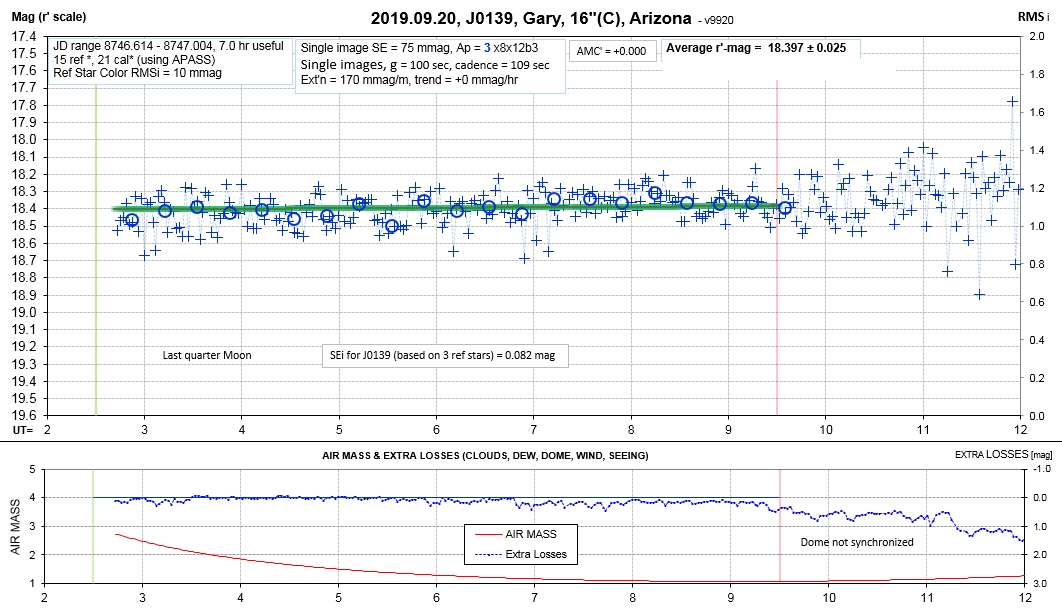

Still no evidence for target variability during observing
session.


Still no evidence for variability during observing session.
Could this be a pulsation?
v
J0139 is located at RA/DE = 01:39:06.2 +52:45:37.
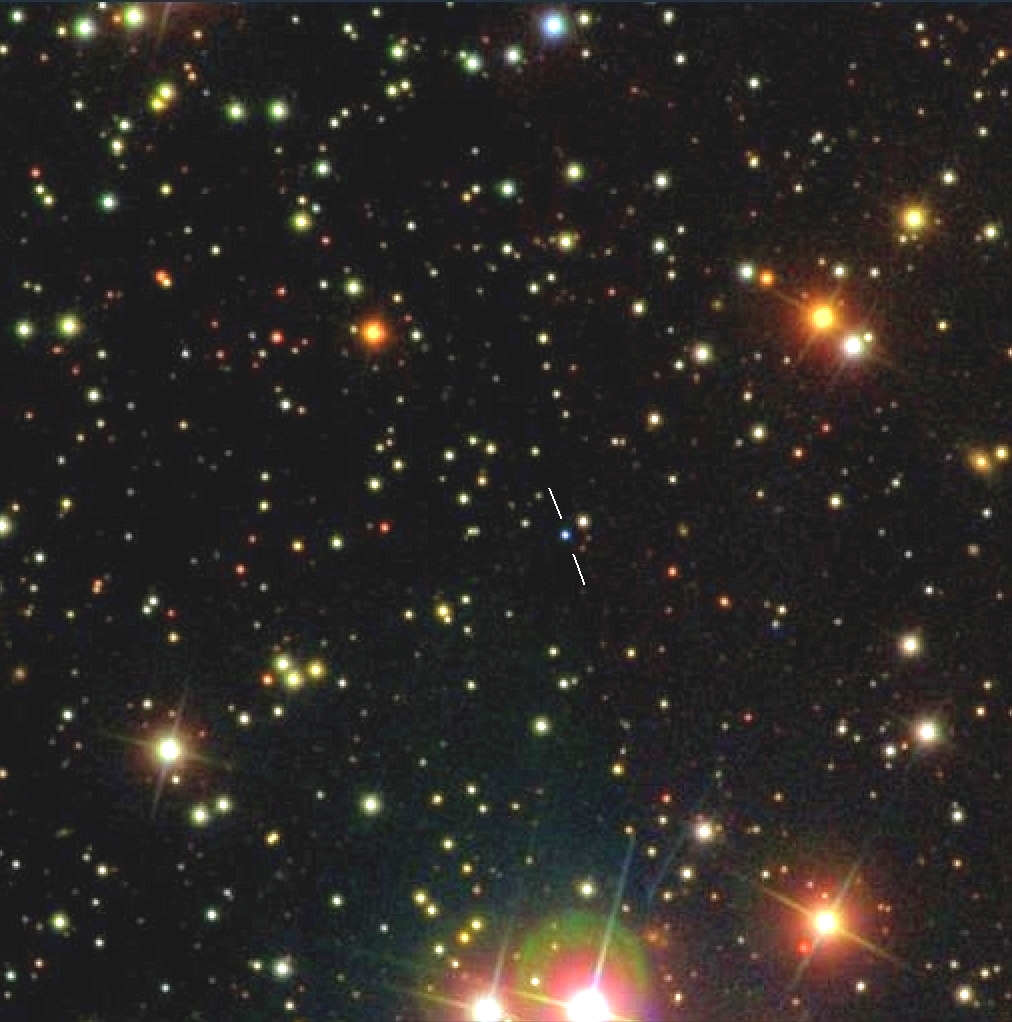
Figure F1. SDSS image, northeast upper-left.
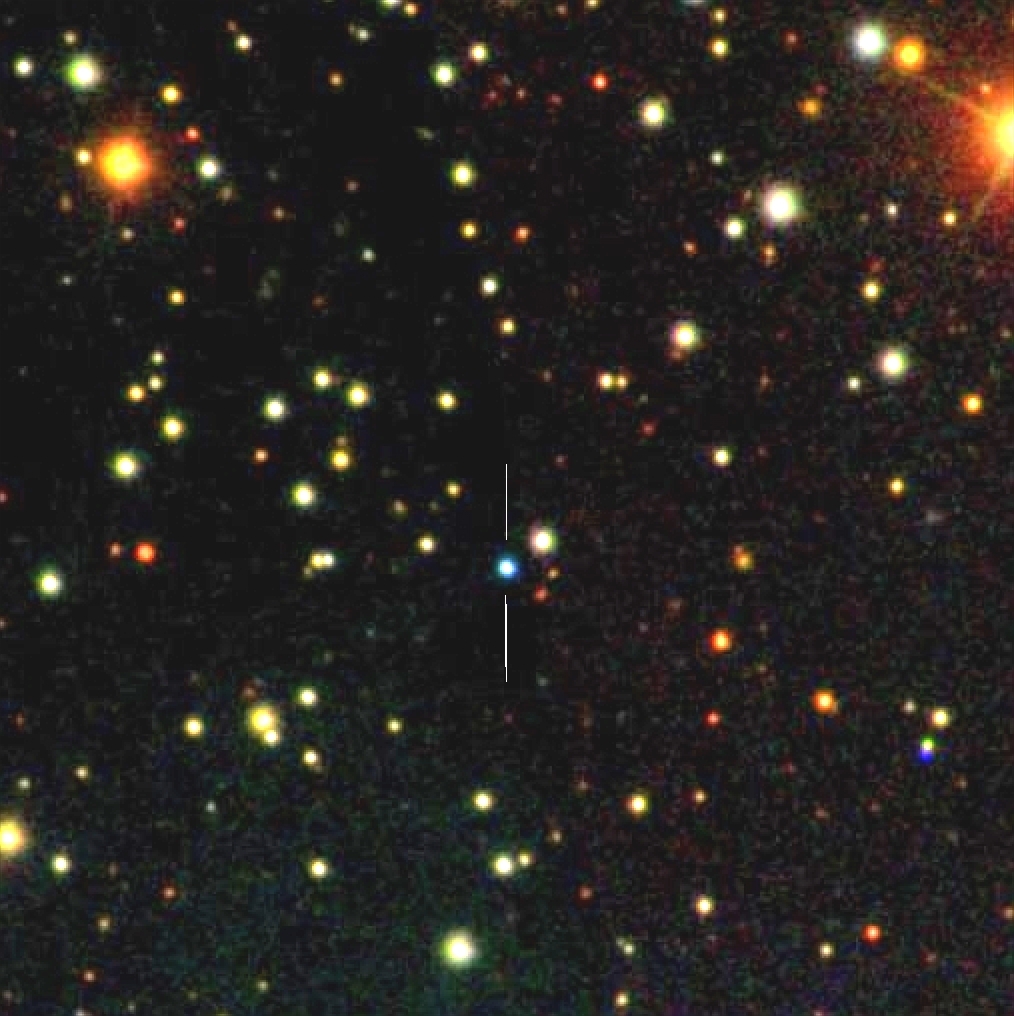
Figure F3. SDSS image.
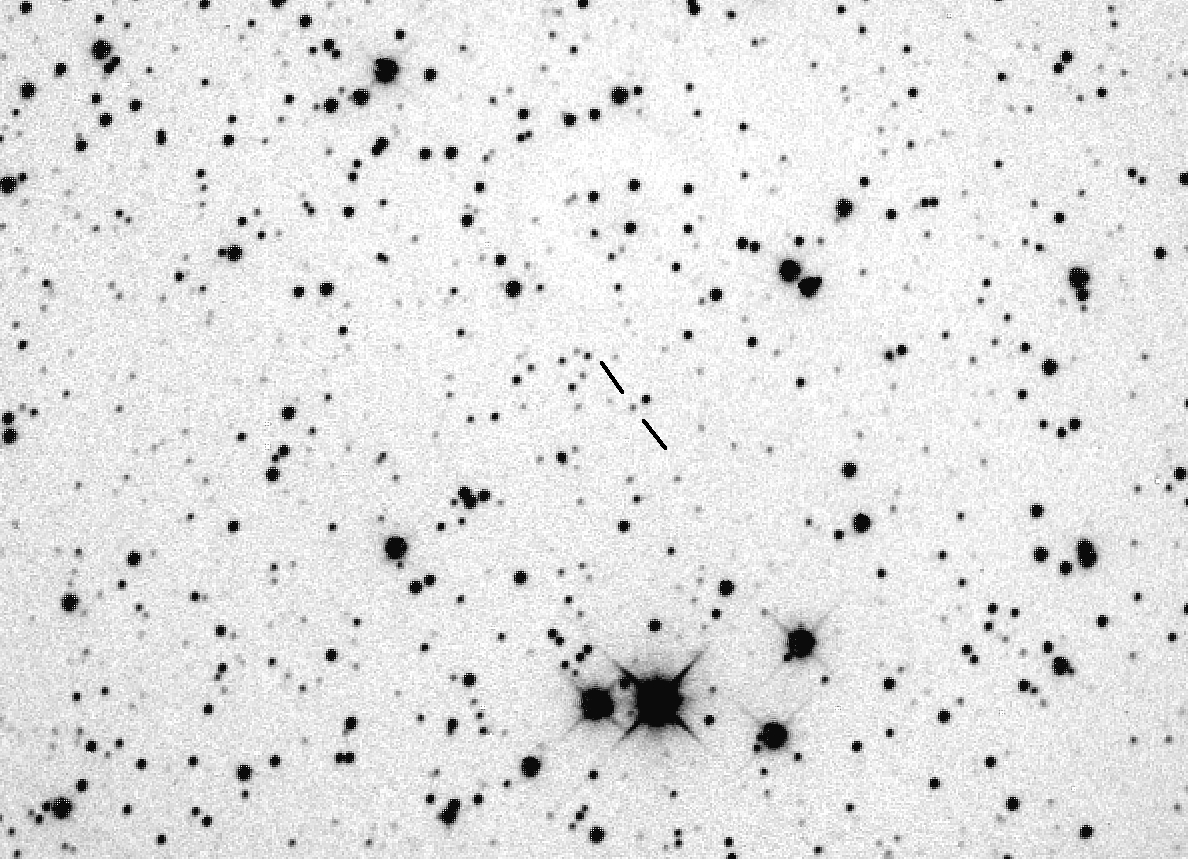
Figure F3. Image taken with my AstroTech 16" telescope.
FOV = 12.5 x 9.0 'arc, north up, east left.
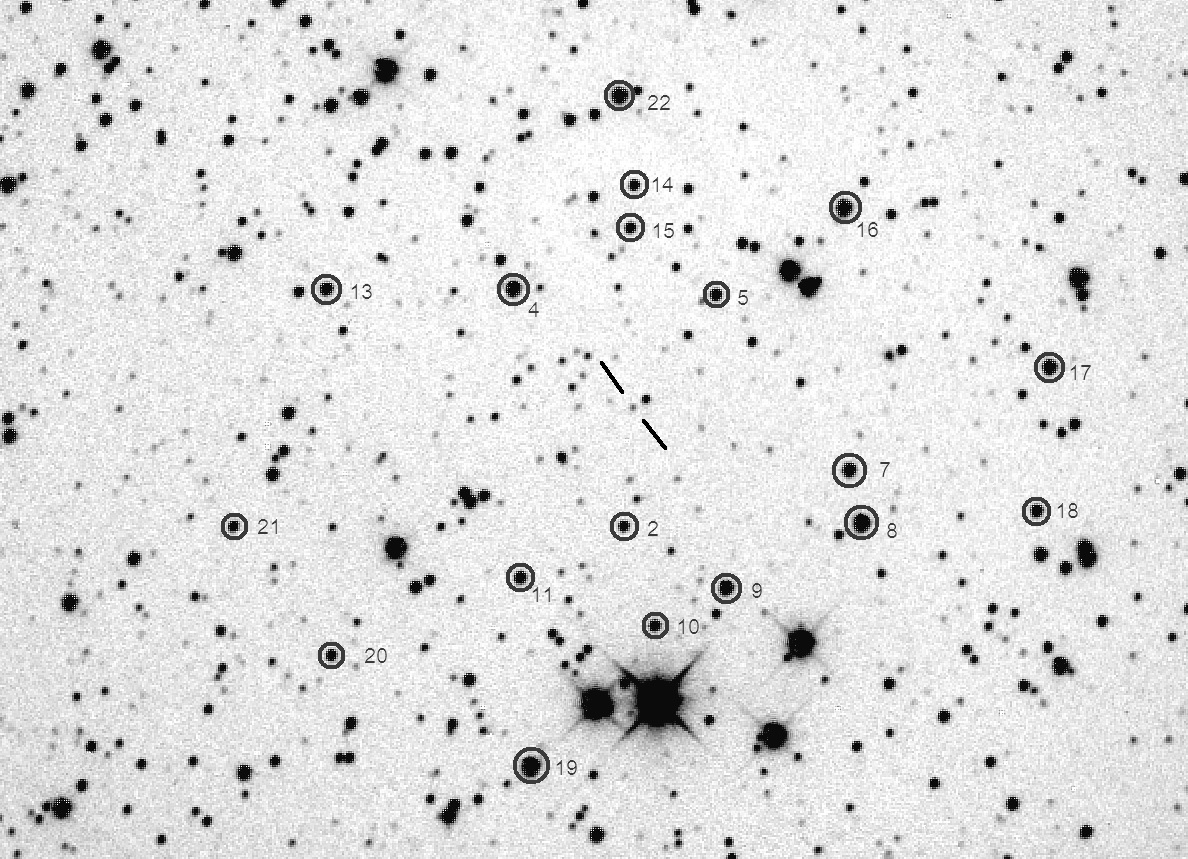
Figure F4. Some of the stars I use for reference.
See below for r'-mags that I've adopted for these stars.
| Star # |
r'-mag |
B-V-0.64 |
| 2 |
15.882 |
0.13 |
| 4 |
13.854 |
0.78 |
| 5 |
15.181 |
0.25 |
| 7 |
14.446 |
0.21 |
| 8 |
13.338 |
0.14 |
| 9 |
14.291 |
0.02 |
| 10 |
15.562 |
0.25 |
| 11 |
15.014 |
0.20 |
| 13 |
14.692 |
0.41 |
| 14 |
15.770 |
0.25 |
| 15 |
15.704 |
0.25 |
| 16 |
13.560 |
0.65 |
| 17 |
14.167 |
-0.02 |
| 18 |
15.088 |
0.58 |
| 19 |
12.828 |
0.22 |
| 20 |
15.852 |
0.25 |
| 21 |
15.887 |
0.19 |
| 22 |
13.495 |
-0.17 |
Observing and
Analysis Tips for this Target
The target star, J0139, is faint (V = 18.4) so unfiltered is the
best option. However, consider that the target is bluer than all
nearby reference star candidates. The combination of "unfiltered
with very blue target" means that systematic offsets will differ
for each observer (because each observer's unfiltered effective
wavelength will be different). Therefore we should expect that
comparing measurements from different observers will require
determination of an empirical offset for each observer. This is
easy to do. To maximize the usefulness of this process it will be
important that each observer adopt a FOV placement that is the
same every night (so that flat field systematics, which everyone
has, are the same for each observing session). Also, use the same
reference stars every night.
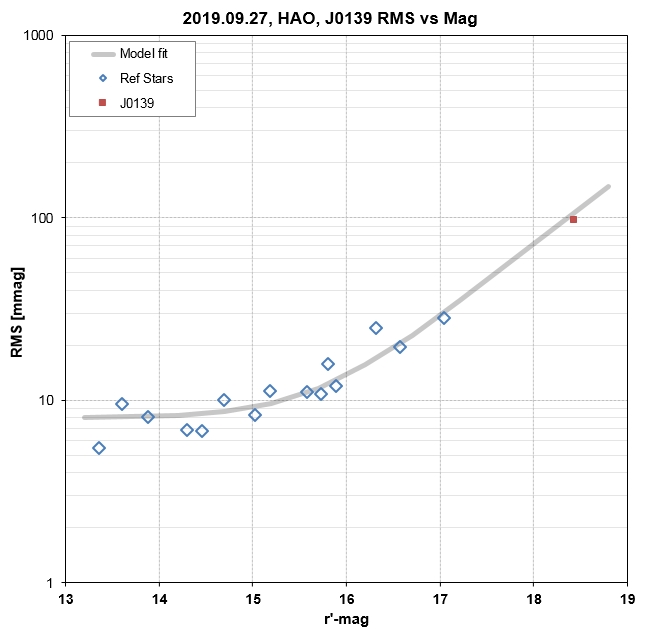
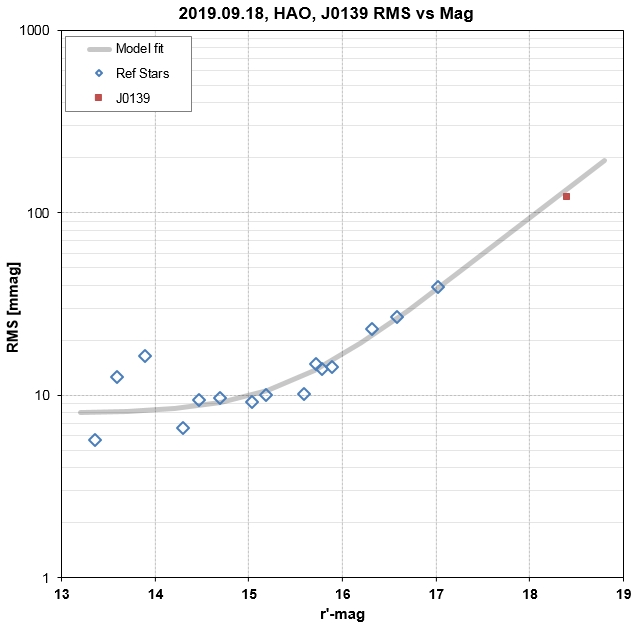
The goal is "day timescale" variations, not hourly or
shorter timescale variations. With a 14" telescope, unfiltered, no
full moon, 100-second exposures will yield SNR per image ~ 10
(i.e., 10 % SE). This SE per image is large compared with all
other systematics. For example, scintillation is typically 5 to 10
mmag per image, or 0.5 to 1.0 %. It is also not necessary to keep
the star field fixed with respect to the pixel field throughout
the night to minimize flat field variations during an observing
session.
The most important tip is to choose photometry setting carefully
and stick to them for processing every observing session.
This is because there's a brighter star close to the target star
(9 "arc away), as shown in the next image. The danger we want to
avoid is for atmospheric seeing changes to cause some of the flux
of the brighter star from entering the signal circle and making
the target star appear brighter than it is. If one observing
session has bad seeing compared to another, there's a risk of the
target reading for that night to be influenced by the nearby star.
My rule of thumb is to choose a signal aperture radius that places
the circle less than halfway to the interfering star.
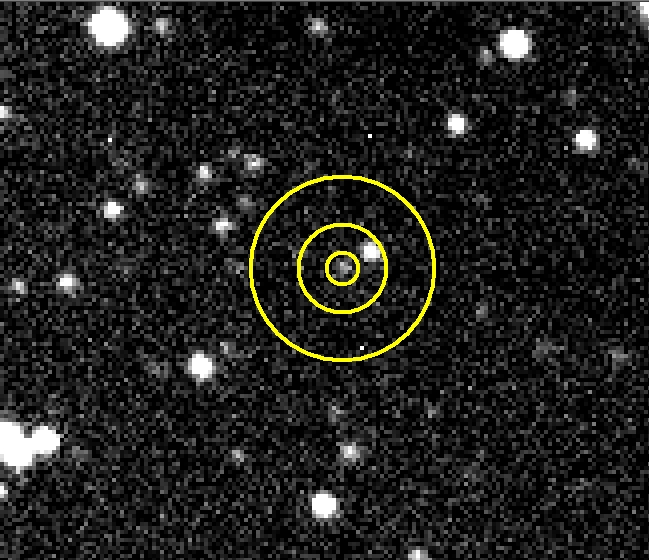
As an aside, you'll note three "hot pixels" in the above image.
One of them is in the background annulus. This is OK because it
will be ignored (by MaxIm DL, and presumably any other good
quality photometry program). Hot pixels inside the signal circle
cannot be tolerated, so placement of the FOV should take this into
account.
My Collaboration Policy
Please don't ask me to co-author a paper! At my age of 80
I'm entitled to have fun and avoid work. Observing and
figuring things out is fun; writing papers is work. If my data
is essential to any publication just mention this in the
Acknowledgement section.
Veras, Dimitri, Catriona H. McDonald and Valeri V. Makarov,
"Constraining the Origin of the Planetary Debris Surrounding ZTF
J0139+5245 Through Rotational Fission of a Triaxial Asteroid,"
https://arxiv.org/abs/2001.08223
Vanderbosch, Z., J. J. Hermes, E. Dennihy and 8 others, arXiv: https://arxiv.org/abs/1908.09839
Related Links
Wikipedia
description of J0139
WD1145 photometry
monitoring
Resume
____________________________________________________________________
This site opened 2019.08.30.