WD 1202-024 Photometry
B. Gary, Last updated 2016.07.05, 17 UT
Introduction
WD 1202-024 (hereafter WD1202) was discovered from Kepler K2
observations by Andrew Vanderburg to exhibit abrupt fades at
intervals of 71.2361 minutes. Due to the Kepler 30-minute exposure
times the depth and duration of eclipses were greatly distorted.
Modeling by Saul Rappaport suggested very short duration (~ 4
minutes) and very deep depths (<5%). Saul asked me to try to
observe with my 14" HAO telescope using much shorter exposure
times. On 2016.12.27 I used 120-second exposures to show that
in-transit brightness was at least 4 (and probably >5)
magnitudes fainter than out-of-eclipse (i.e., depth > 97%, or
in-eclipse brightness < 3%). The simplest explanation is that
this is a binary star consisting of a white dwarf and brown dwarf
in an orbit so small that the brown dwarf could be close to
filling its Roche lobe and on the verge of spilling mass on to the
WD (i.e., becoming a cataclysmic variable). Teff of ~22,000 K and
~2500 K have been suggested in order to account for the >
50-fold drop in brightness during eclipse. This web page is
currently password protected until a decision is made to write an
article about it.
Links on this Web Page
Basic info (event
schedule)
Phase-folded
light curves
Image stacking
results
Some implications
from photometry
Light curve
observations (detailed)
Finder image
Related
external links
arXiv article https://arxiv.org/abs/1705.05863
Basic Info for WD1202
RA/DE = 12:05:15.8 -02:42:22 (J2000).
V-mag = 18.82
Eclipse ephemeris: 2457758.94307(20) + E ×
71.230027(90)/1440 based on ground-based observations
Eclipse ephemeris: 2457582.40178(6) + E ×
71.229894(216)/1440 based on inclusion of both ground-based and
Kepler data (Rappaport, 2017.01.30)
(The two P derivations differ by 0.000269(183)
min, so they are statistically compatible
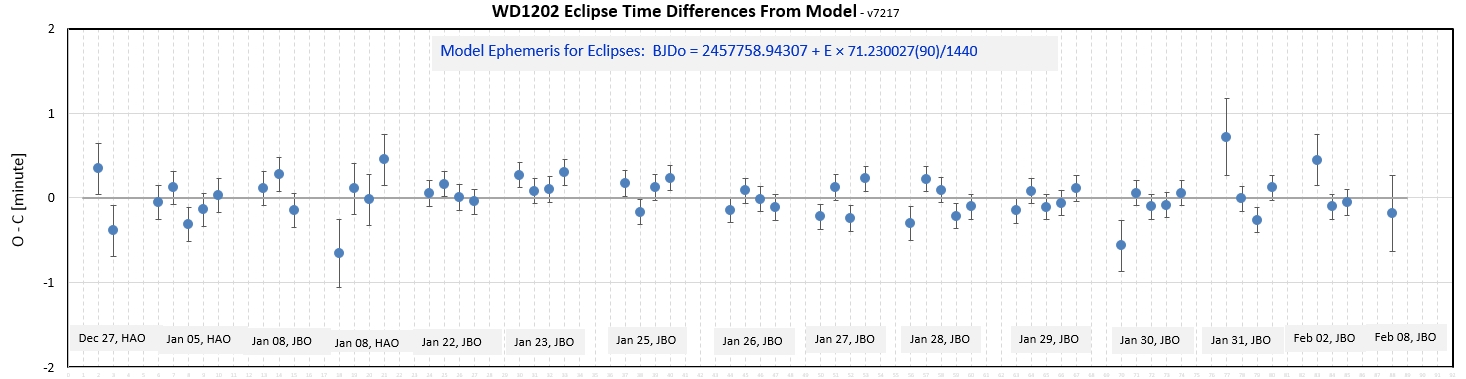
Figure 1. Eclipses occur at expected times.
Phase-Folded
Light Curves
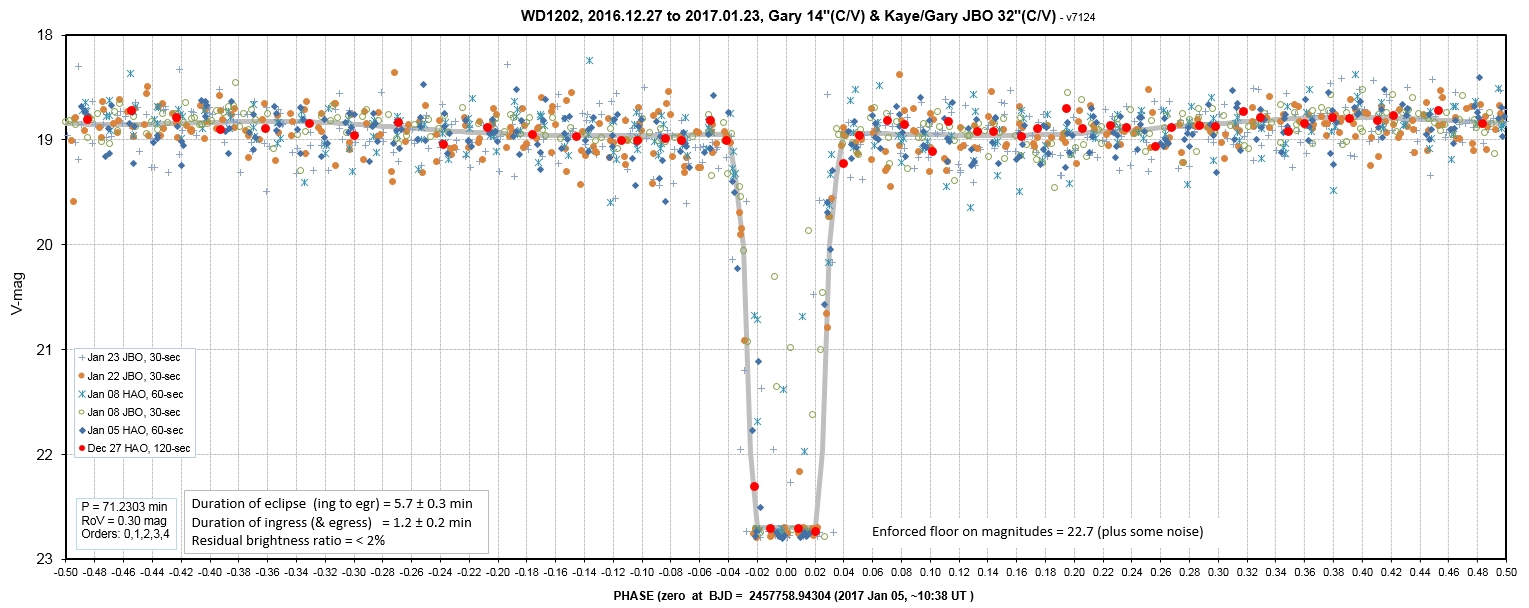
Figure 1. Six observing sessions are phase-folded
using the ephemeris described above. Most of the in-eclipse
measurements were below limiting magnitude, so in this graph
I've arbitrarily boosted them to 22.7 (plus some noise for
display clarity). The model fit is described below.
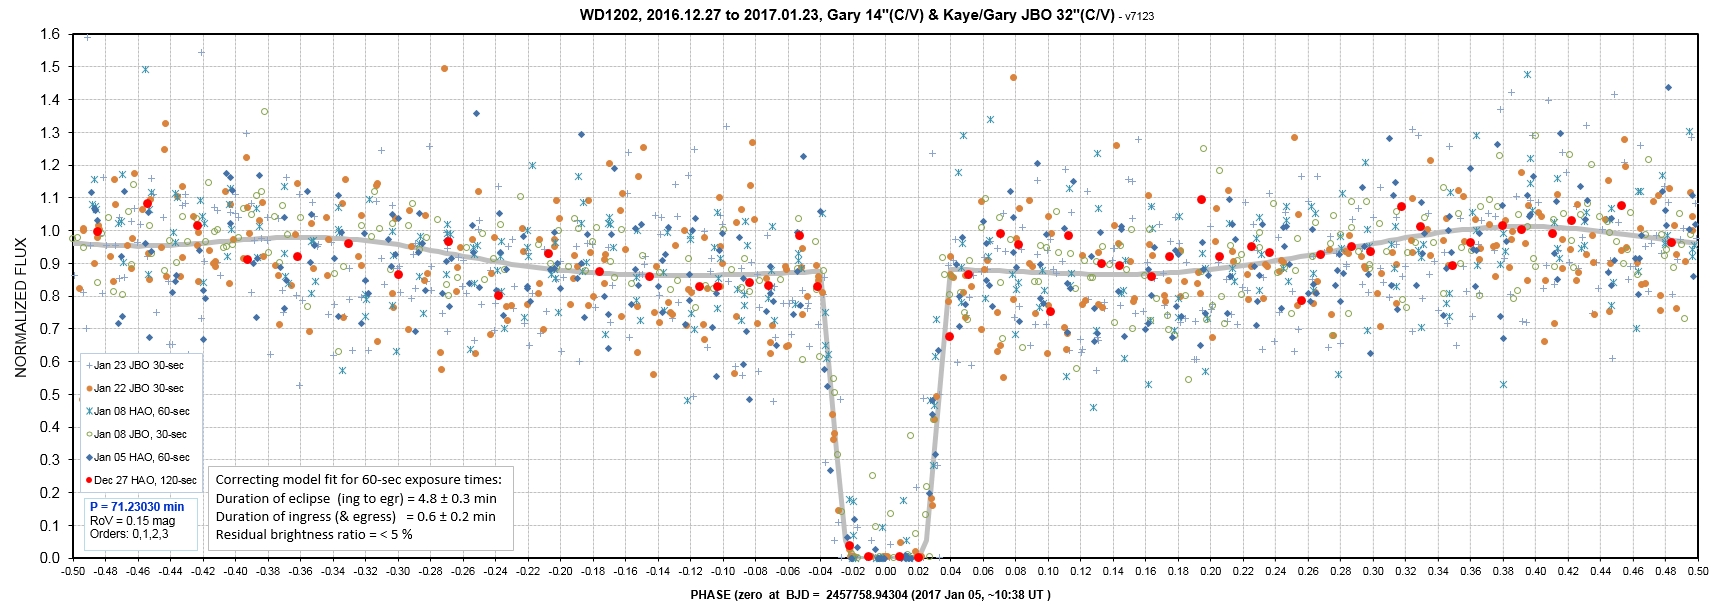
Figure 2. Same data as above, but changed to
"normalized flux" using V-mag = 18.8 for OOT. One advantage of
plotting normalized flux instead of magnitude is that measurement
uncertainty has the same appearance for all levels of target
brightness in a normalized flux plot, while for a magnitude plot
the uncertainty should appear more spread out for the lower
brightness levels. This is especially important when brightness
level changes by large ratios, and when uncertainties are large
for much of the data - both of which apply to the WQD1202
phase-folded LC. The model is an "eyeball fit" of an arbitrary
brightness model (non-physical) that employs a trapezoid fit to
the eclipse. The out-of-eclipse variability is fitted by a 3rd
order polynomial. The "in-eclipse" brightness level is
estimated to be < 5 %.
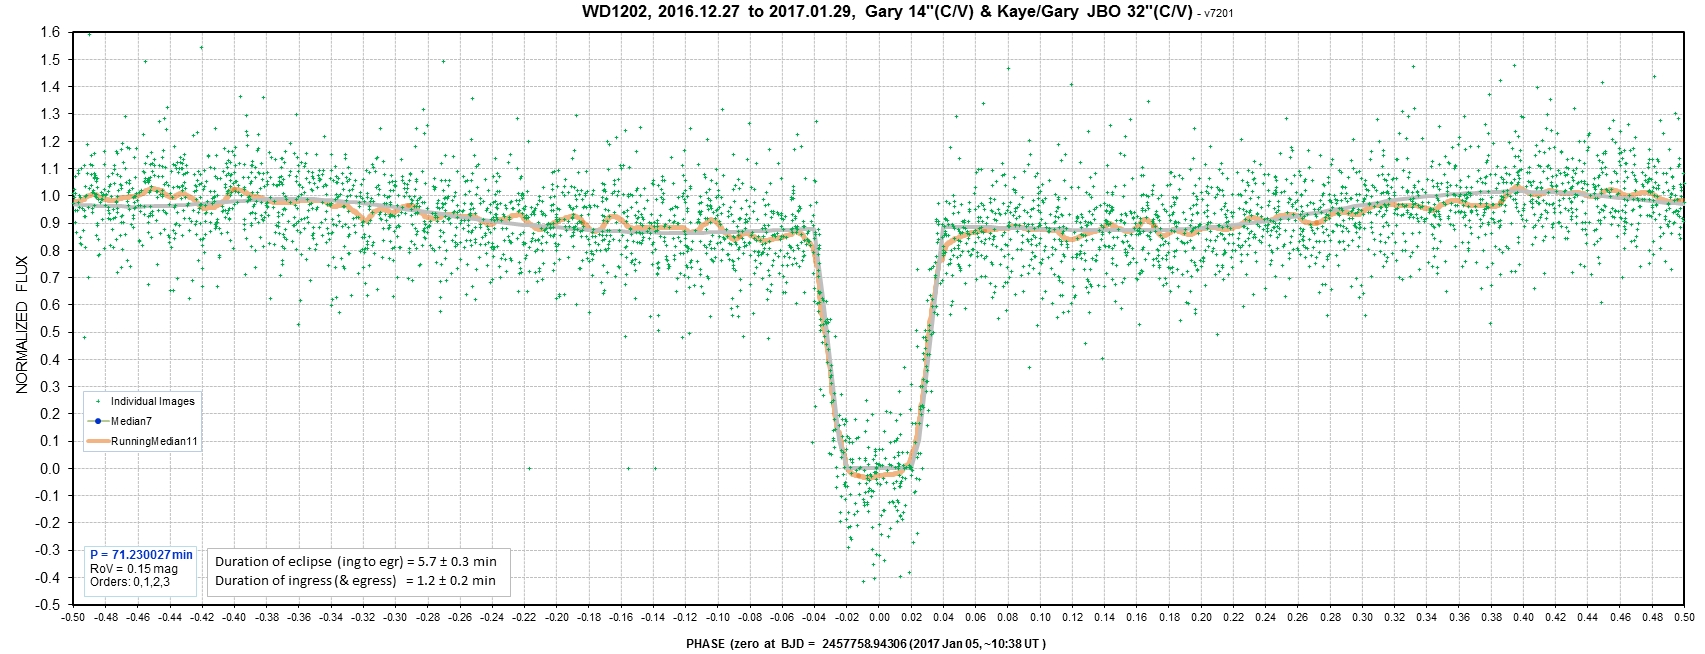
Figure 3a. Same data as above (plus 5 later dates).
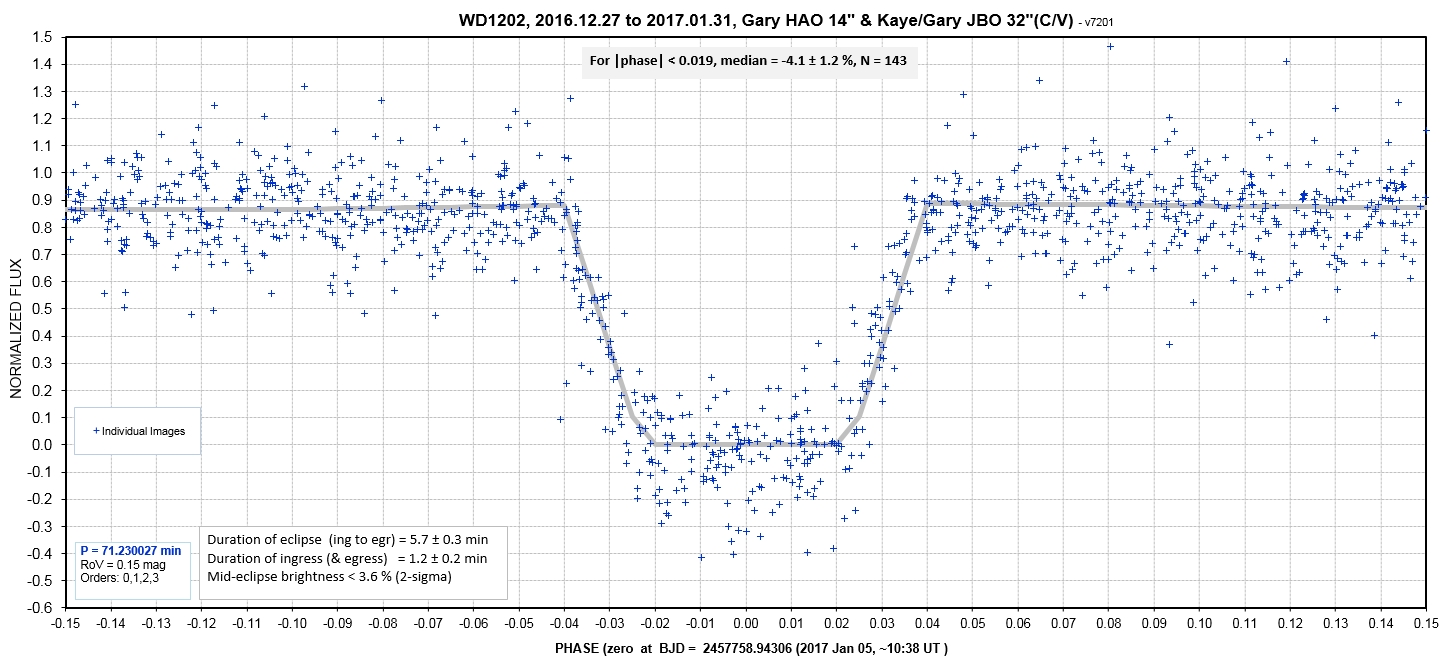
Figure 3b. Same data as above, i.e., undithered and
dithered observing data, showing only the eclipse phase region.
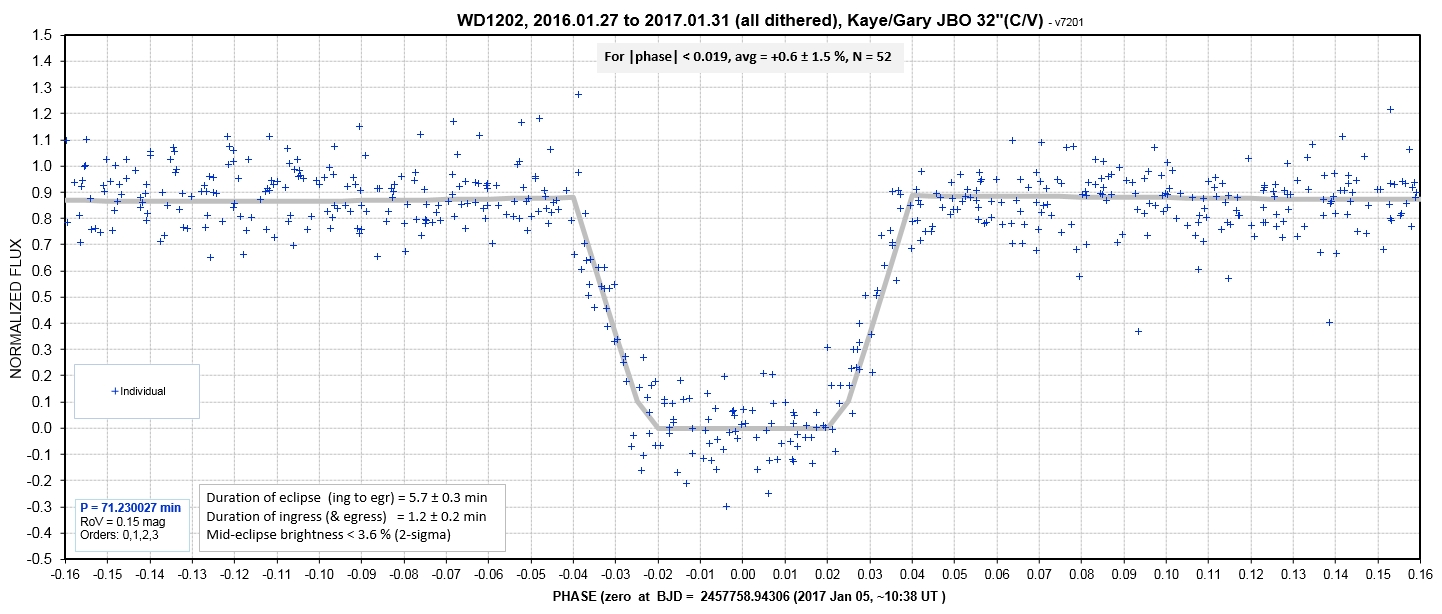
Figure 3c. Showing only data that was observed
in a "dithered" manner for the eclipse region. The
size of the WD can be estimated from the duration of ingress
(and egress), 1.2 minute. The size of the larger and cooler
star can be determined from the width of the eclipse bottom,
5.7 - 2 × 1.2 = 3.3 min.
Image
Stacking
All images with mid-exposure time within 1.2 minutes of an ephemeris
eclipse were identified and averaged in groups corresponding to an
observing session. None of the 4 eclipse groups had a measurable
star at the WD1202 pixel location, so each eclipse group was
measured for limiting magnitude in the vicinity of WD1202 using a
photometry aperture radius of 4 pixels (typical for what was used).
The 1-sigma magnitudes for the observing sessions (6C27-HAO,
7105-HAO, 7108-JBO and 7108-HAO) were V-mag = 22.0, 22.3, 22.3 and
22.1. An average of all HAO eclipse images, representing 24 minutes
of total exposure time, yields a 1-sigma limiting magnitude of 23.0.
Here's a comparison of an exposure average that includes WD1202 and
the 24-minute mid-eclipse exposure.
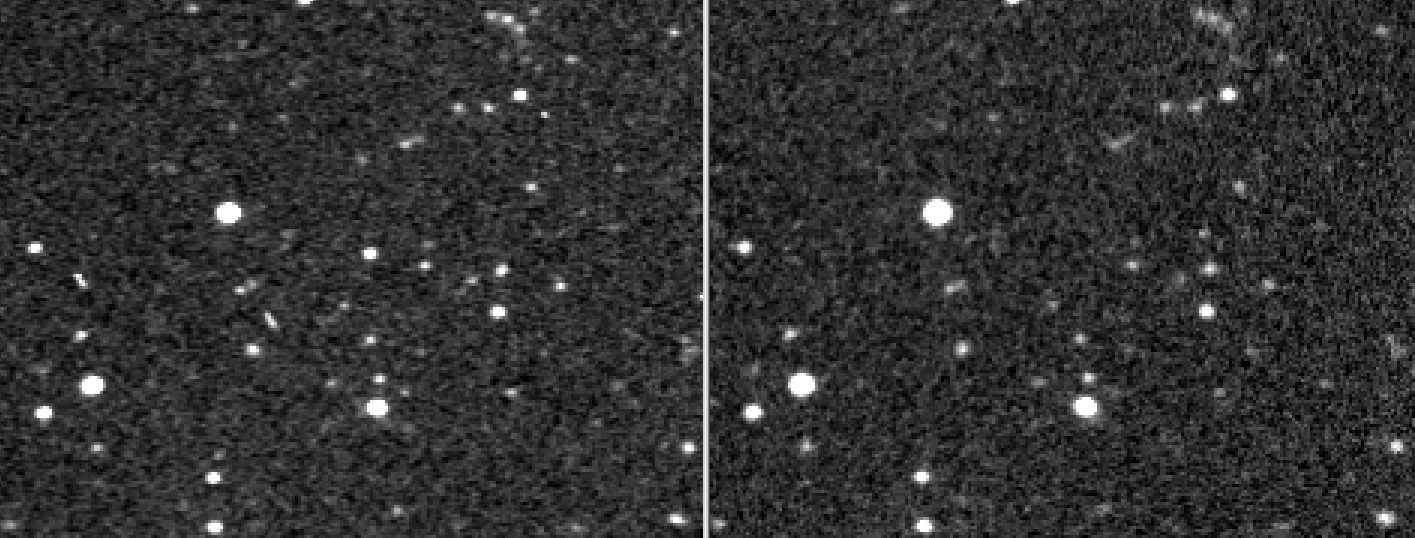
Figure 4a. Now you see it (left), and then you don't
(right). The left panel is an average of 22 images representing a
total exposure time of 24 minutes, with a 1-sigma limiting
magnitude of V-mag = 23.0.
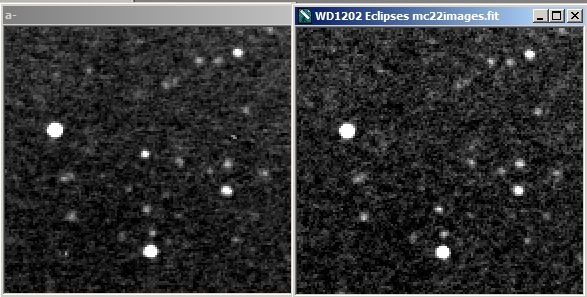
Figure 4b. JBO 32" images from 2017.01.22. 22
30-second images during "in eclipse" were averaged (right panel),
and a similar number at times surrounding the eclipse times were
also averaged (left panel). The 1-sigma noise level for the
photometry aperture used for measuring WD1202 brightness was 22.5.
Normalized flux at the WD1202 location was -0.09 ± 0.04
during eclipse.
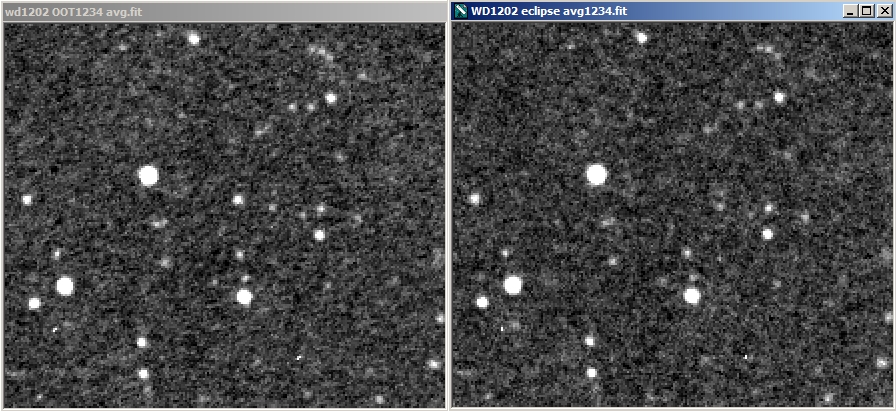
Figure 4c. JBO 32" images from 2017.01.23. 21
30-second images during "in eclipse" were averaged (right
panel), and a similar number at times surrounding the eclipse
times were also averaged (left panel). The 1-sigma noise level
for the photometry aperture used for measuring WD1202 brightness
was 21.8. Normalized flux at the WD1202 location was -0.12 ±
0.04 during eclipse.
A similar procedure for the JBO observations also shows
nothing at the WD1202 location, but due to the presence of only a
total exposure time of 4 minutes the 1-sigma limiting magnitude is
V-mag = 22.3.
The change in brightness from out of eclipse to mid-eclipse is >
4.2 magnitudes, which corresponds to a ratio of > 48. In other
words, mid-eclipse is < 2% as bright as out of eclipse!
Some Implications
from Photometry Observations
How can we interpret the < 2% mid-eclipse brightness ratio
finding?
First, we have to know how our telescope system responds to photons
at different wavelengths. Since most of the observations reported
here were made with the HAO 14" I show transmission functions, and
the CCD QE, for that system.
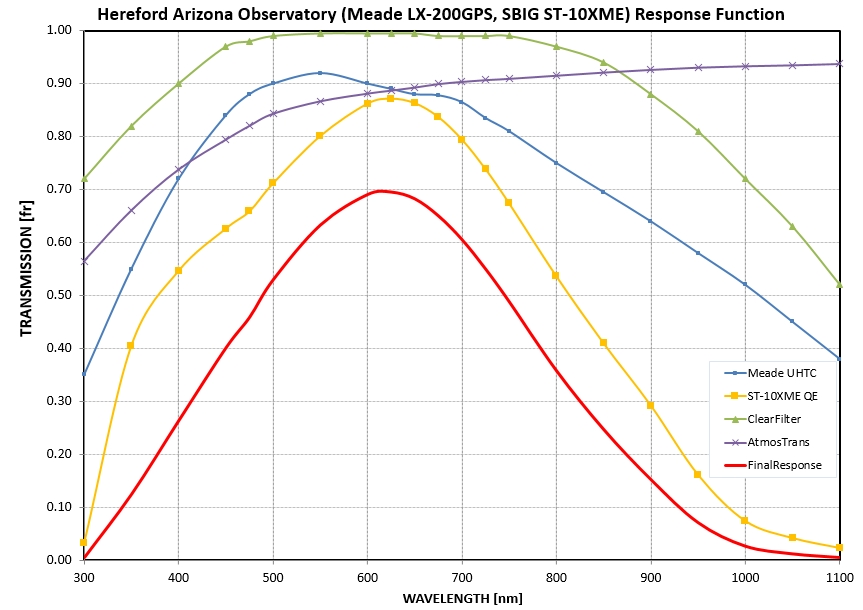
Figure 5. Transmission functions of the Meade 14"
telescope optics, the atmosphere (zenith) and the CCD QE, versus
wavelength.
The figure above can be thought of as a plot of the probability that
a photon at a specific wavelength will be counted during an
exposure.As expected, and by design, photons at ~ 600 nm (r'-band,
or between V-band and Rc-band) have the highest probability of being
counted.
Let's assume that the WD1202 companion is a brown dwarf (BD) with
T_eff = 2000 K, and also that the WD's T_eff = 22,640 K. The
effective wavelengths for the two components are quite different, as
shown in the next graph.
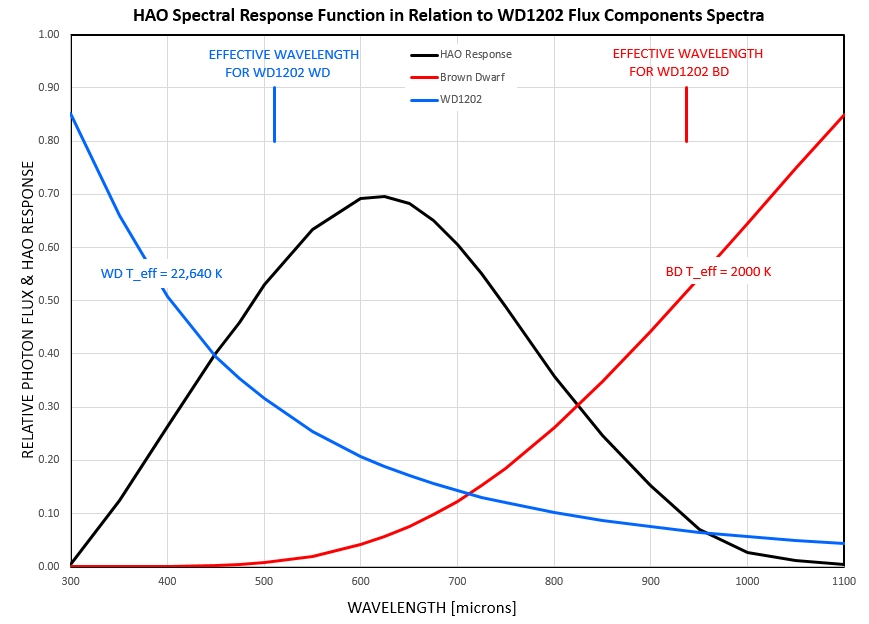
Figure 6. HAO spectral response function in relation to
likely flux spectra of the two WD1202 components. Effective
wavelengths for the WD and BD components are 510 nm and 937 nm
(when T_eff for the BD is 2000 K).
Two subtleties about the above figure should be mentioned. 1)
For the WD and BD spectra the y-axis corresponds for to photon flux
per unit wavelength interval, not power (watts/m^2). 2) Changing the
BD's T_eff changes the effective wavelength as observed with the HAO
telescope system. This is taken into account in subsequent analyses.
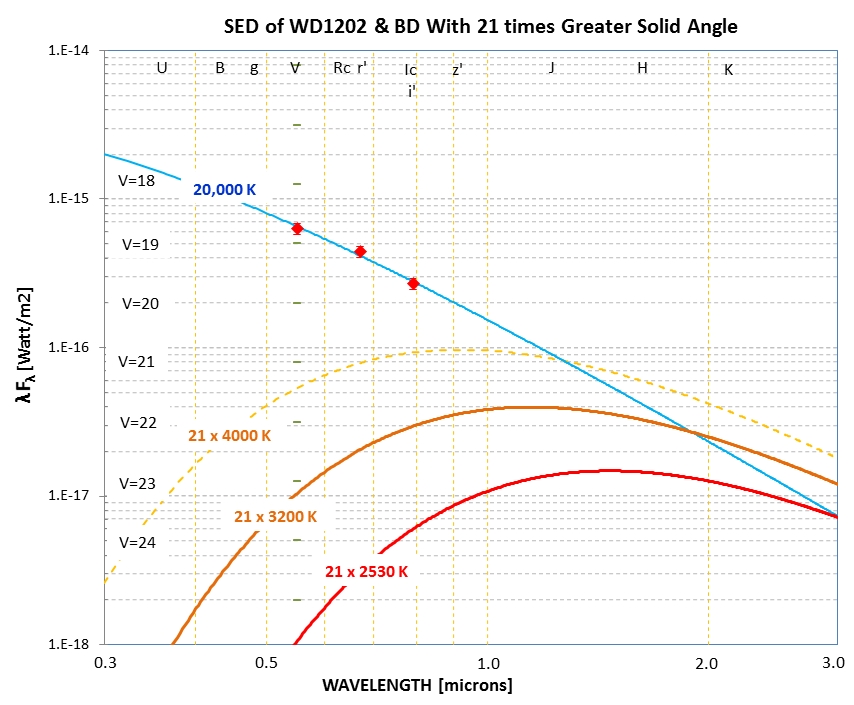
Figure 7. Spectral Energy Distributions for the WD and
BD, for three T_eff's for the BD. The BD is assumed to have a
solid angle 21 times greater than the WD (i.e., radius ratio of
4.5). The BD is expected to be hotter on the side facing the WD.
The above figure illustrates how the SED for the WD + BD system
could change during a 71-minute orbit. During an eclipse the cold
side of the BD is facing Earth, and very little flux is contributed
by the BD. Half an orbit later the hot side of the BD is facing
Earth, and this produces a measurable increase in total flux. This
is an explanation for the quasi-sinusoidal variation of total flux
for the out-of-eclipse portion of the light curve. If the BD was the
same size as the WD its spectrum would be plotted ~40 times lower
than shown. In that case the BD spectrum could not account for its
apparent brightness at the effective wavelength of 0.93 nm to be ~1%
of the WD's brightness at its effective wavelength of 0.51 nm.
Since we rally don't know the BD's T_eff, the next graph shows the
relationship for BD diameter vs. BD T_eff for a selection of 3
mid-eclipse brightness ratios.
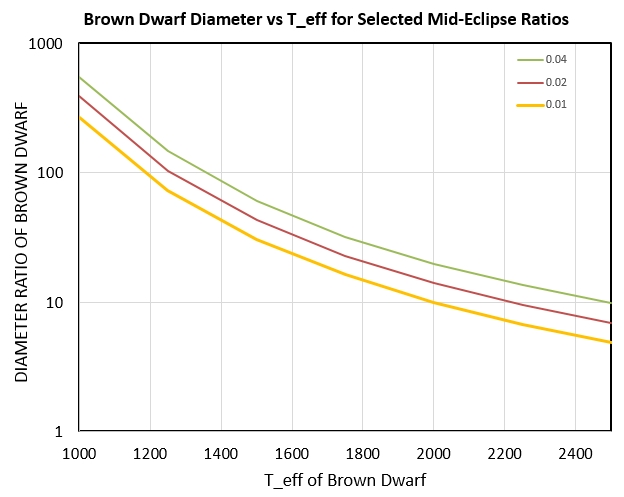
Figure 8. BD diameter vs. BD T_eff for three mid-eclipse
brightness ratios.
If w knew the mid-eclipse brightness ratio we could choose a
trace in the above figure to work with. For example, if the
mid-eclipse brightness ratio was 2% the middle trace states that if
the BD's T_eff were 2200 K, for example, it would have to have a
diameter of 10 times larger than the WD to produce the measured 2%
mid-eclipse ratio. Since we think the photometry measurements have
produced an upper limit for mid-eclipse brightness ratio of 2%, we
could state that if the BD's T_eff were 2200 K then it would have to
have a diameter less than 10 times the WD diameter.
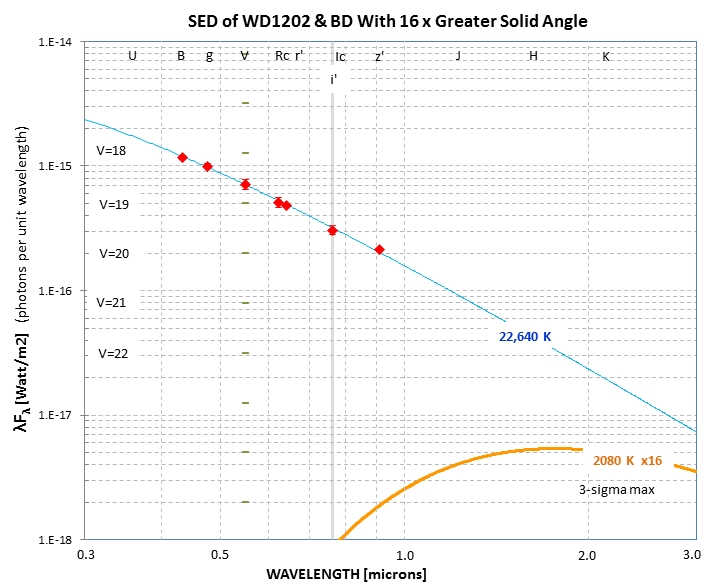
Figure 8b. SDSS-based mag's and a suggested
upper-limit to T_eff for BD (based on eclipse 3-sigma flux ratio
upper limit of 0.43).
I hesitate to do modeling of the sizes of the WD and BD, since
I'm "an observationalsit." However, like many observationalists, I'm
curious about what modelers do. So what follows is an amateur's
attempt to "model fit" the observations. Keep in mind that this is
"new territory" for me, so there may be some serious oversights in
what follows.
My goal was to find an acceptable solution for the WD and BD sizes.
I represented the WD and BD with xy matrices whose center locations
could be adjusted. Inclination was easy to represent since it
corresponded to a y offset of the BD matrix with respect to the WD
matrix. I ignored limb darkening. By counting the overlap of cells
in the two matrices I produced a measure of eclipse fraction. After
running the BD through x locations to produce a model eclipse, I
smoothed it with a 60-second boxcar, which renders it ready for
comparison with a LC taken with 60-second exposures. An estimate can
be made of the WD and BD sizes by noting the length of ingress (and
egress) and the interval between ingress and egress, provided a
separation distance between the WD and BD can be adopted. I derived
a separation distance by assuming masses of 0.30 and 0.075 Msun for
the WD and BD. This yields a separation distance, a = 2.84e8 meters.
The radii of the WD and BD can ber determined from simple geometry,
and is given by:
r_wd / a = pi × (PartialDuration / P)
r_bd / a = pi × (EclipseDuration -
PartialDuration) / P
where PartialDuration = Length of Ingress = Length of Egress = 1.2 ±
0.8 min, EclipseDuration = time of egress minus time of ingress =
5.7 ± 0.5 min, and P = period (71.2303 min). This yields r_wd =
0.022 ± 0.014 × R_sun and r_bd = 0.081 ± 0.013 × R_sun. The ratio of
sizes, BD / WD, is ~ 3.75.
I adopted i = 88 degrees (just for the fun of not using 90 deg.),
and produced a model that agrees quite well with the phase-folded LC
observations, as shown in the next figure.
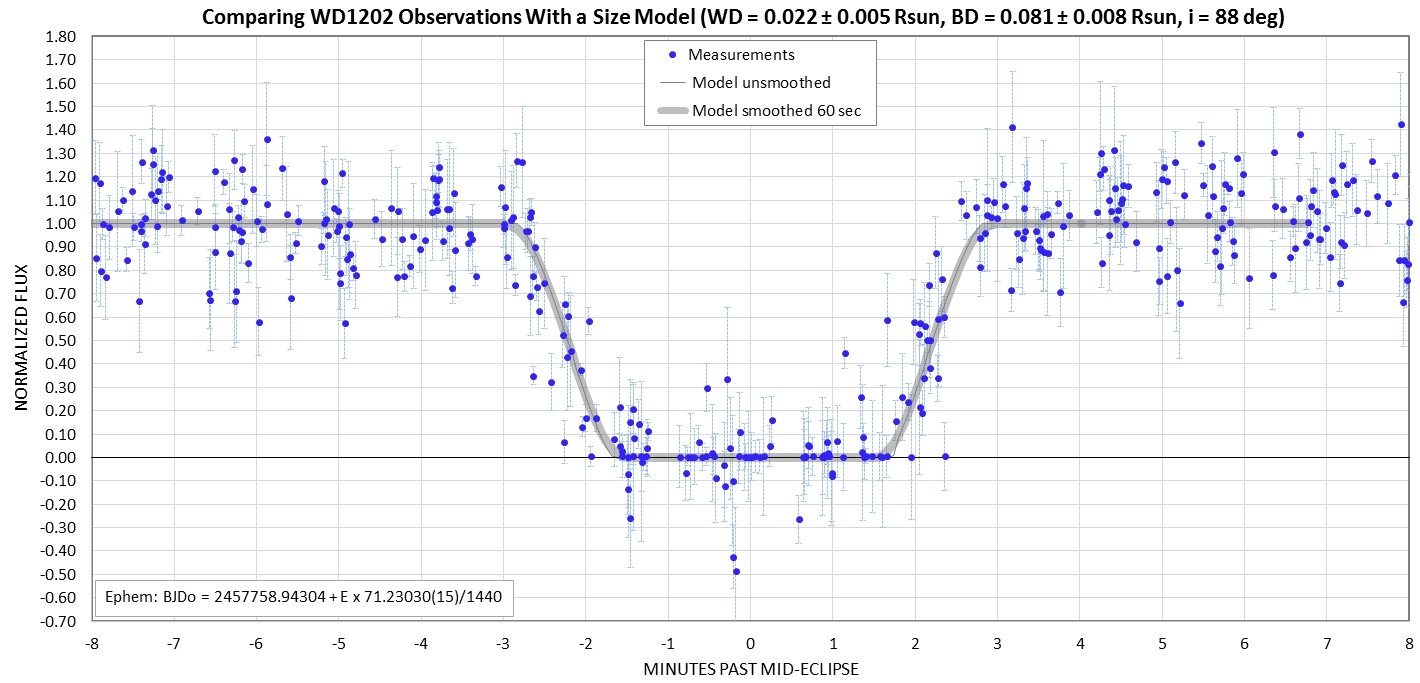
Figure 9. Simple-minded model fitted to the
observations, which suggests that the BD has a size of 0.081 ×
Rsun. This is 3.7 times the WD size of 0.022 × Rsun.
[This is an old plot, not using all recent data. Stay tuned.]
Notice the unimportance of smoothing (with the 60-second
boxcar). This means that it's not necessary to observe with exposure
times < 60 seconds.
With such a small size for the BD, in relation to the WD, it's
unsurprising that no flux is measured during mid-eclipse.
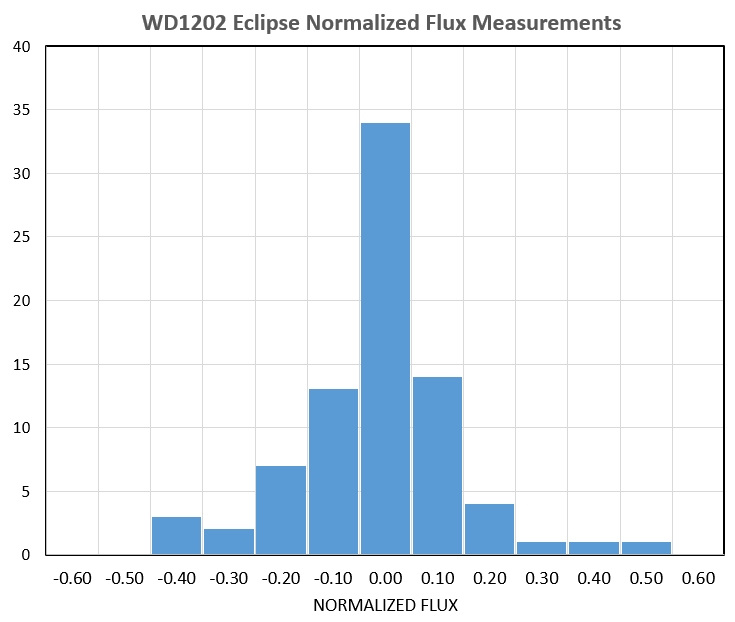
Average mid-eclcipse normalized flux = -0.012 ± 0.017. Median =
+0.003.
Light
Curve Observations
2017.03.25 Gary/HAO B & g'
2017.02.27 Gary/HAO
2017.02.26 Gary/HAO
2017.02.10 Gary/HAO i'
2017.02.02 Kaye/Gary JBO
2017.01.31 Kaye/Gary JBO
2017.01.30 Kaye/Gary JBO
2017.01.29 Kaye/Gary JBO
2017.01.28 Kaye/Gary JBO
2017.01.27 Kaye/Gary JBO
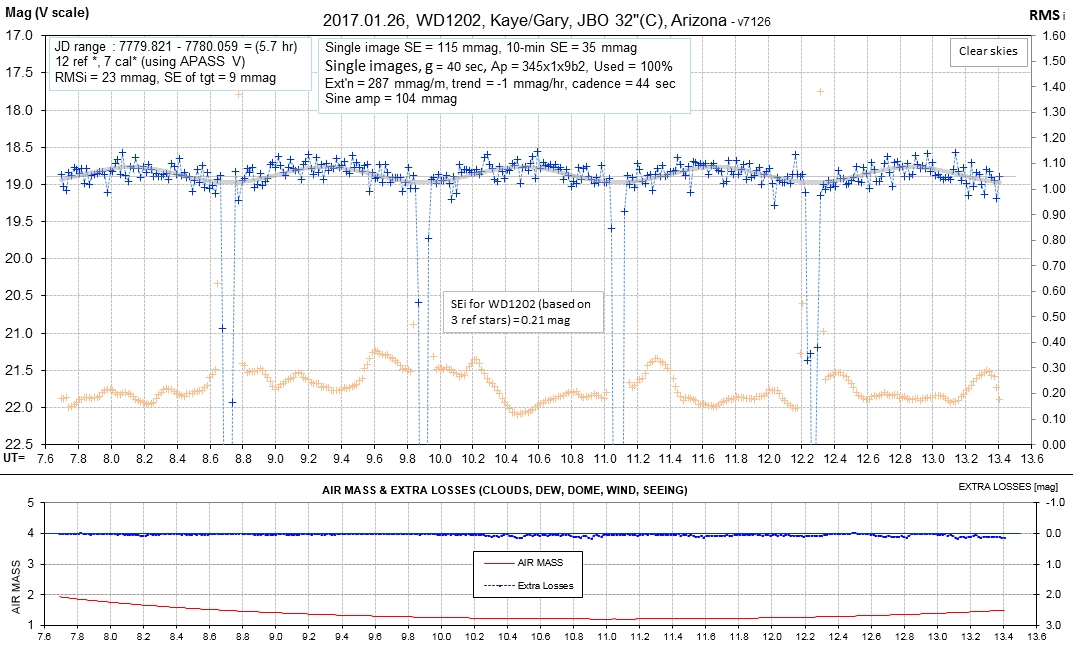
2017.01.26 Kaye/Gary JBO
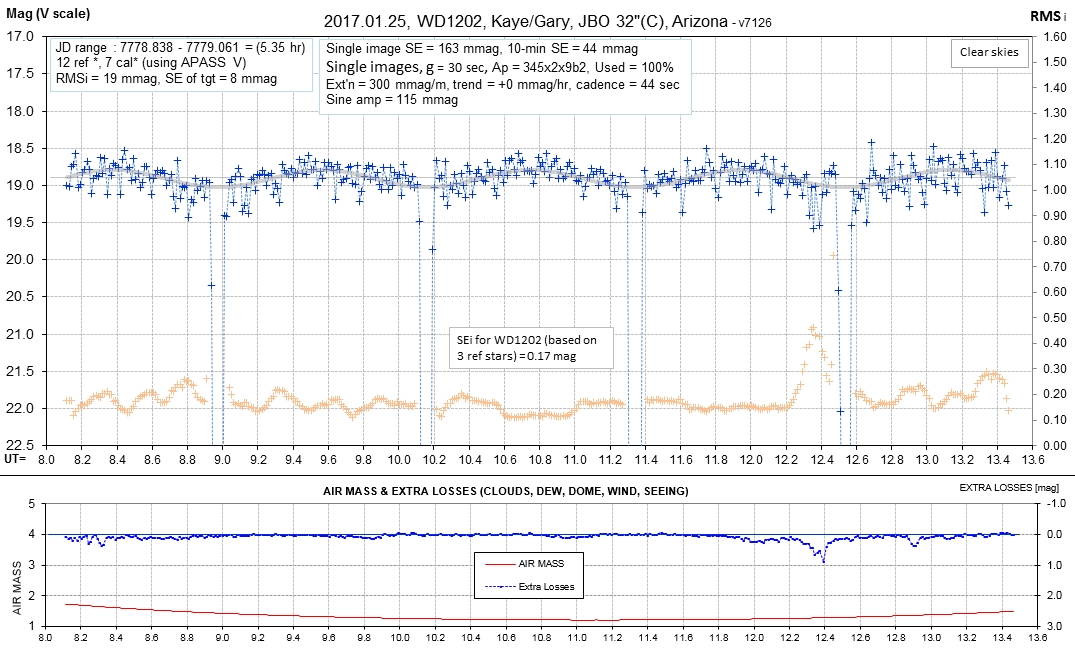
2017.01.25 Kaye/Gary JBO
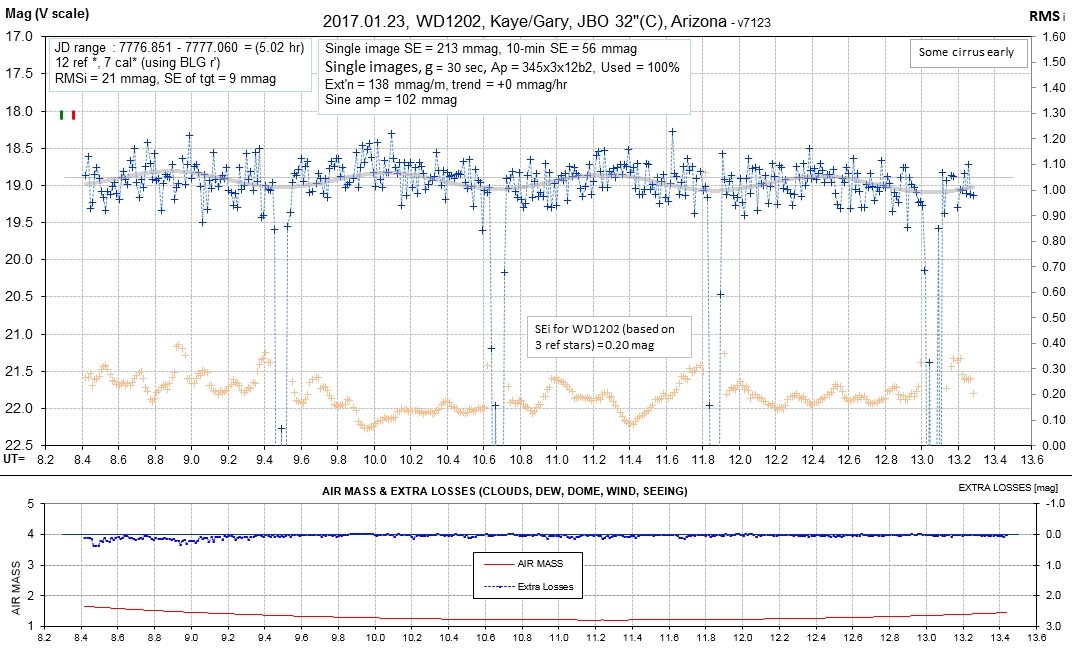
2017.01.23 Kaye/Gary JBO
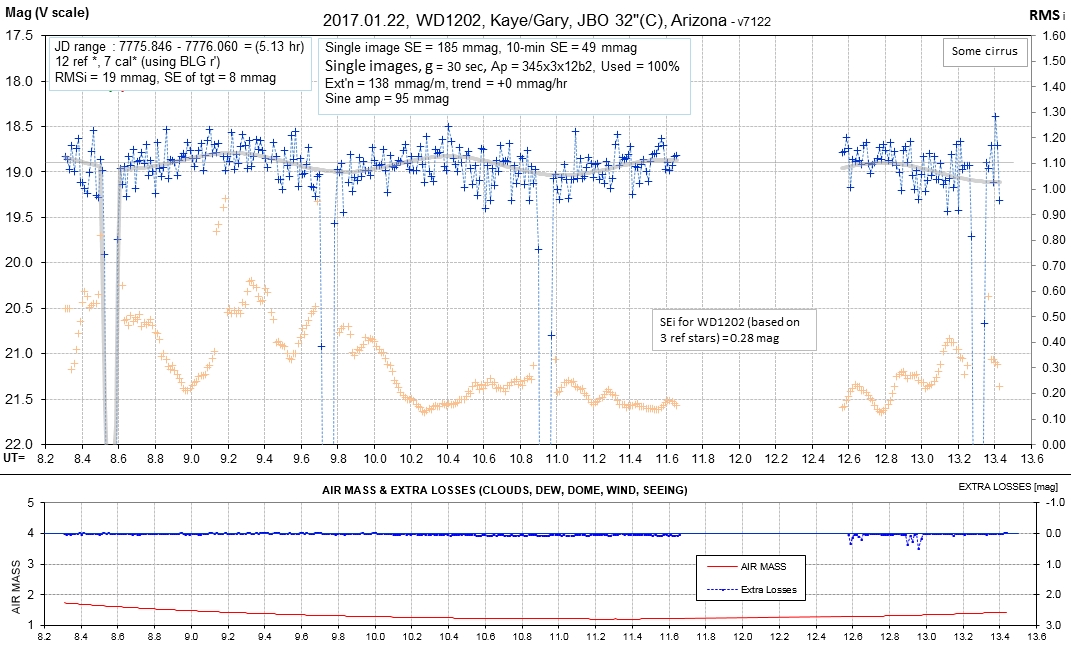
2017.01.22 Kaye/Gary JBO
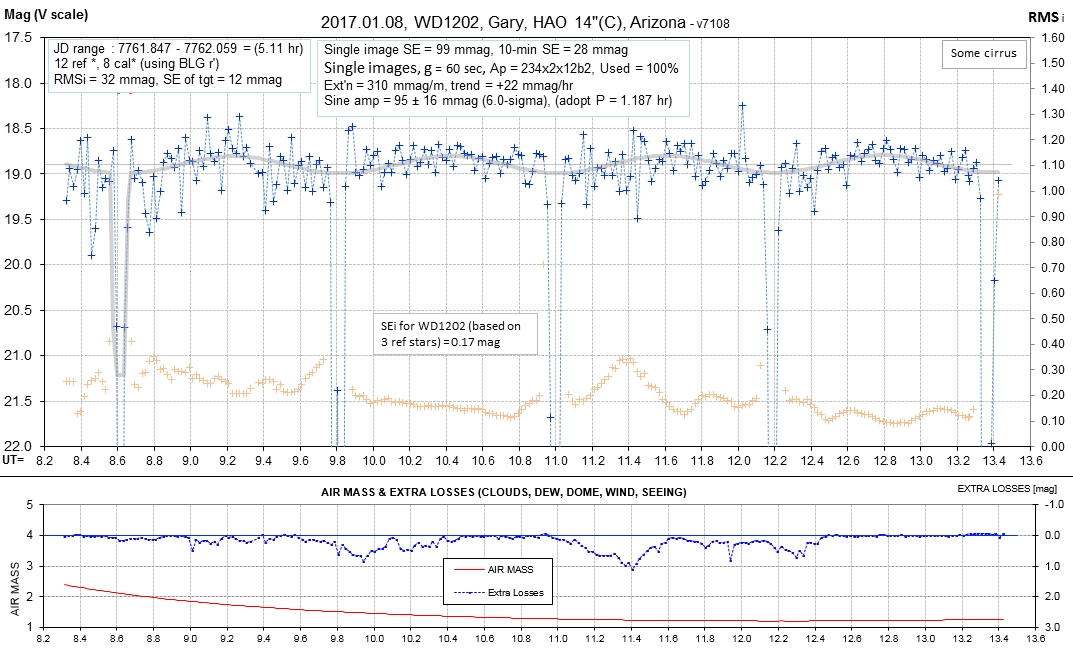
2017.01.08 Gary/HAO
2017.01.08 KayeGary JBO
2017.01.05 Gary/HAO
2016.12.27 Gary/HAO
Data exchange file: data
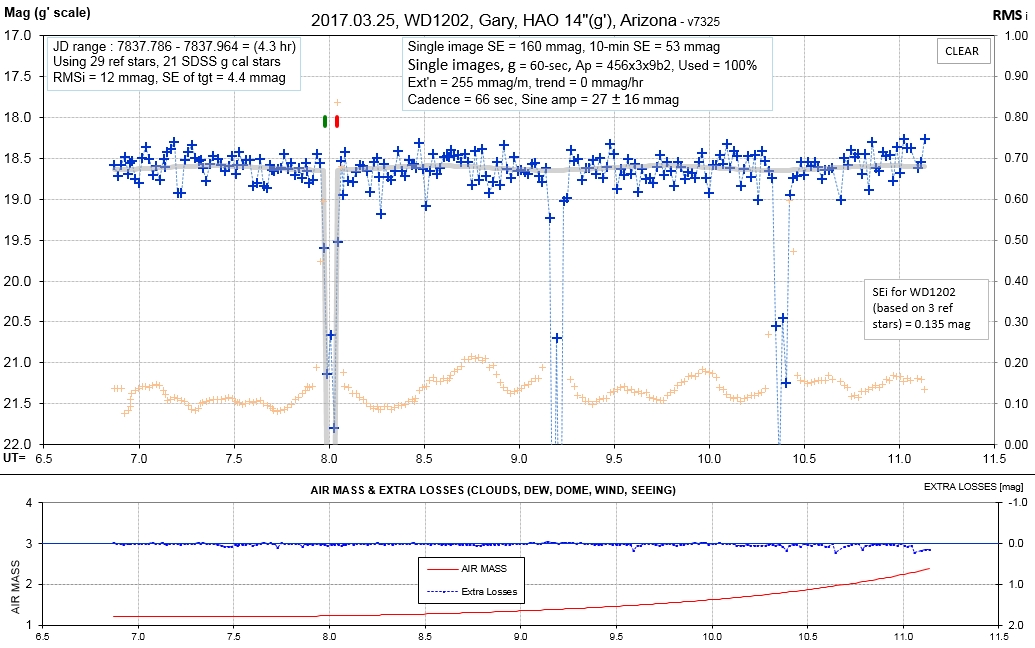
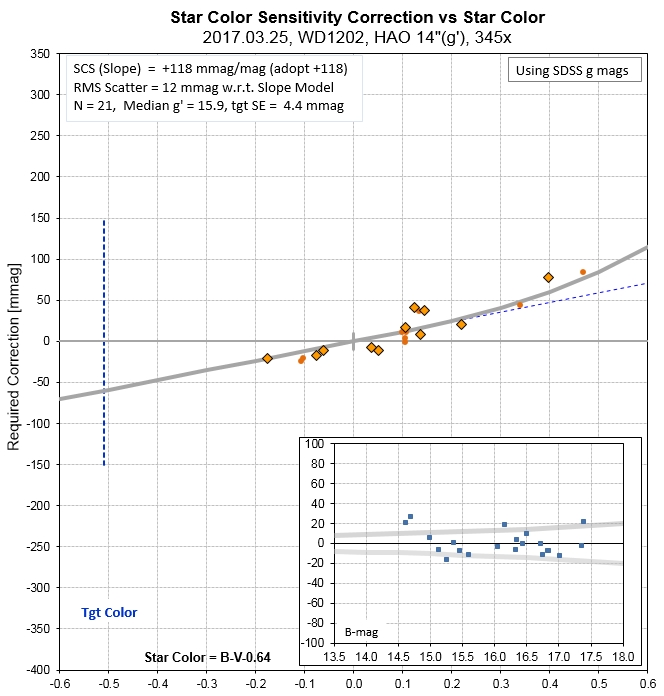
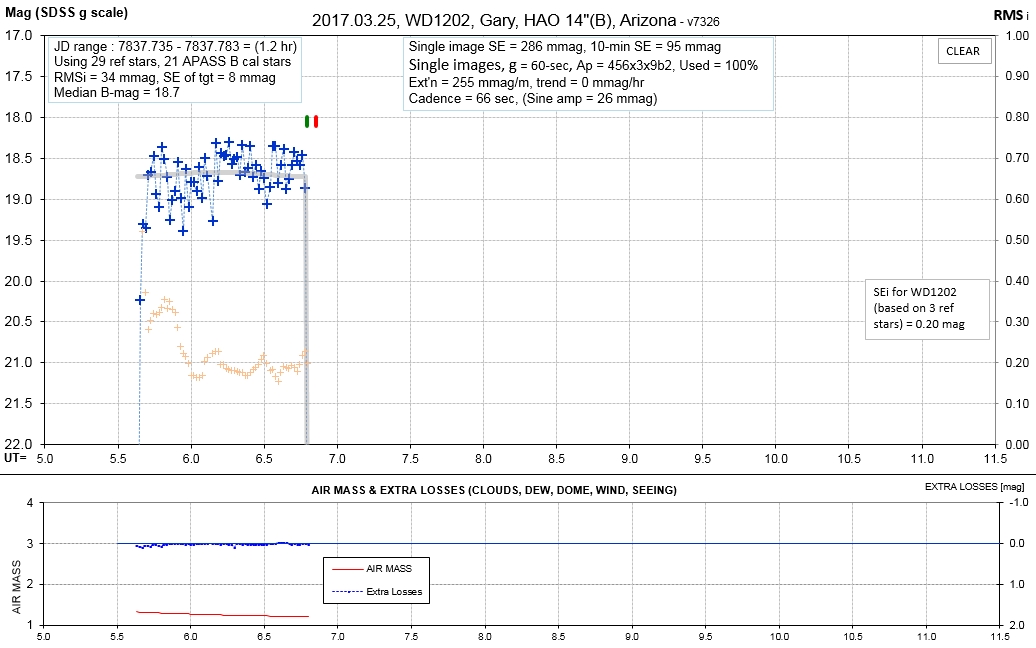
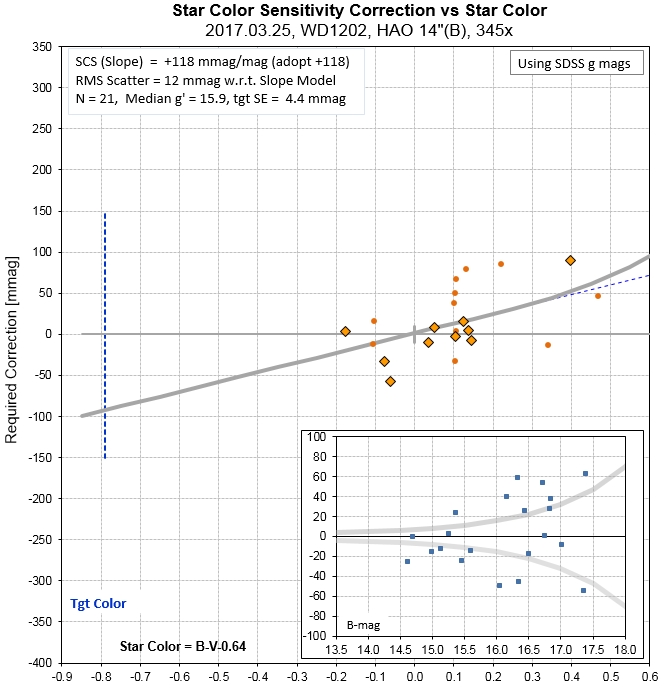
2017.03.25 Gary/HAO B &
g'
Goal was to improve SED by observing with B & g' filters.
Result: B-mag = 18.65 ± 0.15, g'-mag = 18.56 ± 0.14.
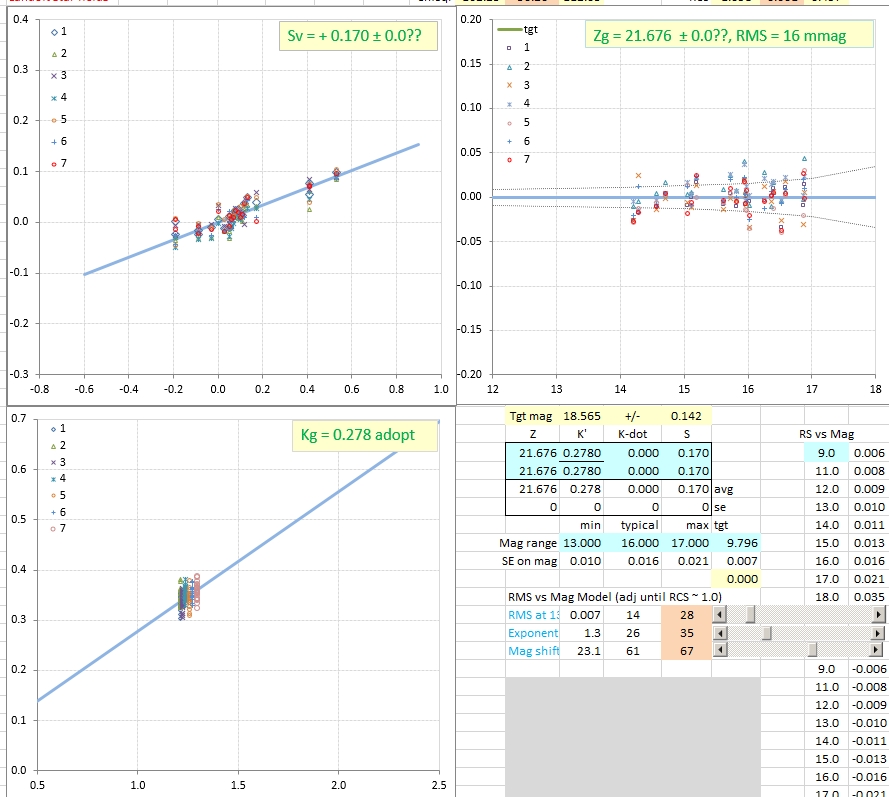
Example of results of differential photometry analysis.
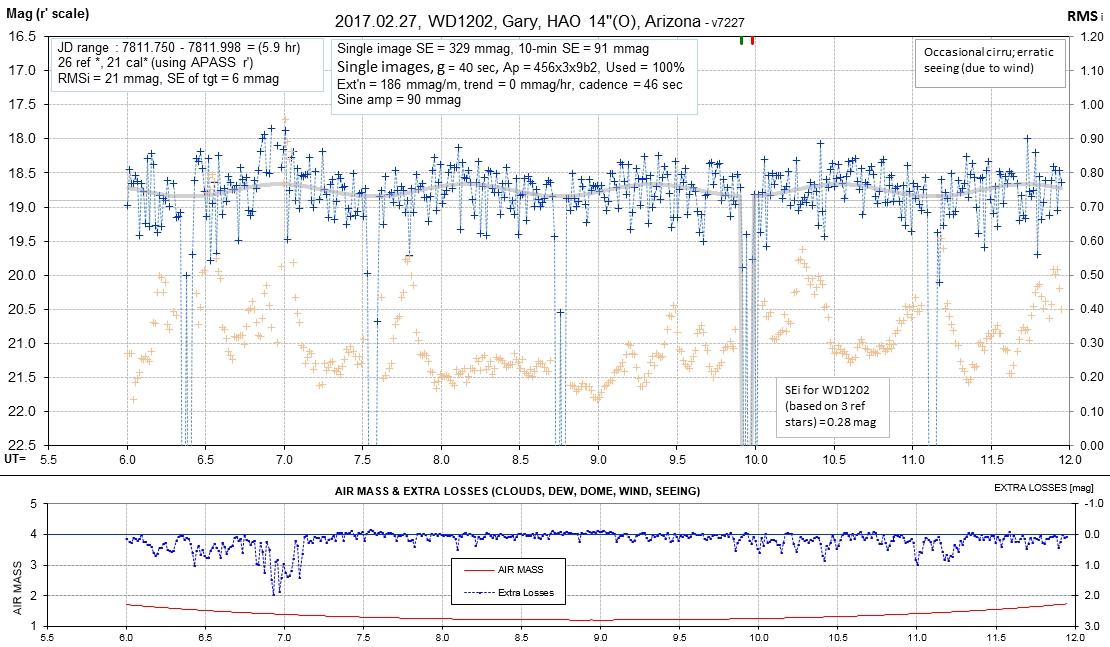
2017.02.27 Gary/HAO
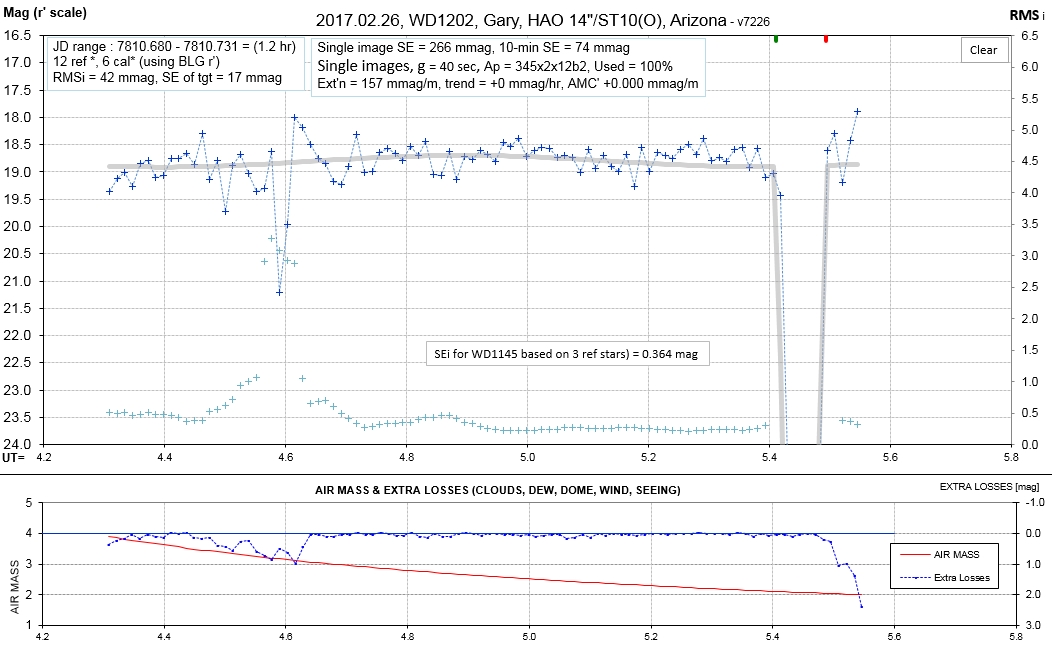
2017.02.26 Gary/HAO
2017.02.10 Gary/HAO i'
Full moon 52 deg away, but using i'-band minimized moon sky
background brightening. 45 2-minute exposures yields i'-mag =
19.29 ± 0.09.
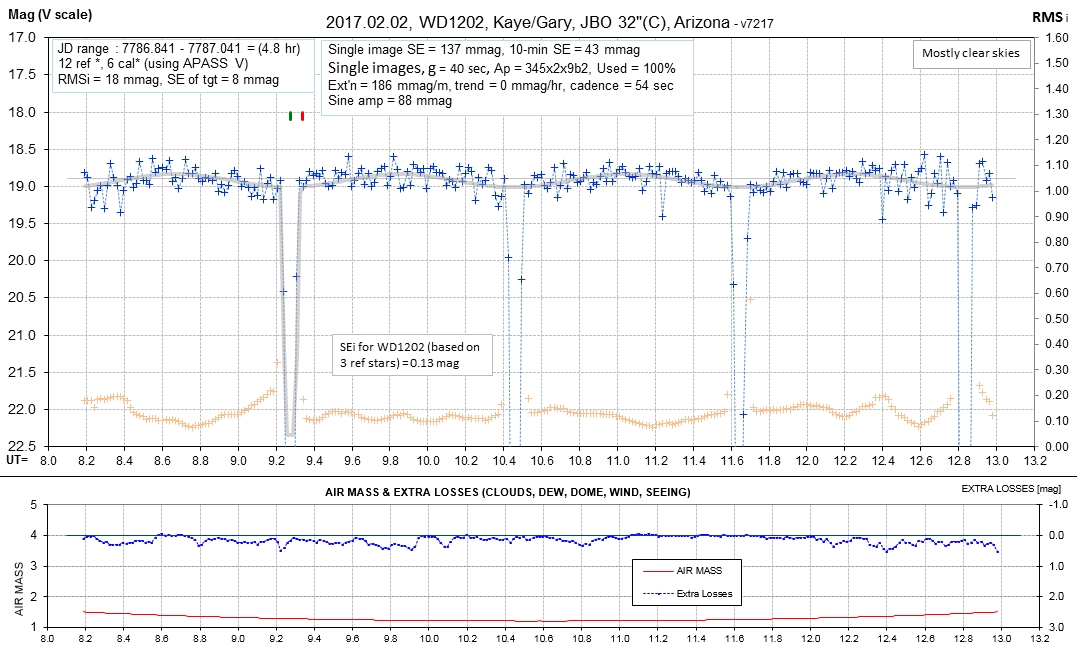
2017.02.02 Kaye/Gary
JBO
2017.01.31 Kaye/Gary
JBO
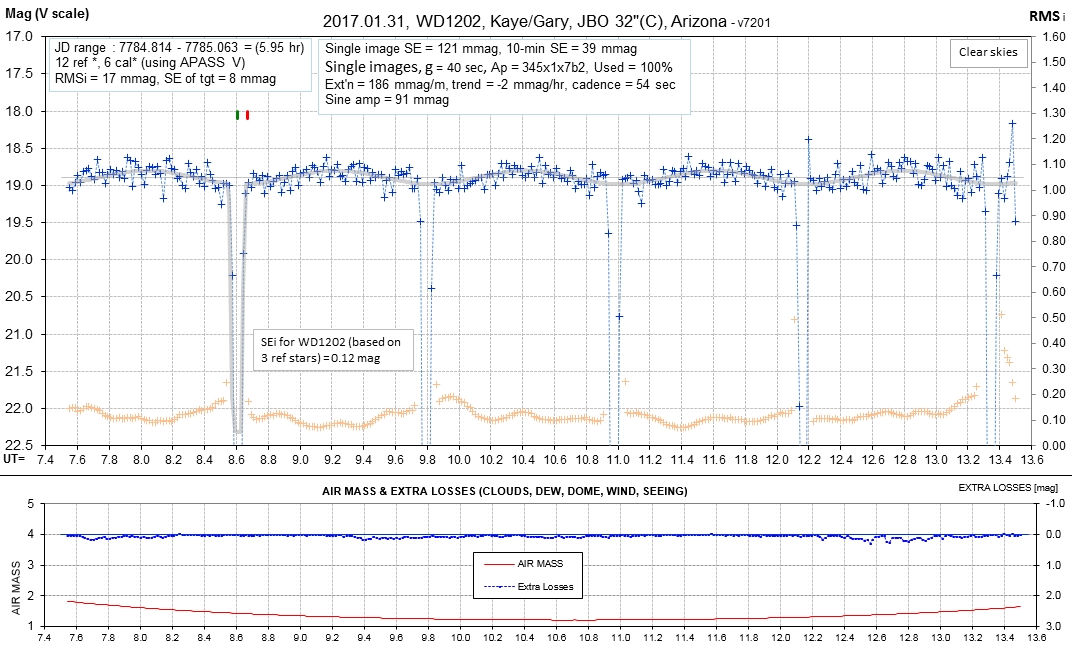
A cosmic ray defect caused the reading at 12.20 UT to be
un-useable.
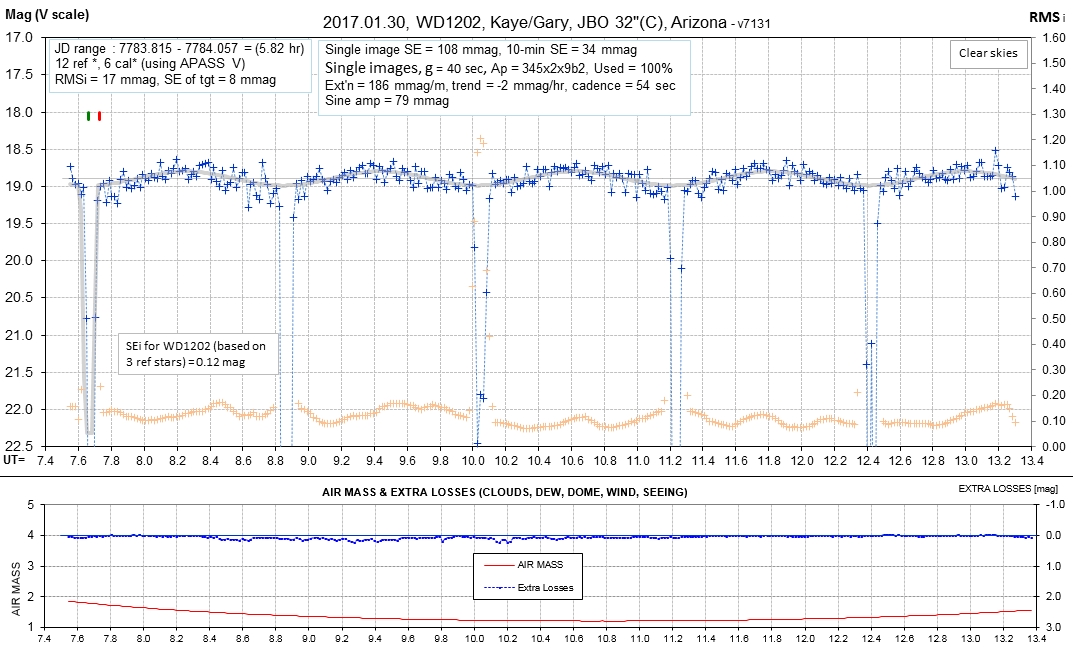
2017.01.30 Kaye/Gary
JBO
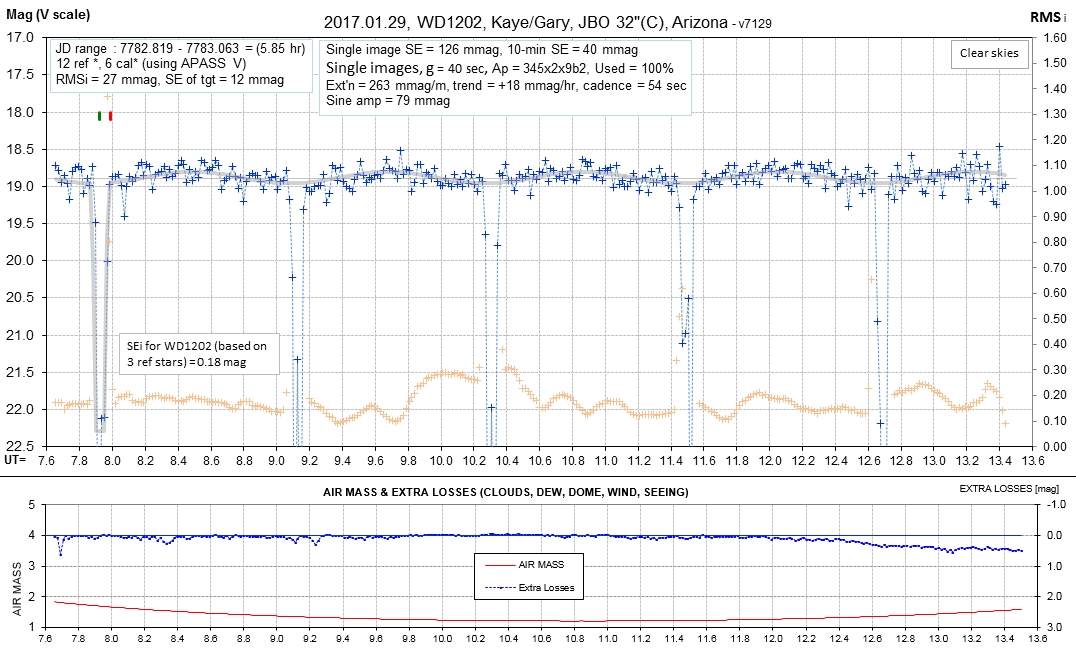
2017.01.29 Kaye/Gary
JBO
2017.01.28 Kaye/Gary
JBO
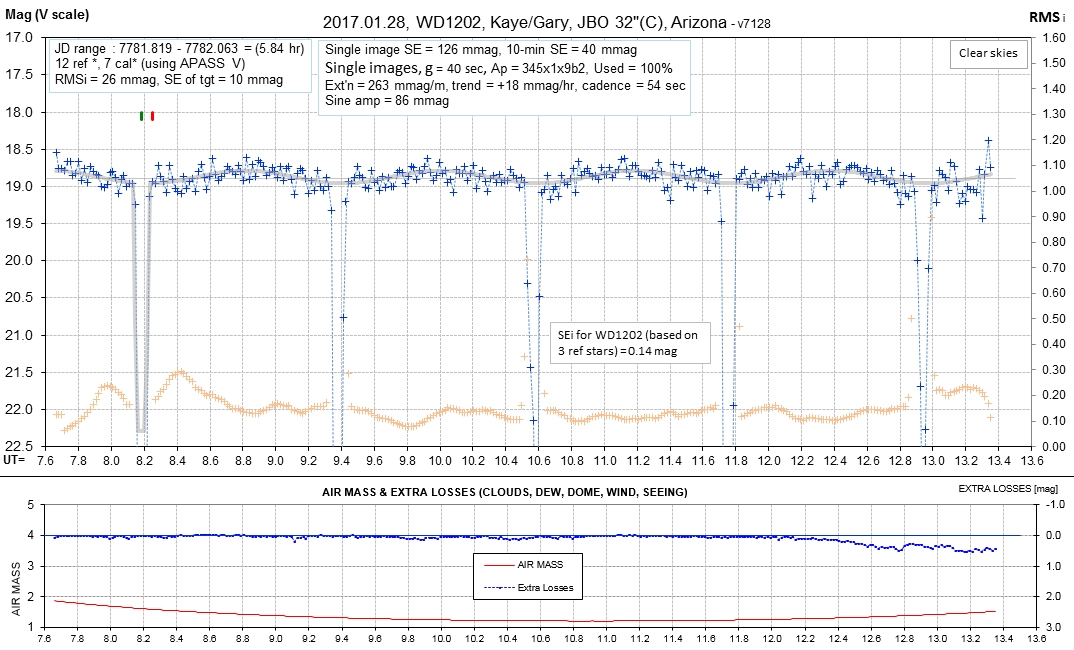
5 eclipses observed. Suubframes, binned 2x2, 40-sec exposures,
dithered.
2017.01.27 Kaye/Gary
JBO
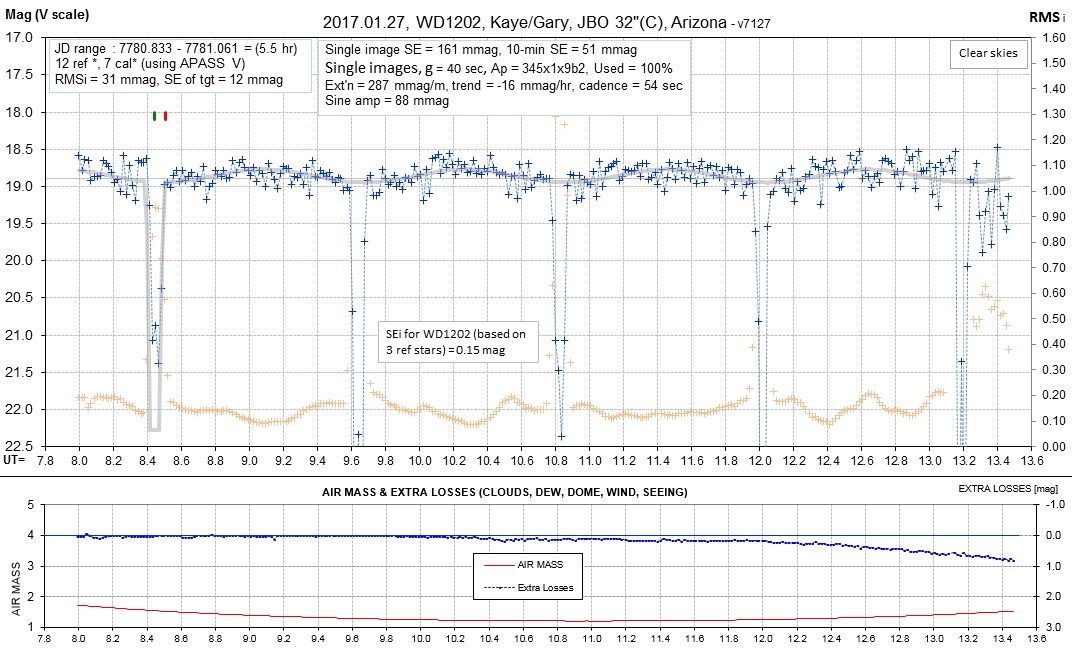
Dithering used.
2017.01.26 Kaye/Gary
JBO
2017.01.25 Kaye/Gary
JBO
2017.01.23 Kaye/Gary
JBO
The JBO 32" telescope was used in subframe mode, binning 3x3,
30-second exposure times.
2017.01.22 Kaye/Gary
JBO
The JBO 32" used 30-second exposures, subframes, binned 3x3. Four
eclipses were observed. The average of 22 images taken during
eclipse had a flux measure to be less than the sky background
annulus average. I conclude that the "normalized flux" during
eclipse was -0.12 ± 0.04, which suggests that interfering
background stars were present in the sky background annulus.
2017.01.08 Gary/HAO
2017.01.08 Kaye/Gary
JBO
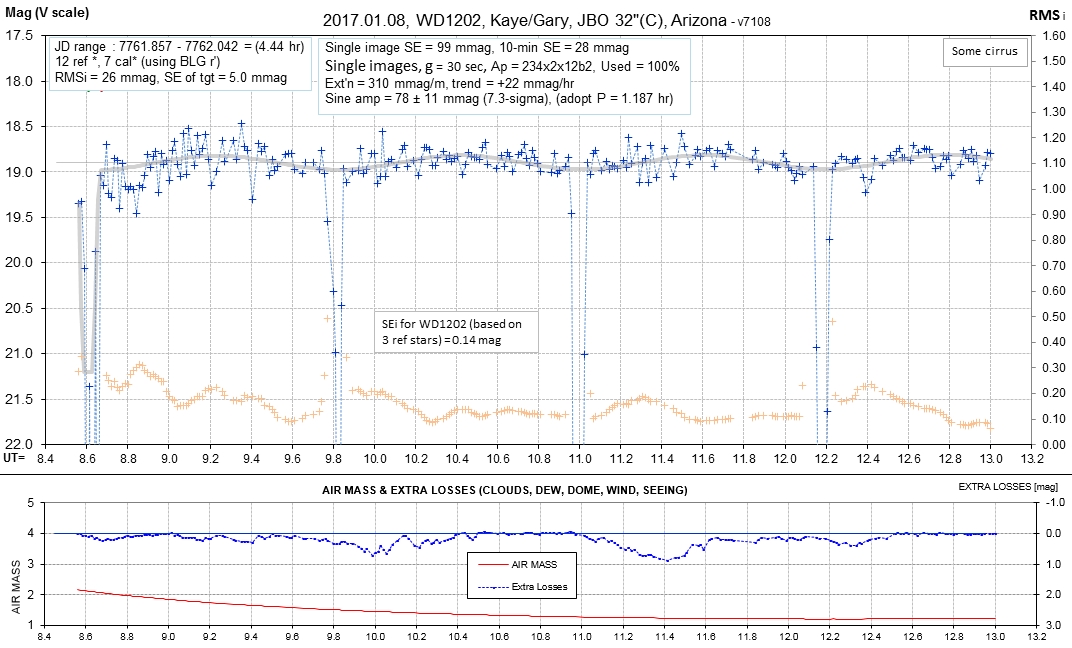
Note: exposure times are 30 seconds, which permits more image
averaging for determining shape of eclipse.
link
for video of images showing 4 "blinks" (from central portion of
JBO 32" images on 2017.01.08; compresses 4.4 hours into 30
seconds; created by Tom Kaye).
2017.01.05 Gary/HAO
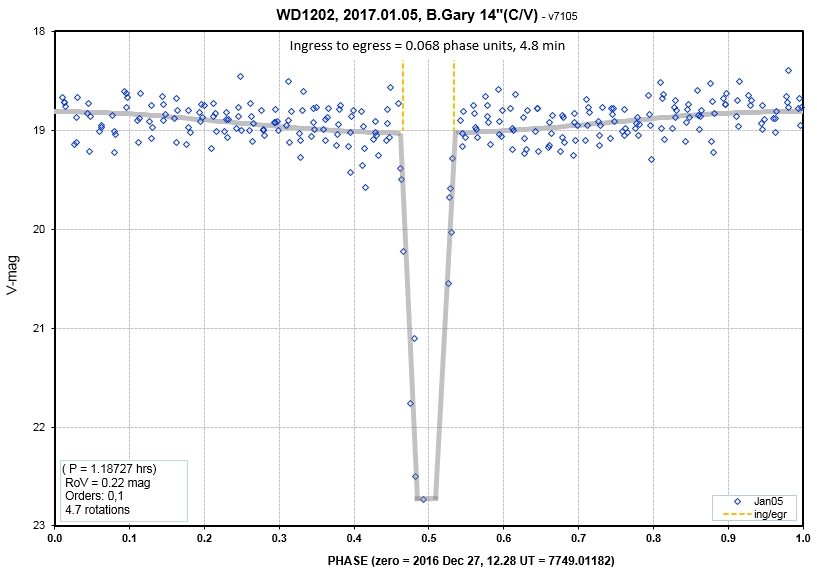
Apparent ingress & egress interval of 4.8 minutes, based on
60-secong exposure times, implies true ingressto-egress interval
of ~ 3.8 minutes.
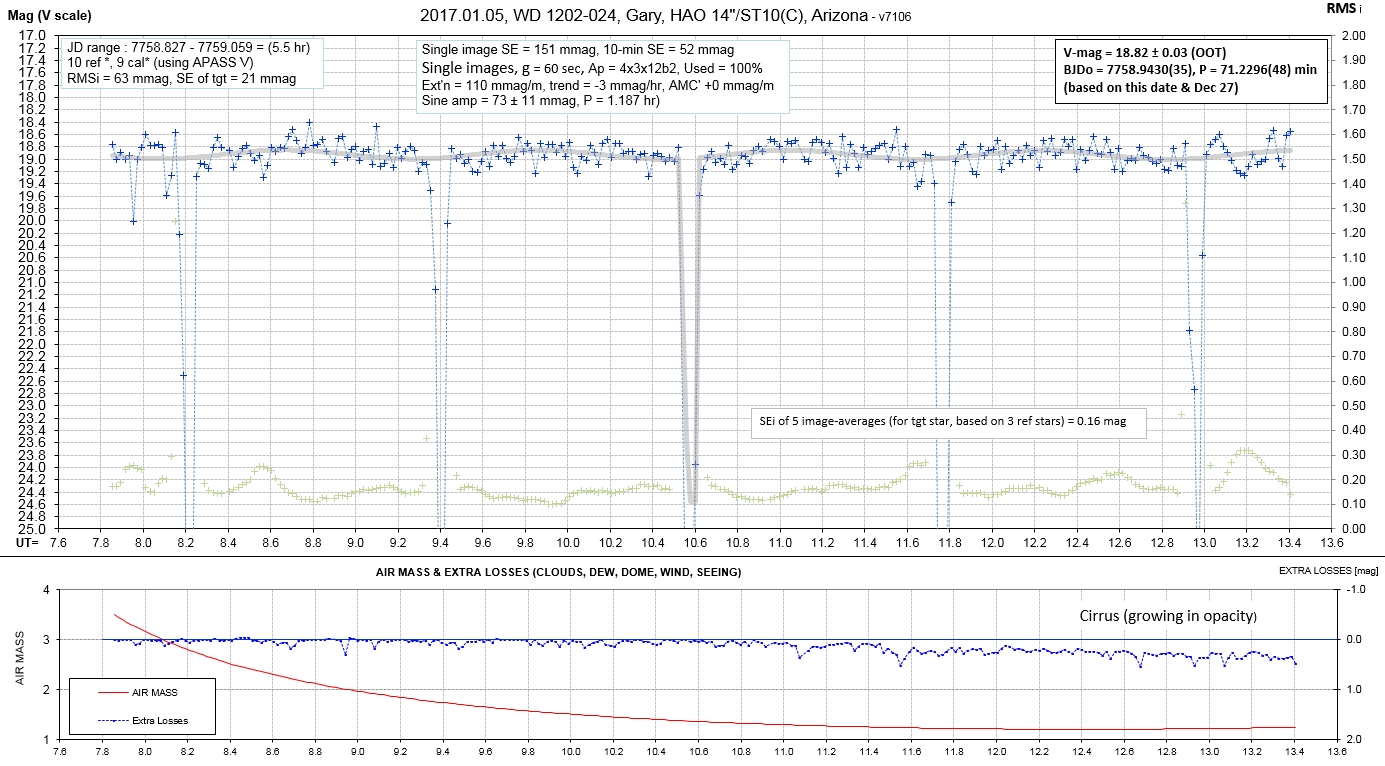
Persistent cirrus rendered SNR higher than normal, but 5
eclipse events are apparent with depths of >4 mags.
2016.12.27 Gary/HAO
This is the first ground-based verification of the suspected short
eclipse duration and deep eclipse depth.
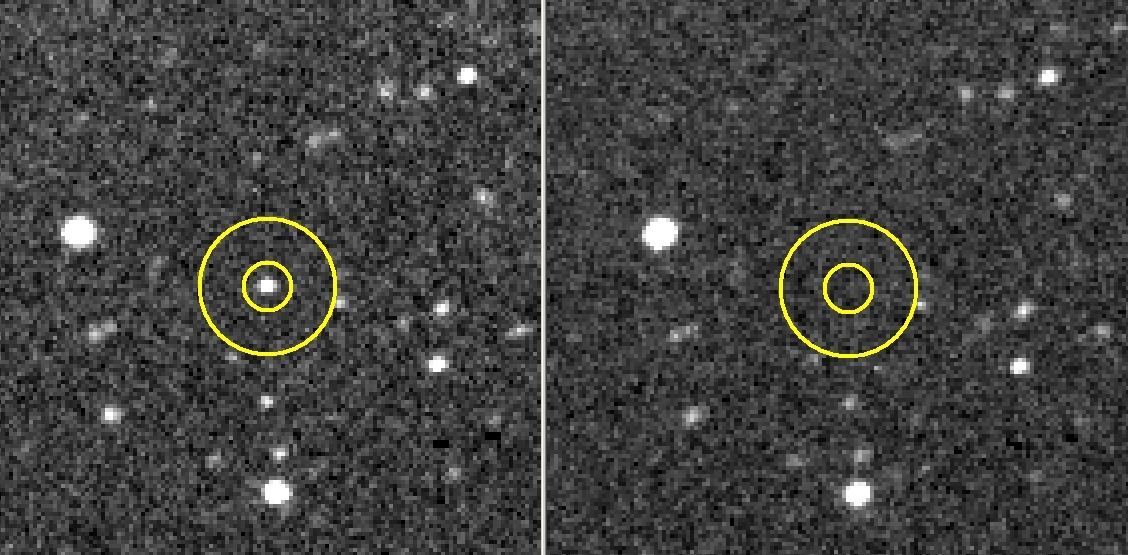
The left image is an average of 4 2-minute exposures taken
out-of-eclipse (before and after eclipse). The right image is an
average of 4 2-minute images taken during eclipse, and has a
1-sigma upper limit V-mag ~ 22.2.
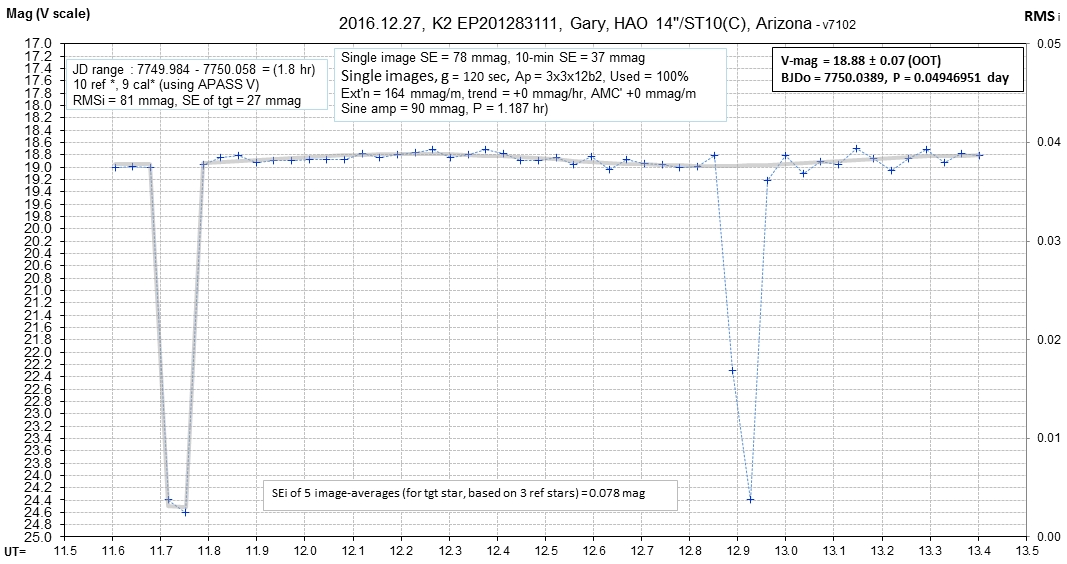
First ground-based light curve, showing that eclipses are deep
and short.
Finder Image
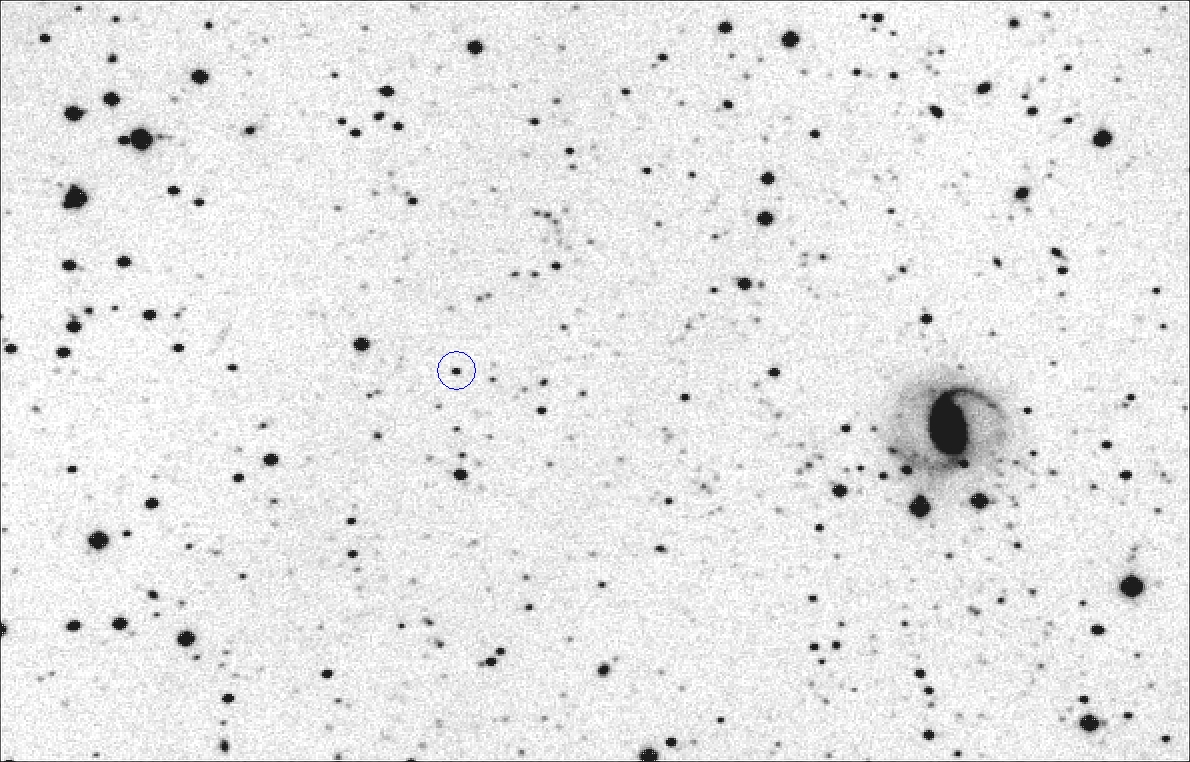
FOV = 17 x 11 'arc, north up, east left. WD1202 is
circled, at RA/DE = 12:05:15.8 -02:42:22 (J2000). Total
exposure = 73 minutes. Limiting V-mag = 22.2.
Related
External Links
Animation by L. Nelson et al avi
link or mp4 link
Rappaport et al arXiv submission (2017.05.18):
https://arxiv.org/abs/1705.05863
Parsons et al arXiv submission (2017.05.18): https://arxiv.org/abs/1705.05856
____________________________________________________________________
WebMaster: B. Gary  . Nothing
on this web page is copyrighted.
This site opened: 2017.01.06.
. Nothing
on this web page is copyrighted.
This site opened: 2017.01.06.