A WD1145 Dust
Cloud Crossing Event
Last updated 2021.03.26
Introduction
This web page documents a rare event in which two dust clouds in
the WD1145 A-system pass through each other because of their
slightly different orbital periods. Such an event affords an
opportunity for constraining values for the optical depth of each
cloud. For example, consider the case of each cloud being opaque
and obscures 20 % of the WD disk (cloud vertical width = 45 % of
Rwd). Before their alignment their two dip depths should total 40
%, but during alignment, (when one covers the other) there should
be a drop in their total depth to 20 %. Consider a different case,
where the two clouds are optically thin, such as 20 % and covering
the entire WD disk. The total clux of the ttwo dips should be 40 %
with regardless of whether they are aligned.
For 2021 March a waterfall plot shows drift lines that converge
on Mar 18. Based on depth measurements before and after alignment
we expect that during alignment (on Mar 18) their depth should be
~ 16 % each. On Mar 18 the sum of they appear as one dip, and it
is ~ 30 %. This is close to the expected value of 32 %, which
implies that both clouds were optically thin. It also means that
the clouds are comparable in size to the WD disk.
Another purpose for this web page is to determine if the dust
clouds producing Dip #1 and #2 are wide enough in the radial
direction to intersect, or pass through each other. It is found
that there is substantial overlap of these two clouds on Mar 18,
so they indeed passed through each other during that one-day
interval. Given that result we should consider what observable
changes there might be following this interaction. For example,
could angular momentum be lost by the faster Dip #2 cloud, causing
it to orbit with a shorter period than before the Mar 18
alignment? Or could the Dip #2 cloud speed up the Dip #1 cloud,
causing it to have a longer period?
Overall Context
The next figure is a waterfall plot for the 2021 February/March
dates.
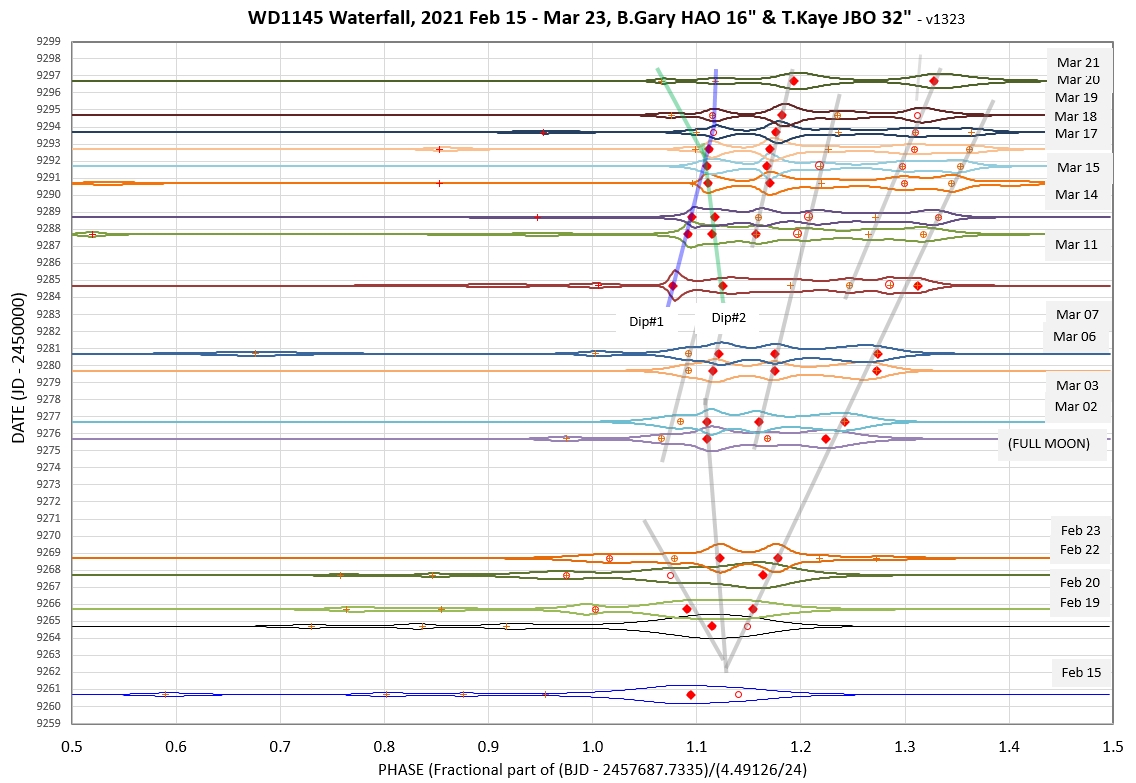
Figure 1a. 2021 February and March waterfall plot. Dip#1
appears on March 11 as a very brief dip with depth ~ 28 %, while
Dip #2 is broader and has a depth of ~ 22 %. Neither dip is
obviously present before this date.
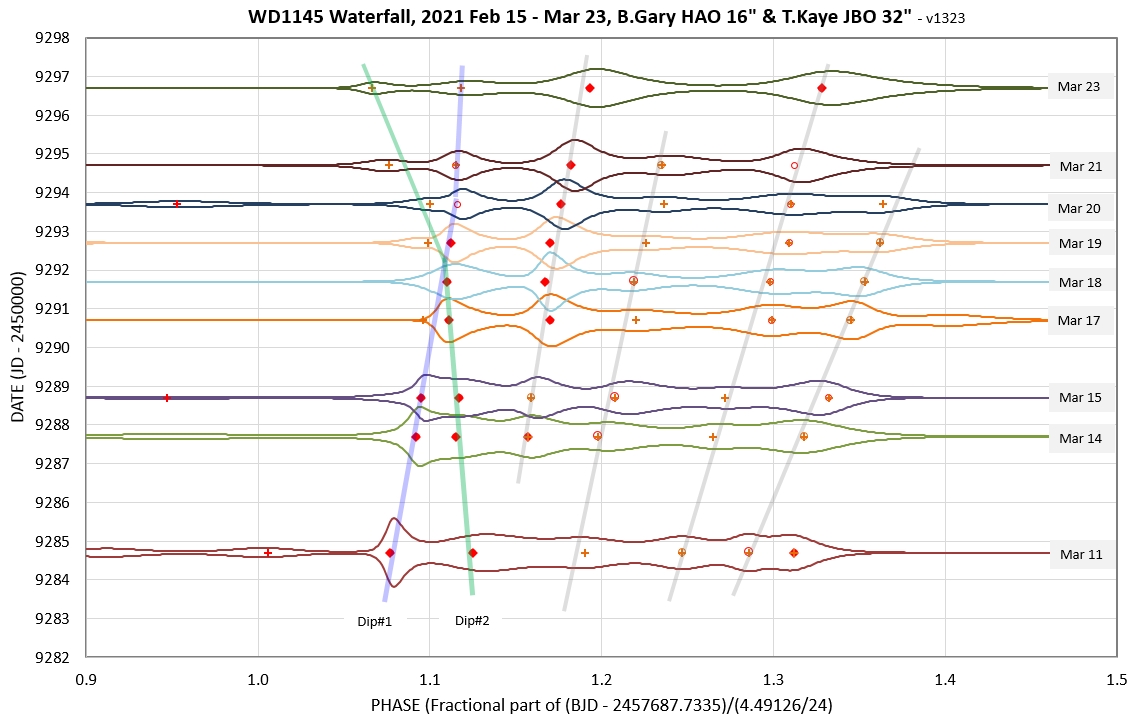
Figure 1b. Expanded version of the previous figure,
showing the region of interest.
Note: It's not necessary for the reader to accept any of the
drift lines in the above waterfall plots except for two drift lines,
shown in the next figure.
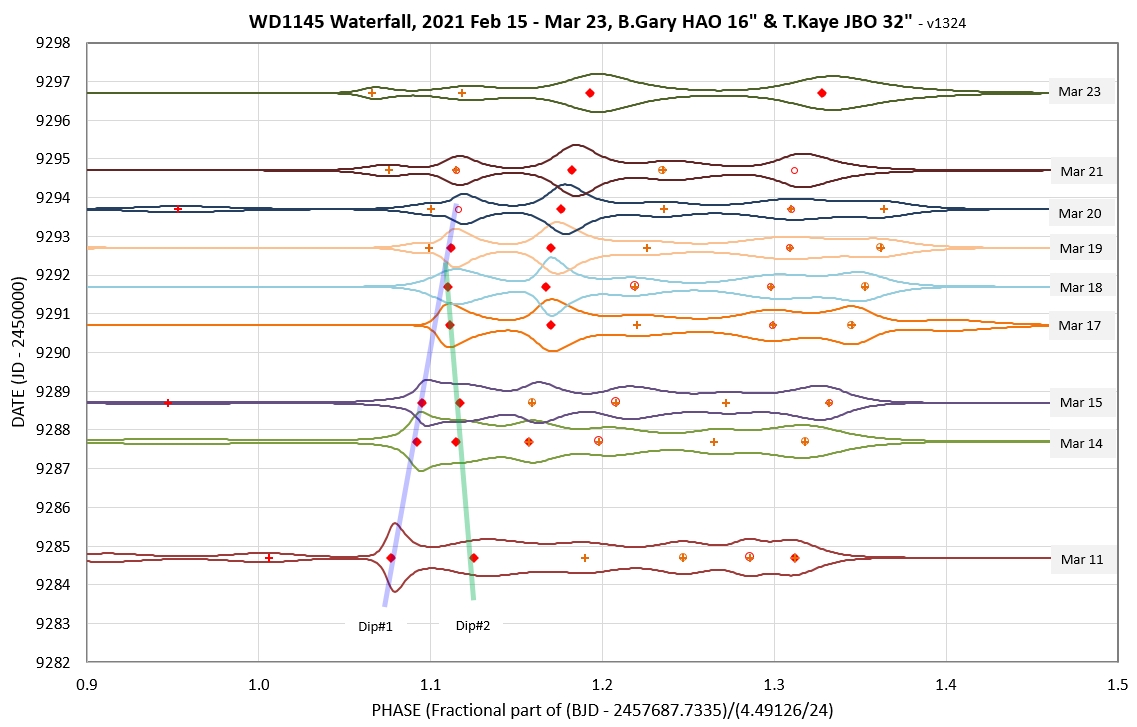
Figure 1c. The only drift lines relevant for
this web page.
If you can't accept that the previous figure's Dip#1 and Dip#2
drift lines are real tracks for two dip locations in "orbit phase
vs. date" space, then the rest of this web page won't be worth
reading.
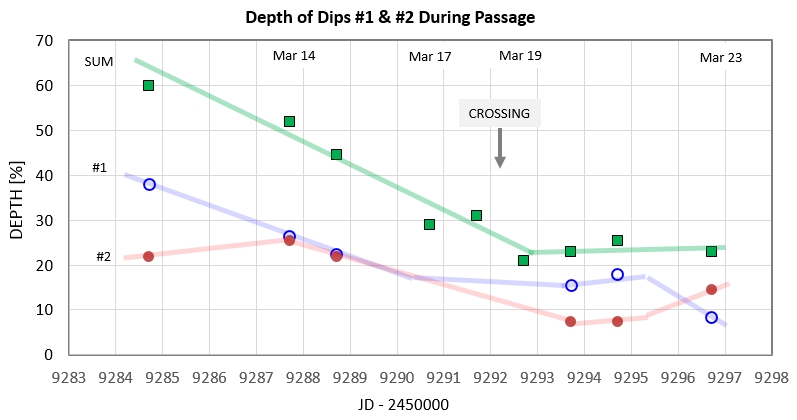
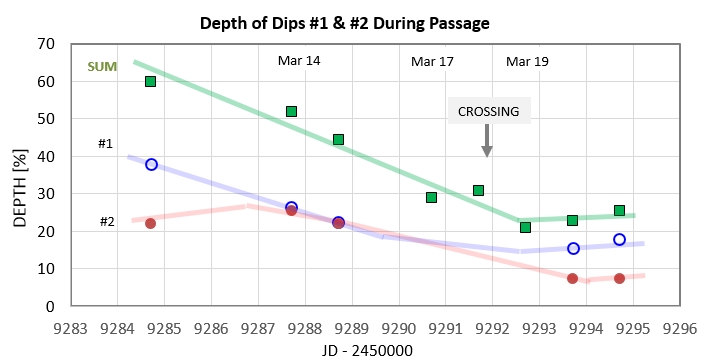
Figure 2. Depth vs. date for Dips #1 & #2 and
depth of both dips combined (green).
The phase-folded light
curves for Mar 11 - 21 can be seen at the following link
Based on the drift line slopes (see Fig. 1c) the periods for Dips #1
and #2 are 4.497 and 4.487, respectively. This range of periods for
dust clouds is not unusual, as the next graph shows.
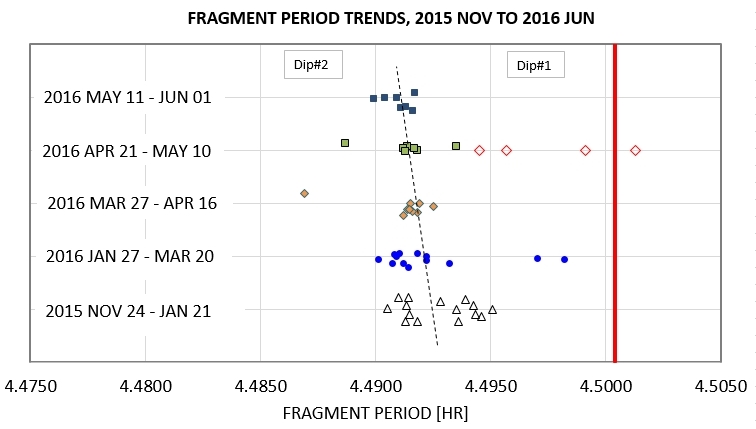
Figure 3. A-system periods for the 2015/2016 observing
season, with period locations for the present Dips #1 and #2 shown
for comparison.
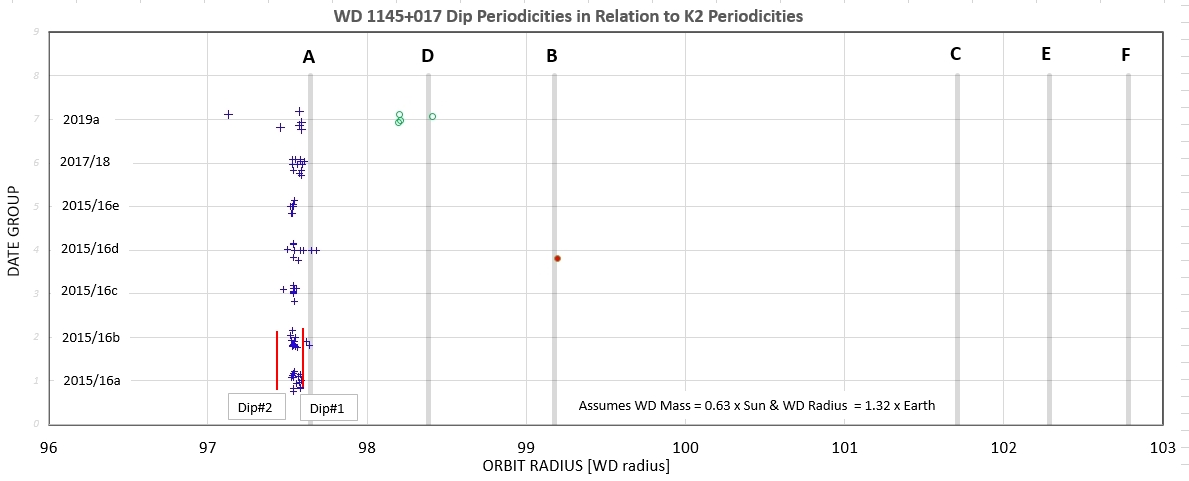
Figure 4. Orbital radii corresponding to the 6 systems as
determined from Kepler data of 2014. The two
vertical red lines show where the current Dips #1 and #2 are
located.
The orbit separation for Dips #1 and #2 is 0.14 Rwd.
Next is a repeat of the plot of depths for Dips #1 and #2 vs. date.
Repeat of Figure 2. Depth vs. date for Dips #1 and #2 and
the sum of their depths.
On Mar 17, 18 & 19 it is only possible to measure the dip depth
for the combination of Dips #1 and #2. Before and afterward it is
possible to measure each dip's depth.
Based on the fact that the total depth for Dips#1 and #2 changes
smoothly during the entire 22-day interval I conclude that either:
1) the dust clouds producing Dip#1 & Dip#2 are optically thin,
or 2) they are optically thick, and physically small, but they
traverse the disk in opposite hemispheres. We can rule out that they
are optically thick and traverse the same hemisphere.
During the alignment of Dips #1 and #2 their orbits are separated by
a distance of 0.14 Rwd (assuming circular orbits). What's the
probability that the two dust clouds are passing through each other?
Consider first what ejection velocity is required to produce a 25 %
dip depth. This is determined by the vertical component of maximum
velocities, which according to the following graph is ~ 700 m/s.
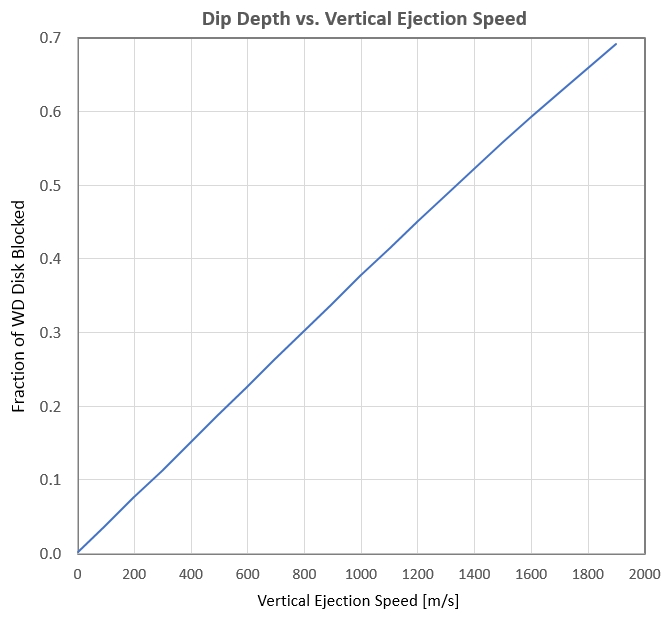
Figure 3. Maximum ejection velocities produce dip depths
determined by the latitude coverage of the vertically ejected
particles. This plot assumes that 1) the dust cloud's
impact parameter is zero, 2) orbit shear spreads out the dust
cloud over a distance of many Rwd, 3) the dust cloud is opaque
across the entire latitude extent, and 4) the collision or
sublimation event that created the dust cloud was a brief event
that occurred at a phase that is either 1/4 orbit before our
line-of-sight view or 3/4 orbit before (or multiples of one orbit
with respect to those two phases).
Let's determine the shape and size of dust clouds throughout their
orbit for the maximum ejection velocity of 700 km/s. First, let's
estimate the vertical size of the dust cloud with this velocity. I
will rely upon calculations that I've already made for 800 m/s
velocity; we must multiply the size results already calculated for
800 m/s by approximately 88 % from the following set of figures.
The following figures refer to orbit positions labeled in the graph,
which is a pole-view of orbit locations.

Figure 4. his orbit was obtained by placing a test
particle at x,y location +95.1, 0.0 (Rwd units), specifying a
velocity component in the upward direction of 315.17 km/s and zero
component in the horizontal (radial) direction. The central star
is WD1145 and was assigned mass = 1.19e30 kg. At equal time
increments of 3 seconds acceleration was calculated and the
associated velocity vector increment was added to the previous
time step velocity vector to obtain a new velocity vector. The
choice of 315.17 km/s was chosen for an initial velocity because
it produced a circular orbit.
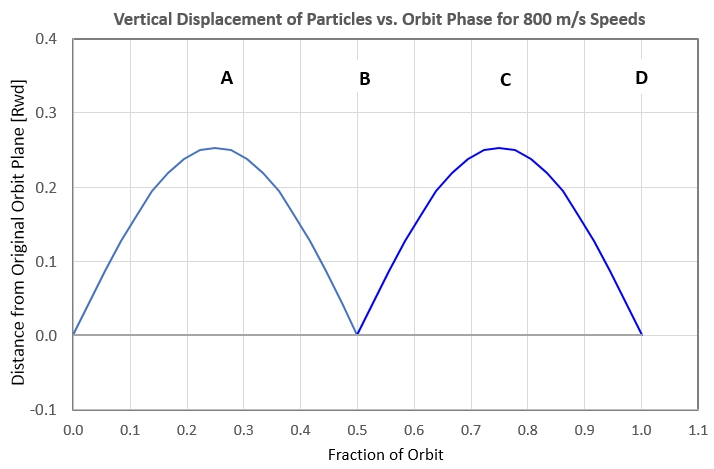
Figure 5. Vertical displacement of 800 m/s particles vs.
orbit phase. The phases A, B, C and D correspond to orbit
locations in the previous figure.
From this figure we can estimate that for a 700 m/s ejection
model the dust cloud's vertical extent will be maximum at orbit
phases A and C, and will have a total vertical thickness of twice
0.22 Rwd (0.88 × 0.25 Rwd), or 0.44 Rwd.
Now let's investigate dust cloud size in the orbit plane, parallel
and perpendicular to the orbit vector.
Figure 6a. At orbit location A the cloud of particles
define an ellipse with maximum length ~ 1.4 Rwd and oriented at 45
degrees with respect to the orbit (and rotating in the
counter-clockwise direction). This figure assumes a
maximum injection velocity of 800 m/s.
At orbit location A the dust cloud has a maximum size in
the vertical direction (above figure) and it extends beyond a
circular orbit radius by a distance of 0.5 Rwd. The next figure is
for 1/4 orbit later.
Figure 6b. At orbit location B the cloud of particles
define an ellipse with maximum length ~ 6 Rwd that is oriented at
almost parallel to the orbit (and continues to rotate in the
counter-clockwise direction).
This orbit location, B, won't correspond to our line-of-sight view
because the vertical extent of the dust cloud is close to zero, as
shown in Fig.5. It may be important to consider this cloud shape and
size for present purposes because it predicts that a cloud with
maximum ejection velocity of 700 m/s will extend beyond its circular
orbit by a distance of ~ 1.1 Rwd (0.88 ×1.2 Rwd).
Figure 6c. At orbit location C the cloud is an ellipse
with maximum length ~ 9 Rwd and is oriented at almost parallel to
the orbit.
At orbit location C the dust cloud has a maximum size in the
vertical direction (see Fig. 5), and we can see that it has shrunk
in the radial direction. We predict that a cloud with maximum
ejection velocity of 700 m/s will extend beyond its circular orbit
by a distance of 0.45 Rwd (0.88 × 0.5 Rwd).
Figure 6d. At orbit location D, after one full orbit, the
cloud of particles define an ellipse with maximum length ~ 9 Rwd
that is oriented exactly parallel to the orbit.
This orbit position is unimportant for present purposes because
the vertical extent of the cloud is close to zero and cannot produce
dips of significant depth. Nevertheless, it illustrates the
importance of "orbit shear" in stretching out the dust cloud along
the orbit. Every subsequent orbit produces ever longer dust clouds,
which should produce ever longer dip lengths. A cloud as long as 9
Rwd will produce dips lasting 4.0 minutes. After two orbits dip
length will be 8 minutes. Since we rarely observe dips lasting
longer than 20 minutes we are rarely seeing dust clouds that have
been stretched for longer than ~ 5 orbits. Of course, more orbits,
with longer stretchings, can be kept short if there's a mechanism
for removing particles that last about a day (note: WD1145 has 5.4
orbits per day). This would require a replenishment of dust to match
the removal rate (note collisions may occur twice per orbit, at
locations B and D, and produce new debris). All radial and vertical
excursions vs. phase will be the same for future orbits.
Notice that during an orbit the dust cloud will extend beyond a
circular orbit by distances as great as 1.1 Rw (at orbit location
B). Referring back to Fig. 4 it can be seen that the A-system orbit
is separated from its nearest neighbor, the D-systems, by 0.8 Rwd,
Therefore the dust clouds under consideration for the 2021 Mar 17
alignment will pass through any dust clouds in the D-system. But,
more important for this web page analysis, the Mar dust clouds, Dips
#1 and #2, will pass through each other since they are a mere 0.14
Rw apart. Again, the assumption in stating this is that both dust
clouds are in circular orbits with the same inclination.
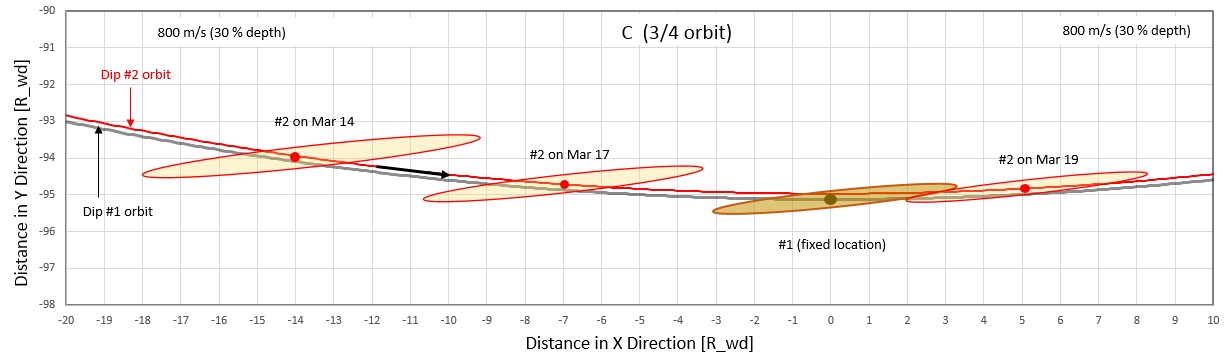
Figure 7. Location of Dips #2 in relation to Dip #1
during their crossing event at phase location C. Sizes are
approximately correct based on the injection speeds that match the
observed dip depth. Dip #2 is in an orbit that is 0.14 Rwd smaller
in radius; on the alignment date of Mar 18 the two clouds almost
completely overlap.
From the above figure it becomes clear that the dust clouds
producing Dips #1 and #2 pass through each other when they undergo
an alignment, as occurred on Mar 18. The duration of this
overlapping event is one day.
Repeat of the depth vs. date graph:
Period Change?
After the crossing date the waterfall drift line for Dip#2
either disappears or changes slope to a shorter period.

Repeat of Fig. 1b, but showing periods corresponding
to slopes.
How could the period for Dip#2 change from 4.489 hours to 4.480
hours?
I used a 2-body gravity model to show that only eccentricity will
change when masses in co-planar orbits pass each other. The orbital
angular momentum changes are brief, and no residual change occurs.
The dust clouds could interact, but not the fragments producing the
dust clouds. Could the dust clouds change orbits, leaving the
fragments to remain unseen in their original orbits? This apparent
period change remains unexplained.
Conclusion
1) Based on the fact that the total depth for Dips#1 and #2 changes
smoothly during the entire 22-day interval it can be concluded that
that either: 1) the dust clouds producing Dip#1 and Dip#2 are large
(comparable in size to the WD1145 disk) and are optically thin, or
2) they are small in relation to the disk, are optically thick and
they traverse the WD in opposite hemispheres. We can rule-out the
situation that they are optically thick and traverse the same
hemisphere.
2) If these two dust clouds transited the same hemisphere then they
passed through each other during the Mar 18 alignment. This is due
to the fact that they are expected to be thicker in the radial
direction than their orbit separation. At orbit positions A and C,
when vertical size is maximum (and when it is most likely that these
orbit locations correspond to our line-of-sight view), the radial
thicknesses for 18 % dip depths is 0.6 Rwd, and this corresponds to
extending inward and outward of their circular orbits by a distance
of 0.3 Rwd, which is more than the 0.14 Rwd separation of the orbits
for Dips #1 and #2.
3) There is evidence that the Dip #2 dust cloud changed its orbit to
be slightly smaller during the Mar 18 alignment.
~~~~~~~~~~~~~~~~~~~~~~~~~~~~~~~~~~~~~~~~~~~~~~~~~~~~~~~~~~~~~~~~
This site opened: March 18, 2021 by B. Gary.