Dust Cloud Model for J0328-1219
Bruce L. Gary, Last Updated
2024.03.06, 23 UT
This web page describes a simple model for representing dust
clouds transiting J0328-1219. I conclude by stating
that the measurement of dip depth ratio, R band depth divided
by g' band depth = 0.990 ± 0.055, is sufficiently precise to
provide a meaningful constraint on the dust cloud's particle
size distribution. Specifically, this measurement provides an
argument for stating that particles with radii smaller than
0.1 micron are absent. This result is based on model
calculations for three minerals (with complex index of
refraction) and a particle size "cut-on" model.
Model Description
This simple model employs 3 parameters: 1) optical depth along a
center-line of the cloud, 2) 1/e half-width in latitude profile
(also referred to as "height), and 3) Angstrom exponent (also
referred to as "alpha," specifying ratio of optical depth at two
wavelengths). As far as I can tell it is the same model used by
Izquierdo et al. (2018) in their Appendix A.
It is assumed that the cloud is spread out along the orbit
(x-axis) so that it can be treated as a horizontal band (that goes
through the star center), as illustrated below.
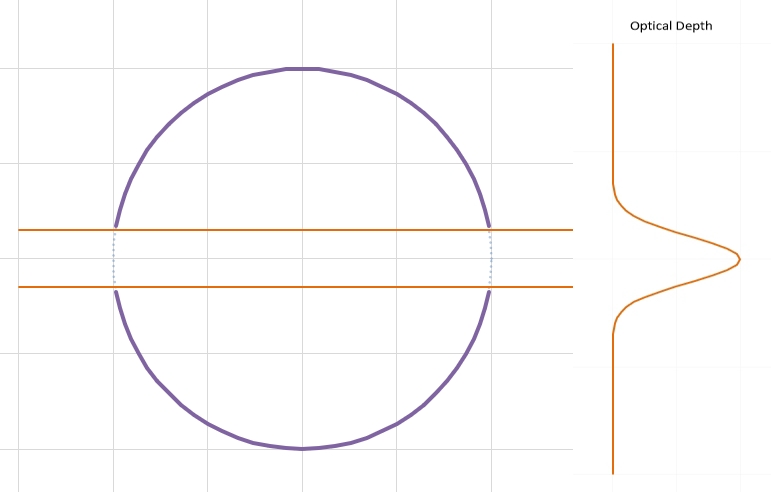
Figure 1. Dust cloud stretched out inn front
of a WD along orbit. A y cross-section of opacity is
Gaussian-shaped (plotted on right using a linear scale). The
horizontal lines correspond to an optical depth of one.
Note that if losses (scattering and absorption) vary with wavelength
the optical depth profile will depend on wavelength. Consider
wavelengths corresponding to g' and R bands, 464 and 641 nm. Their
wavelength ratio is 1.38. If the "Angstrom exponent" alpha = 4,
corresponding to Rayleigh scattering, the ratio of losses for the
two wavelengths would be 1.38^4 = 3.64 (greater losses at g' band).
An example for this is shown below:
Alpha4.0.jpg)
Figure 2. A Gaussian-shaped optical depth versus WD
latitude-axis value for a dust cloud with Tau_max = 10 (at g'
band) and a y-axis 1/e half-width = 0.181 WD radii. The cloud is
optically "thick" at g' band from -0.27 to +0.27 radii (indicated
by horizontal line). It is optically thick for a smaller range at
R band (-0.19 to +0.19). This cloud produces a dip depth of 18.0 %
at g' band. Dip depth at R band is 12.4 %. The difference between
the two optical depth profiles is maximum near the cloud edges
(+/-0.25 radii), as shown by the "DIfference" trace.
Note: Tau_max is optical depth for the line-of-sight along the
cloud's center-line.
Another way to view this cloud's effects on dip depth is to plot
transparency.
Alpha4.0.jpg)
Figure 3. Same cloud model as in the previous figure but
plotting transparency instead of optical depth.
An alpha of 4 is extreme since it corresponds to the presence of
only small particles (circumferences < all wavelengths involved,
so particle radii < 0.1 micron). So, let's consider the opposite
extreme: alpha = 0.5 (essentially no small particles).
Alpha0.5.jpg)
Figure 4. The green trace is the same as in Fig. 2. The
red trace is for a cloud that at R band has an only slightly
smaller optical thickness profile (0.85 of g' band, as dictated by
alpha = 0.5 instead of 4). This cloud produces the same g' band
dip depth of 18.0 % but a R band depth of 17.4 %. Dip depth ratio
(R band / g band) = .0.967, which is much lower than for the alpha
= 4 model (0.967 vs. 0.69). As before, the difference
between the two optical depth profiles is maximum near the cloud
edges (+/-0.30 radii).
Alpha0.5.jpg)
Figure 5. Same mmodel as in the previous figure, but
plotting transparency instead of opticity.
Photometry Measurements of Dip Depth Ratio
Here's a scatter plot of J0328-1219 dip depth measurements at g'
and R by Gary and Kaye, as described at link. The scatter
diagram for g' and R depths is repeated from that web site here:
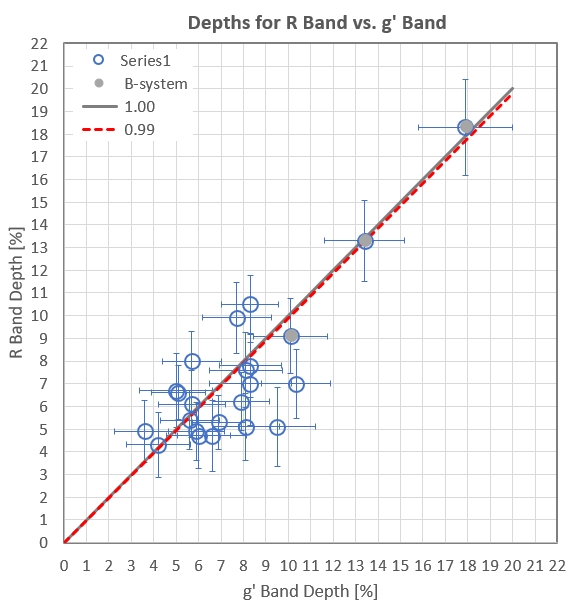
Figure. 6. Measurements of g' and R band dip depths for
J03329-1219, as reported by Gary and Kaye (arXiv)
and described at the previous link.
One possible goal is to identify the 3-D volume of model
parameter space that is compatible with the observations.Note that
we have to deal with two optical depth regimes: 1) optically thin
(Tau_max < 1), and 2) optically thick (Tau_max > 1). Let's
first consider the optically thin regime.
Optically Thin Regime
Whereas the first section described a cloud model in terms of 3
parameters, it is also important to add the following:
1) Particle size distribution, PSD (number
density versus size),
2) complex index of refraction, specified by
the real part (scattering), n, and imaginary part (absorption), k.
I will adopt the usual relation for number density (sometimes
described as associated with collisions): N = constant × a-3.5.
Minerals have different complex index of refractions, and I will
adopt values for e minerals that are in common use for dust cloud
modeling: enstatite, fosterite and corundum. Dr. Saul Rappaport
has provided me with extinction coefficients versus particle size
for each of these minerals. For example, here's enstatite's
extinction versus particle size, expressed a loss divided by a
hypothetical loss that would occur due only to the particle's
physical cross-section (assuming spherical shape).
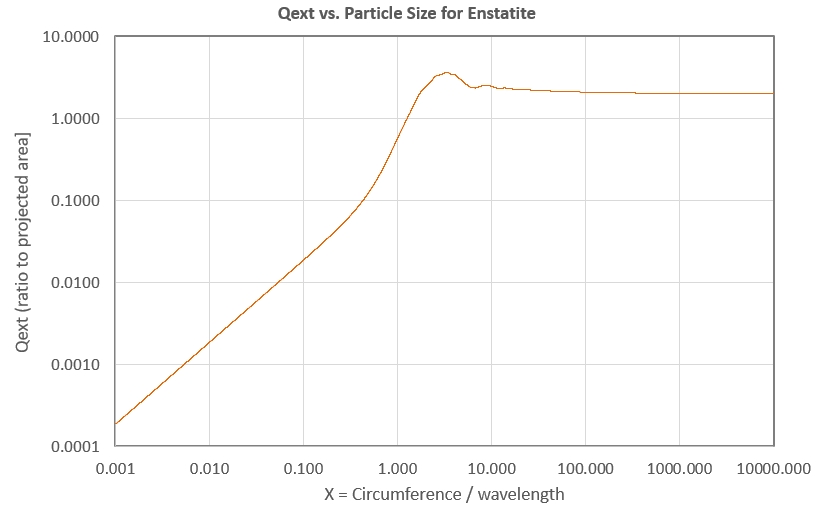
Figure 7. Normalized loss of light versus particle size
in relation to wavelength for enstatite.
The above figure is fine when one wavelength is involved and many
paarticle sizes are present. The next figure is suitable for the
situation of calculaating optical losses versus wavelength for a
single particle.
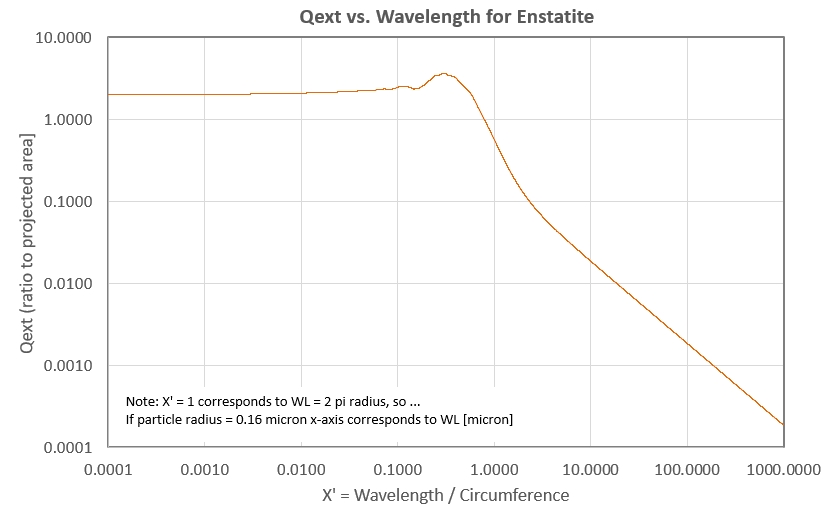
Figure 8. Normalized loss of light versus a normalized
version of wavelength (x-axis the reciprocal of that in the
previous figure) for enstatite.
Consider a dust cloud consisting of two particle sizes.
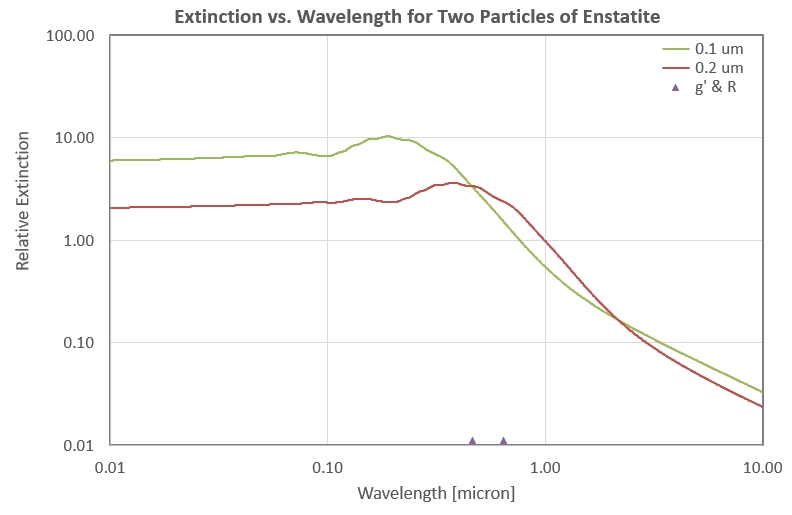
Figure 9. Extinction due to a cloud consisting of one
particle with radius = 0.2 micron and 11 particles with radius =
0.1 micron. Note: A number density relation with exponent -3.5
calls for 11 times more particles with half the size.
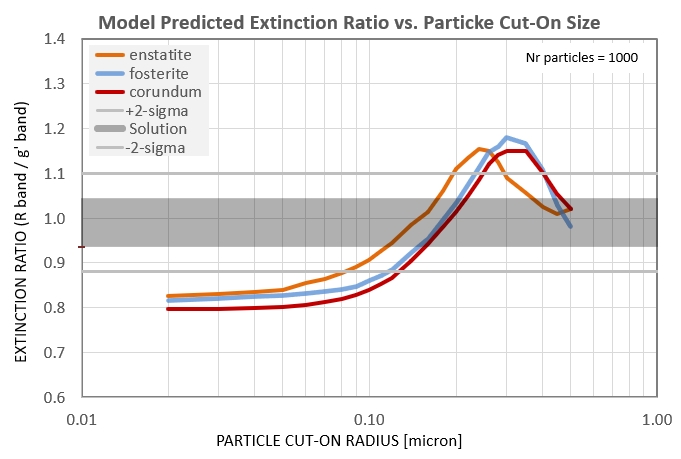
Figure 10. Model predicted extinction ratio for
wavelengths corresponding to g' and R filter bands and PSDs with
x-axis "cut-on" radii, for three minerals.
In the above figure it is shown that particles with radii <
0.1 micron cannot be present in clouds consisting of the three
minerals under consideration. Such clouds whould have produced dip
depth rations of ~ 0.83, which is below the 2-sigma lower limit
measured (0.88).
This cloud model has a PSD that begins with particles having
radii specified by a "cut-on" value, and the number density
decreses with increasing size according to the -3.5 exponent on
size. Other models with different PSDs could be considered, such
as log-normal, or different minerals. Such a model evaluation is
beyond the scope of this analysis.
Next, let's consider if optical depth, Tau_max, can be
constrained.
Optically Thick Regime

The following is under review, and is under consideration for
being deleted.
Since dips with different depths require different locations
within this parameter 3-D volume we will evaluate a sampling of
dip depths. This will by done choosing a depth, specifying a
Tau_max and solving for cloud vertical size (also referred to as
"height"). For the first example, consider a depth of 18 %, the
maximum observed.
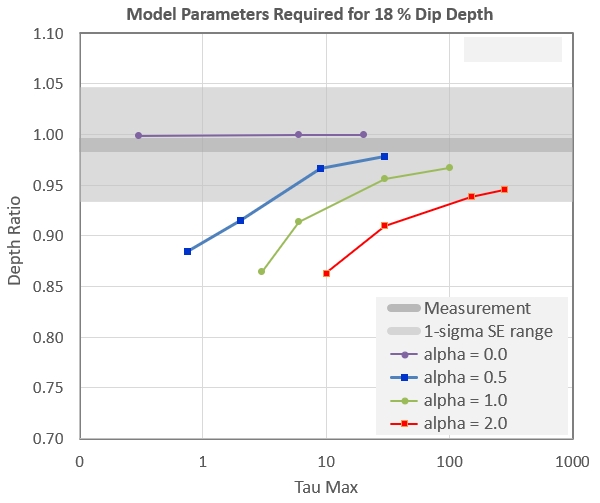
Figure 11. The measured depth ratio of 0.990 +/- 0.055 is
indicated by the gray horizontal bands. A variety of values for
Tau_max are chosen and cloud height is solved for to achieve the
chosen depth of 18 %. The resulting depth ratios are
plotted.
Here's how to read the above graph. Dips with depth = 18 % can
be produced by all values of Tau_max when alpha = 1 (only Mie
scattering). For each Tau_max there's a cloud size that produces the
18 % depth at g' band, but we're not interested in that parameter so
it isn't plotted. When alpha = 0.5 (no small particles present)
Tau_max values > 3 are within the 1-sigma measurement region.
When alpha = 1 (very few small particles present) Tau_max values
> 12 are required to produce depth ratios within the 1-sigma
measured region. When alpha = 2 (small particles present) Tau_max
values > 100 are required to produce depth ratios within the
1-sigma measured region.
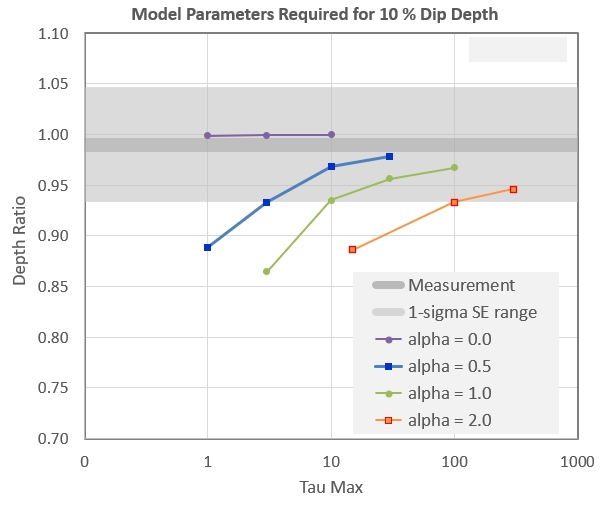
Figure 12. A variety of values for Tau_max are chosen and
cloud height is solved for to achieve the chosen depth of 10
%. The resulting depth ratios are plotted.
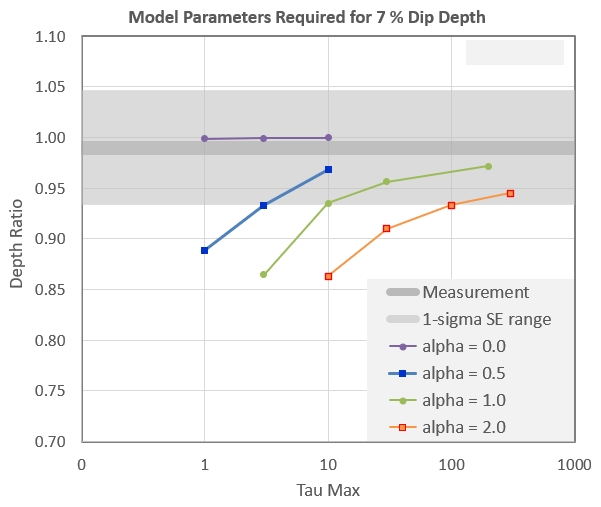
Figure 13. A variety of values for Tau_max are chosen and
cloud height is solved for to achieve the chosen depth of 7
%. The resulting depth ratios are plotted.
Additional model calculations reveal the relationship between
Tau_max and alpha for a wide range of dip depths (< 20 %).
%20lin.jpg)
Figure 14. Relationship between Tau_max and alpha for
dip depths < 20 %.
Here's how to read the above figure.
The measured dip depth ratio of 0.99 can be produced by models with
Tau_max and alpha specified by the central purple traces. For
example one way to produce a depth ratio of 0.99 is with Tau_max = 1
and alpha = 0.04 (bottom of purple trace). Another way to produce
the same depth ratio is with Tau_max = 1000 and alpha = 0.4. (The
need for negative alpha values is explained in the next section.)
The measured depth ratio has an uncertainty of 0.055, which means
that there's a 1-sigma chance that the true ratio could be as low as
0.935. This lower ratio can be produced by model parameters
specified by the blue trace. For example, Tau_max = 1 and
alpha = 0.25 is an acceptable model.
The 2-sigma depth ratio of 0.880 can be produced by a model with
Tau_max = 1. and alpha = 0.6.
Another way to describe the meaning of the above figure is to state
that if we adopt 1-sigma for accepting model parameters we are
forced to consider an area that is above the blue trace. And, if we
adopt 2-sigma for accepting model parameters we are forced to
consider an area that is above the red trace.
If for some reason we wanted to consider that all particles were
small, corresponding to alpha = 4, it would be impossible to create
a model that exactly matched the measured dip depth ratio of 0.99
because for the range of optical depths considered the model's dip
depth ratio is always < 0.93.
Interpreting Alpha
From basic physics we know that alpha = 0 corresponds to Mie
scattering (all particles are large), and we also know that alpha =
4 corresponds to Rayleigh scattering (all particles are small).
Perhaps we can be helped for the alpha values between -1
and 4 from calculations of plausible particle size
distribution (PSD) models that were reported for an investigation of
WD 1145+017 dust clouds presented in Xu et al. (2018).
Here is Fig. 7b from the Xu et al. (2018) paper:
Figure 15. Xu et al. (2018) Fig. 7b, showing the effect
of removing particles with radii smaller than the indicated
values.
According to this figure, with removal of particles smaller than 0.2
micron (a "cut-on" value) the ratio of extinction cross section for
our two wavelengths would be 1.025 (depth ratio = 1.025). This
corresponds to alpha -0.08 (notice that alpha is negative). Larger
particle cut-on values lead to alpha closer to zero. A cut-on at 0.1
micron can be estimated by doubling the wavelengths of our actual g'
and R bands and reading the 0.2 micron cut-on trace, yielding a
depth ratio of 0.87 and a corresponding alpha = +0.44. It is
reasonable to expect that adding more particles smaller than 0.1
micron will increase alpha. Thus, it will be convenient to use alpha
= 0.44 as a boundary for characterizing PSDs that are dominated by
small versus large particles. In other words, a PSD dominated by
small particles (radii < 0.1 micron) will have alpha > 0.44,
whereas PSDs consisting of only large particles (cut-on radii >
0.1 micron) will have alpha < 0.44. (This adopted alpha boundary
is reasonable for the g' and R band pair; it may not be a reasonable
boundary for other band pairs.)
Extinction Model for Particle Size Distribution
Given the importance of the PSD for this problem, and given that the
model calculations which are needed for this problem don't extend to
small enough particles, I decided to construct my own model for
creating analogs to Fig. 11. The starting point for this model is
shown in the next figure.
Figure 12. Raleigh scattering extinction cross-section
ratio versus particle size (no absorption).
Another version of thee plot above is shown in the next figure.
Figure 13. Extinction ratio for a single particle vs.
wavelength, as represented in my Excel spreadsheet (using log-log
scales). Particle absorption is assumed zero.
This figure isn't a perfect representation of the previous figure's
data, but I assume it will be adequate for present purposes.
Figure 14. Extinction ratio for a single particle vs.
wavelength, as represented in my Excel spreadsheet (using
linear-linear scales). Wavelengths for the two observing bands, g'
and R, are shown by triangle symbols.
Note that for a particle with radius = 0.16 micron the observing
wavelengths are near the "first null" (where particle circumference
= 1.8 times wavelength). Note also how the peak extinction for this
particle occurs at a wavelength of 1 micron. The range of
extinctions between wavelengths of 1 micron an 0.56 micron is 9.
My particle model assumes that number density varies with a size
exponent of -3.5 (cited in Izquierdo et al., 2018 as corresponding
to collision dust clouds). My first model was meant to resemble the
Figure 15. Rayleigh scattering extinction spectrum for a
PSD with a "cut-on" size of 0.20 micron. The total loss for 290
single particle sizes is shown as a thick black trace. The g' and
R band centers are shown by vertical lines.
The shape of this figure's total loss spectrum (with a peak at 0.6
micron) resembles the shape of Fig. 11, above (e.g., Fig. 7b in the
Xu et al. 2018 paper, with a "cut-on" size of 0.2 micron). The
similarity of shape adds confidence that my Excel spreadsheet model
is valid, and this means that my spreadsheet model can be used for
exploring other PSD model assumptions..
Figure 16. Cloud model predicted extinction ratio for R/
g; bands (which is the same as depth ratio for small optical depth
values) vs. PSD cut-on size. The measured depth ratio (for within
1-sigma) is shown by the thick gray band, and the 2-sigma values
are shown by the thin lines.
Since there is no way to convert extinction ratio (at R / g') to
alpha, because some ratios correspond to several alpha values),
let's consider using a plot of alpha vs. PSD cut-on radius as a way
to replace alpha with PSD cut-on radius as a new model parameter for
viewing observational constraints on cloud models..
Figure 17. The alpha value corresponding to the
extinction ratio (same as depth ratio when Tau_max is small) vs.
PSD cut-on radius based on a PSD model with 290 particles.
We can now use Fig. 10 to convert alpha to Tau_max for various
assumed depth ratios.
Figure 18. Tau_max required to account for observations
vs. PSD cut-on radius for three depth ratios (0.880, 0.935
and 0.980).
290log.jpg)
Figure 19. Tau_max required to account for observations vs. PSD
cut-on radius for three depth ratios (0.880, 0.935 and 0.980).
Here's how to read the above two graphs. Consider the left-most
point of the red trace (cut-on radius = 0.01 micron and Tau_max = 4.
A dust cloud with a PSD cut-on radius of 0.01 micron, with particle
number densities sufficient to produce Tau_max = 4, is capable of
producing dips with depth ratios = 0.935 (given that cloud height is
a free parameter). This corresponds to a 1-sigma uncertainty value
for our measurement of depth ratios. In other words, this cloud is
compatible with our measurements so we cannot rule-out the presence
of particles as small as 0.01 micron. The dashed green trace
corresponds to the 2-sigma case, which is even more acceptable in
terms of model requirements for Tau_max (and cloud height).
Discussion
Optically thin models for various minerals and a "cut-on" PSD dust
cloud show that in order for dip depth ratios, R-band/g'-band, to be
compatible with measured values the J0328 dust cloud must not
contain particles with radii < 0.1 micron.
References
Alonso, R., S. Rappaport, H. J. Deeg and E. Palle, 2016, A&A,
589, L6. link
Izquierdo, Paula, Pablo Rodriguez-Gil, Boris Y. Gansicke and 16
others, "Fast Spectrophotometry of WD 1145+017," 2018,MNRAS,
481, 703-714, link
Gary, Bruce L. and Thomas G. Kaye, "Absence of Small Dust Cloud
Particles Transiting the White Dwarf J0328-1219," 2024, arXiv
Xu, S.,S. Rappaport, R. van Lieshout and 35 others, "A Dearth of
Small Particles in the Transiting Material Around the White Dwarf
WD 1145+017," 2018, MNRAS, 474, 4795 - 4809, arXiv
Return to J0328-1219 observations web page: link

____________________________________________________________________
This site opened 2024.02.14. Nothing on this
web page is copyrighted.