Near Earth Asteroid
"(436724) 2011 UW158"
Light Curve & Other Optical Observations B. L. Gary, Hereford Arizona
Observatory (G95), Last edited 2015.10.02
Introduction
This web page describes my optical observations of Near Earth
Asteroid (436724) 2011 UW158. It was once identified by NASA as a
candidate for a future manned mission. Its appeal for this purpose
was based on it having an orbit similar to Earth's, rendering any
rendezvous with it as low energy. A close approach in mid-July of
2015 brought it to within 0.0165 a.u., or 6.4 times the distance to
the moon (on July 19). Radar observations were scheduled for July
13-26 at JPL's GTS (link)
and July 14-17 at Arecibo Observatory (link). The planning for
any human mission would require knowledge of the asteroid's rotation
period, shape, size, mass and surface properties. Since UW158 moving
"alongside" Earth at close range for almost 3 months, it has been
available for observation since mid-June, even by amateurs. It
remains within reach of amateur observing until early October (link), when
V-mag ~ 18.
Whereas this asteroid was initially identified as an interesting
target because of its perihelion being close to 1.0 a.u., it is no
longer of interest as a possible target for a human mission due to
the fast rotation and lack of encounter for another century and it
has instead become scientifically interesting because of its
fast rotation and large size! In fact, it is only one of three known
asteroids that rotate faster than the "spin barrier" for asteroids
with diameters greater than ~ 250 meters. Since it cannot therefore
be held together by self-gravity, it therefore must have sufficient
"tensile strength" to qualify as a "coherent rock." The asteroid's
shape is very elongated, with a "maximum to minimum dimension ratio"
of at least 3.4 (based on radar) or 6.6 (based on photometry). This
asteroid is a rare find, and I think it justifies continued
observation (until October, 2015).
Until someone takes on the task of hosting a web site specifically
for UW158 observations, those observations will be spread across the
internet at unknown web sites. I'm not aware of any central location
for submitting UW158 observations, where others can see and compare,
so I have created this web page as a temporary place for my
observations.
My first observation, on June 17 (possibly the first LC observation
of the 2015 apparition), suggested a short rotation period (~ 1/2
hr), and my second observation (Jun 20) confirmed this with a
high-quality rotation period of 36.665 minutes. The Jun 17
observation was the first suggestion that this asteroid was special,
being a fast rotater while not being small (i.e., spinning faster
than the 2.2-hr "spin barrier" for asteroids larger than ~ 250
meters). Subsequent observations have confirmed this, and this is
only the 3rd asteroid known to be spinning faster than the 2.2-hr
spin barrier (meaning that it's a rock, knocked off of a larger
asteroid, and not the usual "rubble pile" that most asteroids
smaller than ~ 10 km are thought to be.) Low-resolution optical
spectra were obtained on 3 dates, showing that the asteroid has a
typical slightly reddish color. The "range of variation" exhibits
large changes, starting at from ~0.5 magnitude (Jun 17), reaching a
peak of 2.05 magnitude (Aug 04) and decreasing to 0.86 magnitude
(Oct 01). The largest range of variation corresponds to a solid
angle that varies during rotation with a ratio of 6.6:1, meaning
that longest dimension would be 6.6 times the shortest dimension
under the simplest of assumptions. One pole (axis of rotation)
points to RA/DE coordinates 17:30+10. The phase curve suggests that
geometric albedo = 39 ± 9 % and the maximum solid
angles seen during a rotation corresponds to a sphere with a diameter
= 220 ± 40 meters, which is consistent with a radar size
of 160 x 550 meters (rectangular equivalent, broadside view).
A more careful analysis shows that UW158 has a smallest radius that
permits "rubble pile" dynamics (i.e., a loose regolith around the
asteroid's mid-section), while the longest dimension does not permit
"rubble pile" dynamics (i.e., a loose regolith would fly away,
leaving bare rock). In other words, UW158 is the only known asteroid
that straddles the 250 meter "size barrier" while spinning faster
than the 2.2-hour "spin barrier"! This situation creates an
interesting opportunity for speculation about surface conditions.
Either there is a high albedo regolith around the mid-section, with
low albedo bare rock exposed at the ends, or the ends are conical
shaped and therefore subject to being in shadow when viewed end-on
for most phase angles (permitting almost any regolith distribution
and albedo). These speculations are described in a manuscript (link) that has just
been submitted to the Minor Planet Bulletin.
All observations are theoretically compatible, and can be understood
using the phase curve relationships described by Belskaya and
Shevchenko (2000), hereafter referred to as B&S. These
relationships, using phase curve slope to predict geometric albedo
and the size of the opposition effect (OE), are based on
measurements of large asteroids for phase angles within the range 1
to 24 degrees. The B&S analysis employs a phase curve relation
proposed by Shevchenko (1996, 1997), hereafter referred to as S97.
There is interest in evaluating whether the B&S relationship,
involving the S97 phase curve model, is valid for small asteroids
(<10 km), and for phase angles greater than 24 degrees; the
analysis presented here suggests that UW158 is compatible
with the B&S model.
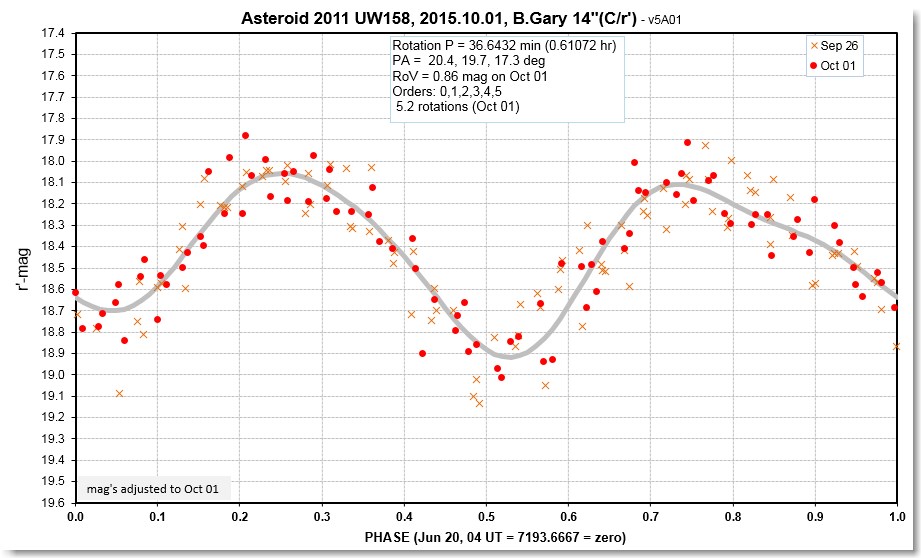
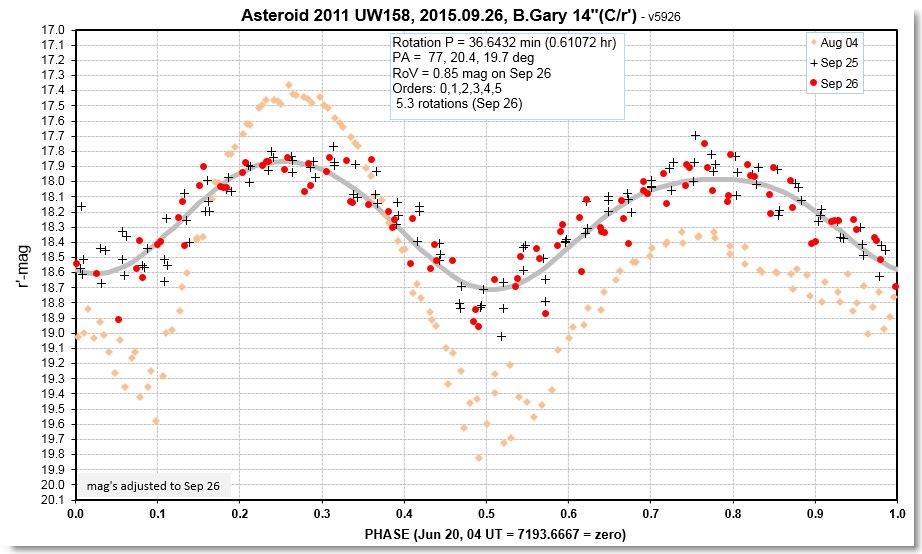
Rotation LC, showing Aug 04 and last two observing dates.Model
fit is for Oct 01.
Latest Light Curve
Unfiltered LC for 6.2 rotations on 2015 Oct 01.
ASCII Data Files
The following links are for text files (ASCII format) of my UW158
observations. All data
files have been submitted to the IAU MPC archive (and exist there
with ALCDEF format).
For the data files linked below, the 1st column of data is JD for
mid-exposure minus 2450000 (not corrected for light time). The 2nd
column is magnitude calibrated using APASS r' magnitudes (typically
20 reference stars). All image sets have star-subtraction so there
should be a minimal level of artifacts produced by background stars.
The 3rd column is estimated SE that is a gross over-estimate. These
SE uncertainties assume that real variations are slow compared with
image spacing (because they are calculated from neighbor
differences). The actual SE values are probably 1/4th of those
given.
Jun 17
First photometric LC (showing that P is very short, ~ 1/2 hr,
and RoV ~ 0.5 mag)) Jun 20
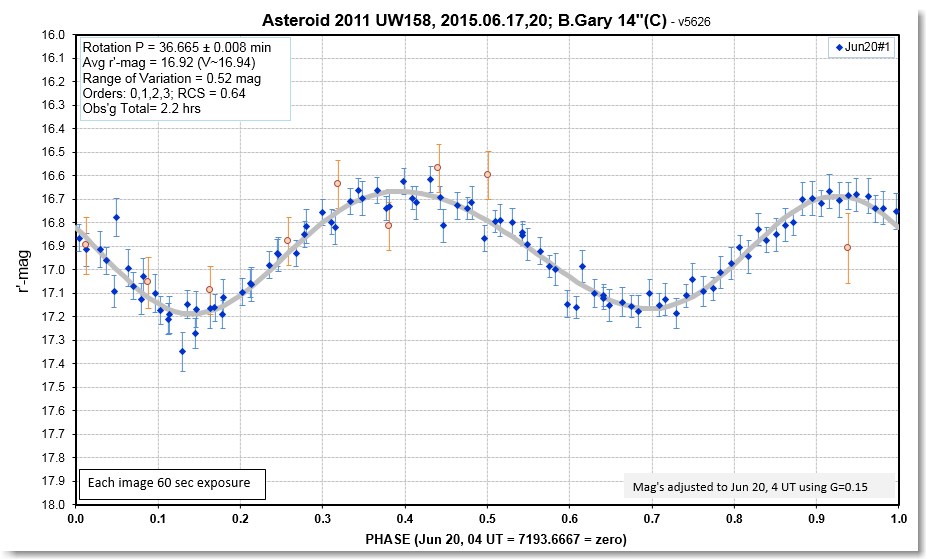
Second photometric LC (3.1 rotations, establishing P = 36.66 min
& RoV = 0.52 mag)
Jun 24 Four filter LCs (g'r'i'z'), aborted
early due to clouds
Jul 02 Four filter LCs (g'r'i'z'), showing a
slightly blue SED & suggesting presence of weak Band I
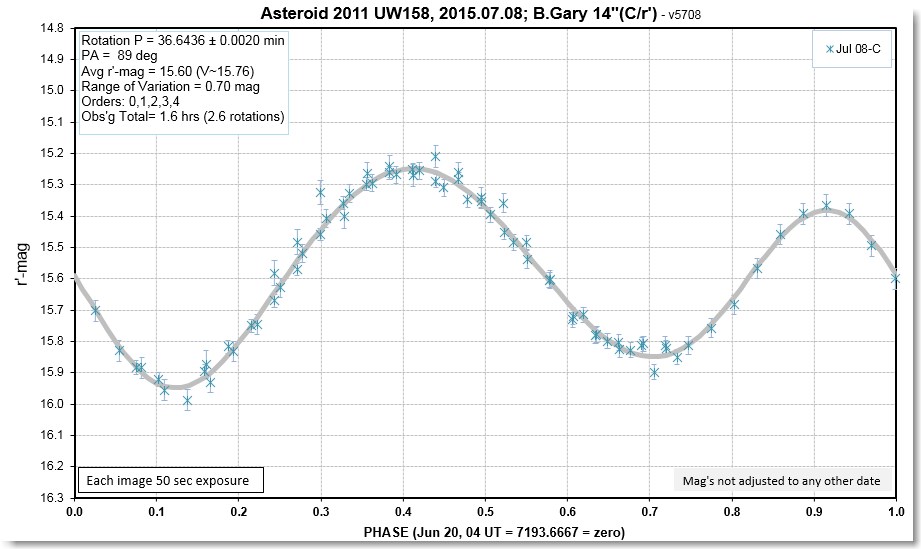
feature Jul 08
Unfiltered LC, 2.6 rotations, showing shape change: RoV increase
to 0.70 mag. SA-100 spectrum.
Jul 09 SA-100 spectrum. Slightly red SED. LC
data possible but would require additional analysis
Jul 11 SA-100 spectrum. Slightly red SED. LC
data possible but would require additional analysis Jul 12
Unfiltered LC, showing essentially the same rotation LC as on
Jul 08; RoV ~ 0.70 mag Jul 20
Unfiltered LC, showing big change in rotation LC shape since Jul
12; RoV = 0.92 mag Aug 03
Unfiltered LC, 1.77-hr observation, showing RoV = 1.95 mag and
fading of secondary maximum Aug 04
Unfiltered LC, 1.62-hr observation, showing slight change in
rotation LC; RoV = 2.05 mag Aug 13
Unfiltered LC, 3.27-hr observation, showing slight change in
rotation LC; RoV = 1.84 mag Aug 29
Unfiltered LC, 1.91-hr observation, showing
slight change in rotation LC; RoV = 1.46 ma Sep 06
Unfiltered LC, 2.45-hr observation, showing slight change in
rotation LC; RoV = 1.25 mag Sep 15
Unfiltered LC, 3.21-hr observation, showing slight change in
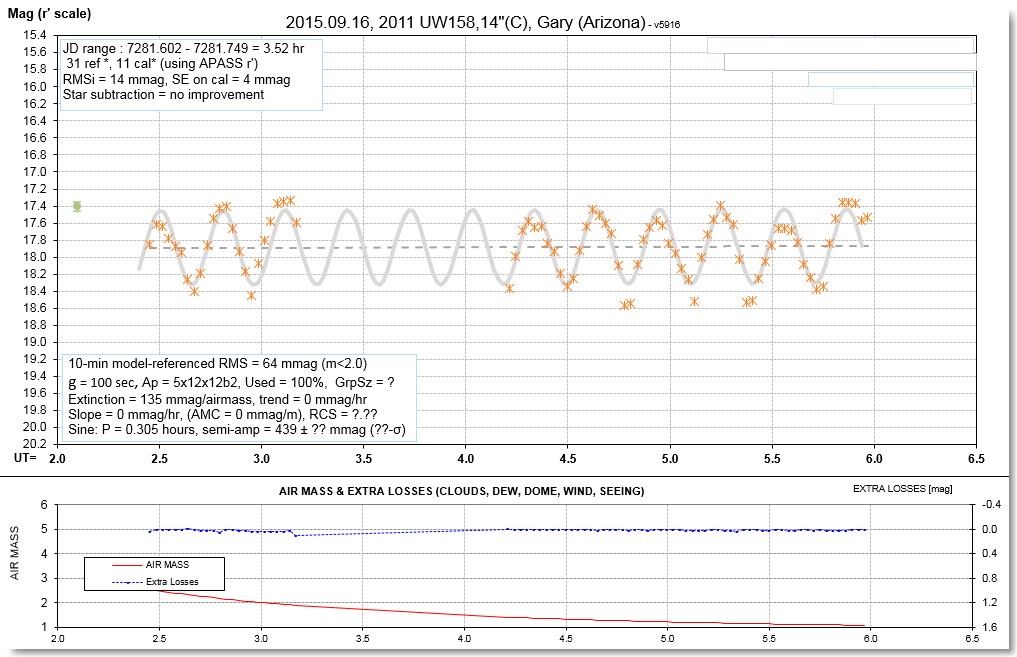
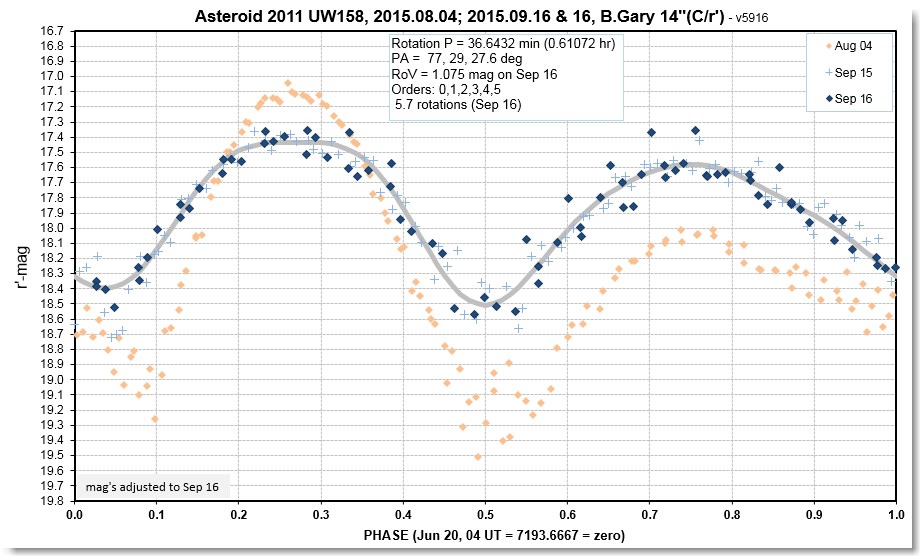
rotation LC; RoV = 1.07 mag Sep 16
Unfiltered LC, 3.52-hr observation, showing slight change in
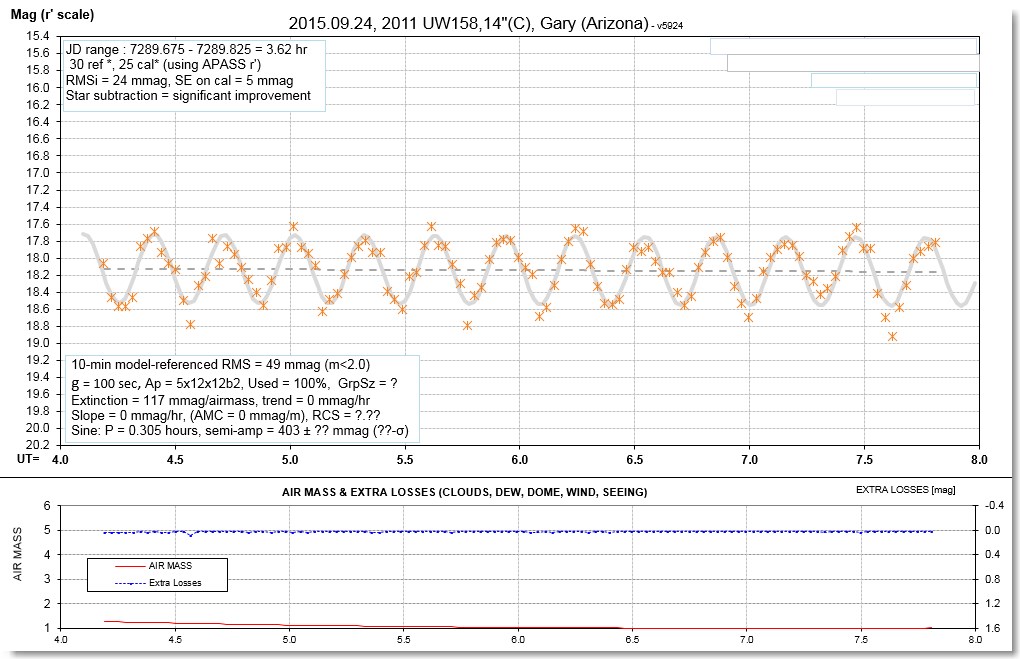
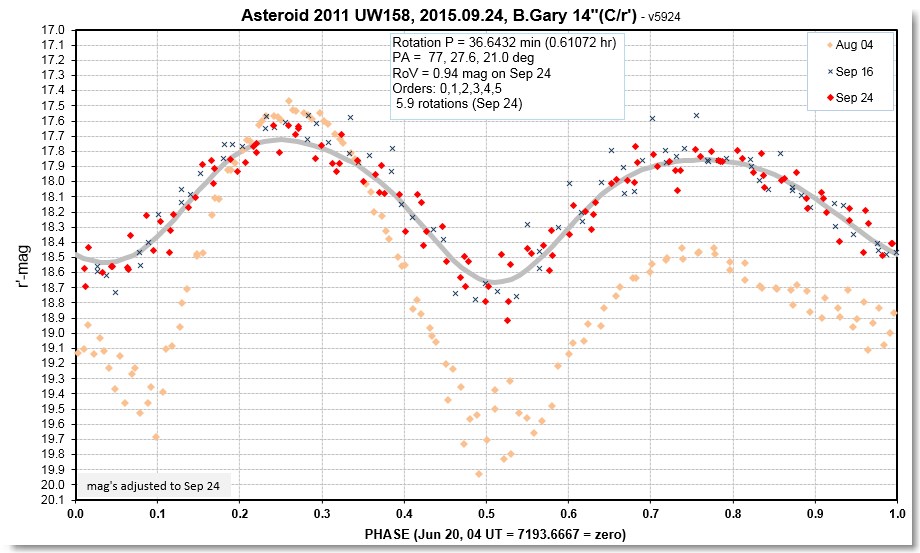
rotation LC; RoV = 1.08 mag Sep 24
Unfiltered LC, 3.62-hr observation, showing slight change in
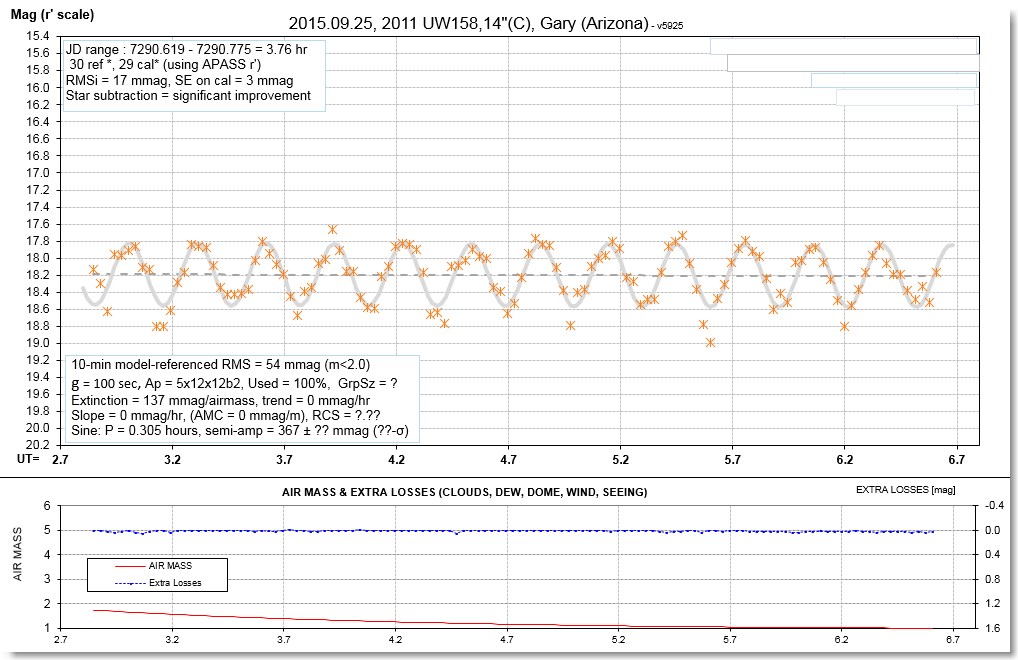
rotation LC; RoV = 0.94 mag Sep 25
Unfiltered LC, 3.76-hr observation, showing slight change in
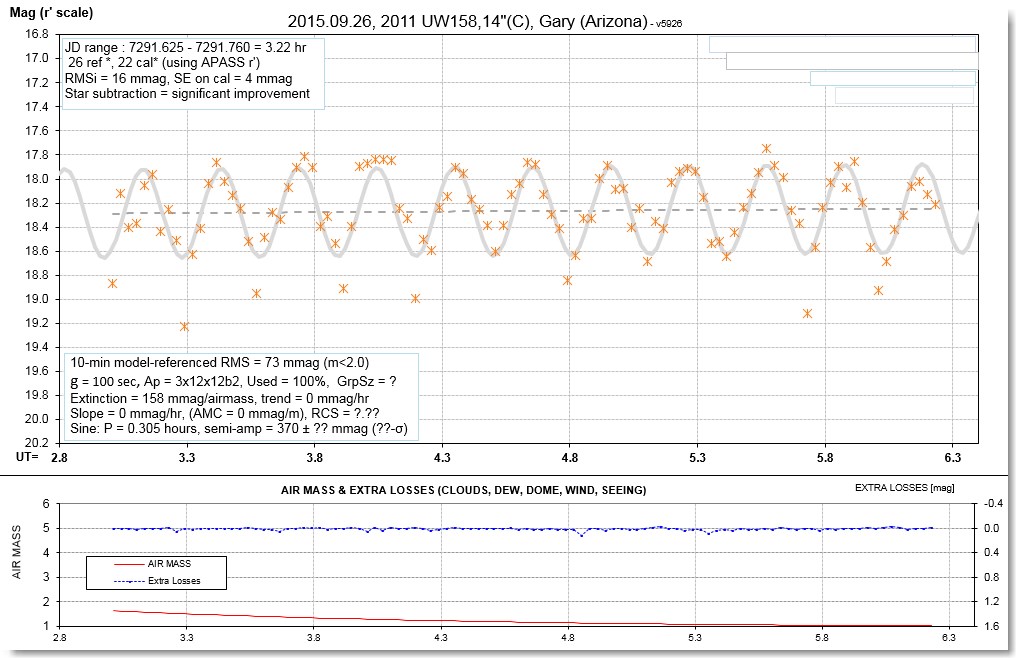
rotation LC; RoV = 0.89 mag Sep 26
Unfiltered
LC, 3.22-hr observation, showing slight change in rotation LC;
RoV = 0.85 mag Oct 01
Unfiltered LC, 3.21-hr observation, showing essentially no
change in rotation LC; RoV = 0.86 mag.
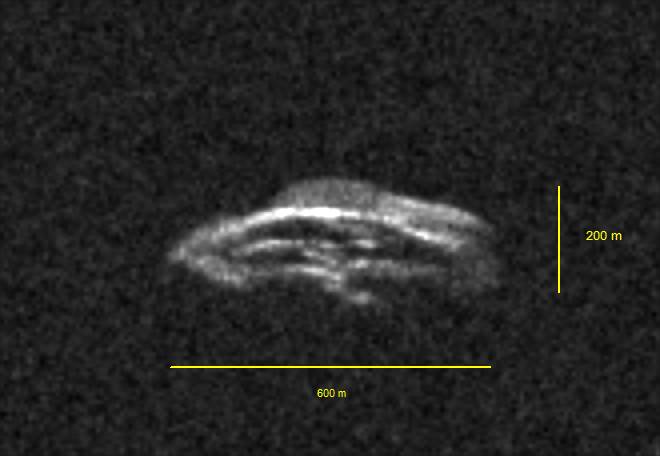
Radar Truth
JPL & Arecibo radar observations have shown that
the effective diameter is larger than anyone predicted. The JPL
dimensions are >150 x >320 m while Arecibo measures
300x600 m. Since Arecibo SNR is greater it sees "more" of the
asteroid, so this size is preferred.
Keep in mind that since the asteroid does not have a rectangular
shape, but is not rounded in all cross-sections, the equivalent
size for the radar cross-section is ~ 500 x 170 m. Also, keep in
mind that the radar y-axis is depth (distance from observer),
which is not the same as the dimension in the sky plane that is
orthogonal to the rotation axis. In other words, it would not be
correct to state that the "solid angle" in the sky can be
calculated from the two dimensions of the radar cross-section.
Nevertheless, the radar cross-section dimensions would be a good
first-guess for estimating the "solid angle" in the sky plane
(which is needed for converting photometry to equivalent size).
Thus, a good first-guess estimate for solid angle is a sphere
with diameter ~ 300 meters.
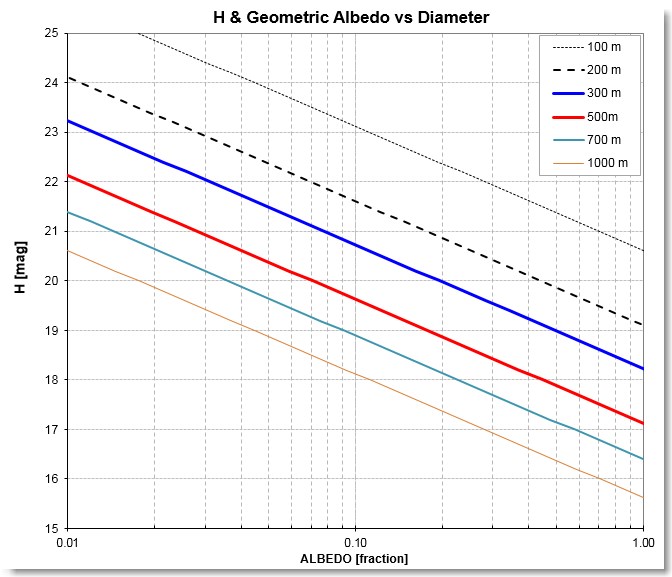
The following graph will be useful in estimating geometric
albedo, Ag, for an assumed H, provided we know diameter.
If we adopt a diameter of 300 meters, for example (red
trace), and if we further assume H = 19.5, then geometric
albedo = 0.30 (30%). Phase Curve
The discovery V-mags were fitted by the HG model with H = 19.5 and G
= 0.15, which means that the rotation-averaged V-mag must have been
~ 20.65 (averaged over a 10-day hypothetical observing window,
during which phase angle ranged from 21.6 to 14.3 deg). Since all my
observations are calibrated using stars with APASS r'-mags, I have
adjusted the 2011 mag's by -0.23 to arrive at their r' values (this
is based on UW158's color, as measured on 3 occasions and described
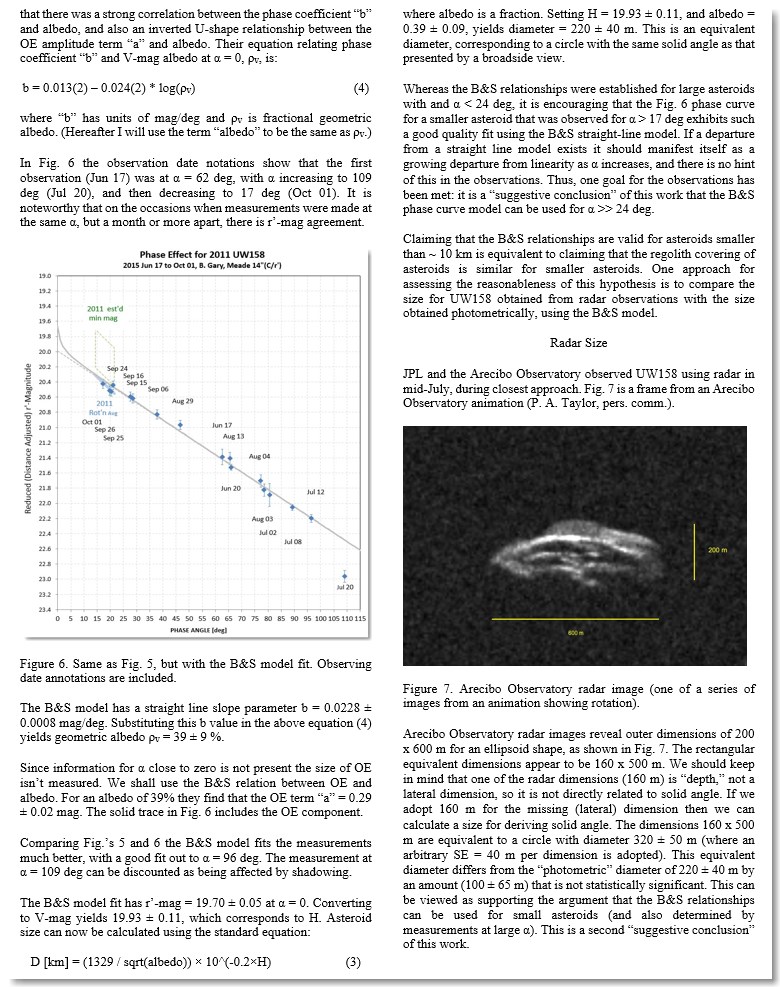
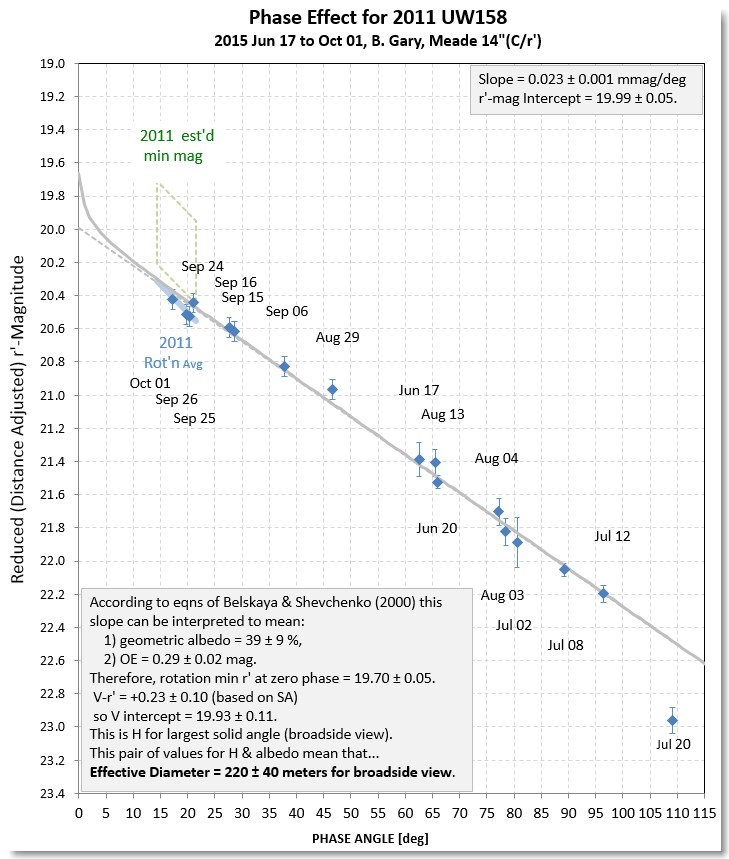
below). The following phase curve shows these rotation-averaged
r'-mags with a thick, light blue trace. The green box above it is a
suggested region for the maximum brightness during rotation. We
don't know the orientation yet so this box is a conservative
estimate. My r'-mag measurements for maximum brightness with
rotation (rotation phase 0.5) are shown for phase angles > 17
deg.
Reduced r'-mags vs. solar phase angle, corresponding to maximum
rotation brightness, for my observing sessions, fitted
using a model first proposed by Shevchenko (1996, 1997) and
elaborated by Belskaya & Shevchenko (2000). The 2011 discovery
V-mag (rotation-average) is shown as a light blue line at phase
angles 14 to 22 deg (2011 Oct 25 to Nov 3), where V-mag is
converted to r'-mag by subtracting 0.23 mag (corresponding to
UW158's color). The green box above the rotation-averaged 2011
r'-mags is my suggestion for maximum brightness during rotation (a
rotation LC was not produced in 2011 so I've had to estimate how
much brighter the green box could have been). The model fit is
compatible with all of the 2015 measurements (except for the one
with PA = 109 deg) and it is also compatible with the range of
brightness estimated for 2011.
In this phase curve the July 20 observation at PA = 109 deg is
fainter than the straight-line fit, and is not used for constraining
the model since shadowing may have been severe. All of my photometry
LC observations can be fitted by the B&S model, except for the
large phase angle one (Jul 20) just mentioned.
If UW158 obeys the Belskaya & Shevchenko (2000) relationship
between phase effect slope and geometric albedo, as well as the
opposition effect delta-mag vs albedo, and if these relationships
apply to large phase angles for UW158, then UW158 has a geometric
albedo = 39 ± 10 % and diameter = 220 ± 50 meters. This diameter is
compatible with the radar observation.
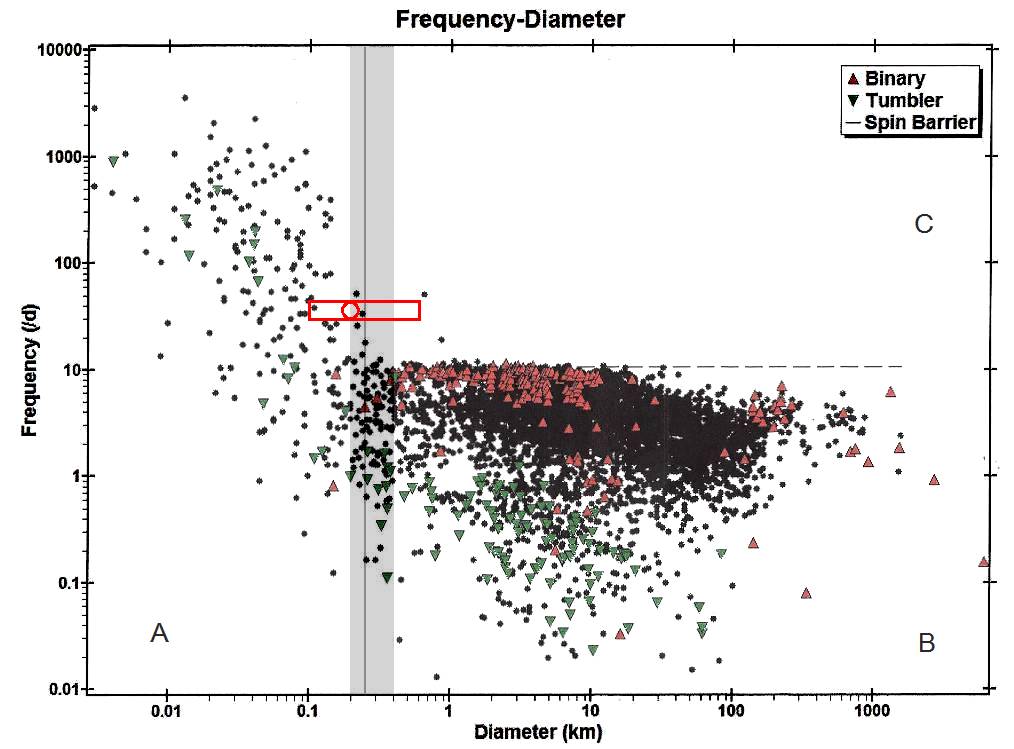
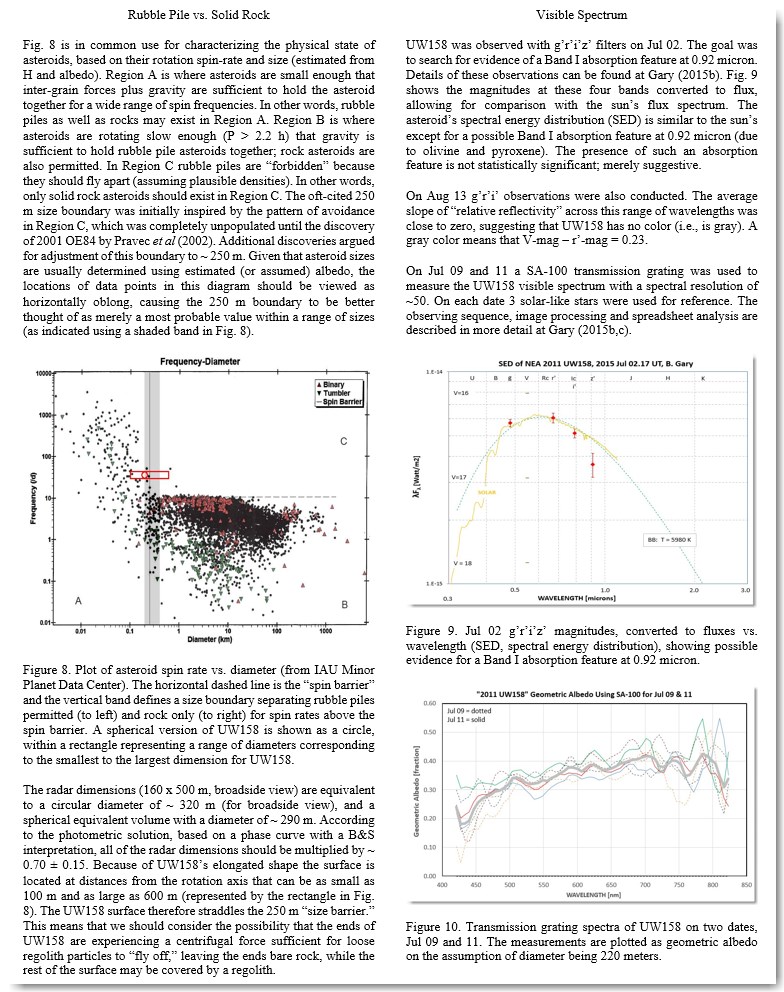
Spin Rate vs. Diameter Diagram
UW158 is unusual in the sense that it's an outlier in the "rotation
frequency/diameter" diagram, as we can now be confident that it is
located above the 2.2-hour rotation period "barrier" for asteroids
larger than ~ 250 meters (next figure). Because it rotates so fast
we can speculate about regolith thickness at the ends. We may also
speculate about the possibility of large OE. An IRTF spectrum can
help in understanding a high albedo, if that's the case. Regardless
of my outrageous speculations I think it's sufficiently prudent to
claim that UW158 is an interesting asteroid.
Figure 1 (repeat). Plot of asteroid rotation frequency
vs. size (as compiled and displayed at the IAU Minor Planet Center
Asteroid Light Curve Database web site, link below). The left
end of the red rectangle corresponds to UW158's smallest radius
of an ellipsoidal shape (160 meters), while the right end
corresponds to the largest radius of UW158's ellipsoidal shape
(550 meters). The vertical line at 250 meters is
a size barrier for fast spinning asteroids: larger ones can only
exist if they're a rock, smaller ones can exist even when they
are mere rubble piles. (Chart is from IAU Minor Planet Center,
modified by the author to show the 250 meter barrier and UW158's
location). The red rectangle shows where UW158 would lie if
it has a diameter of 320 meters.
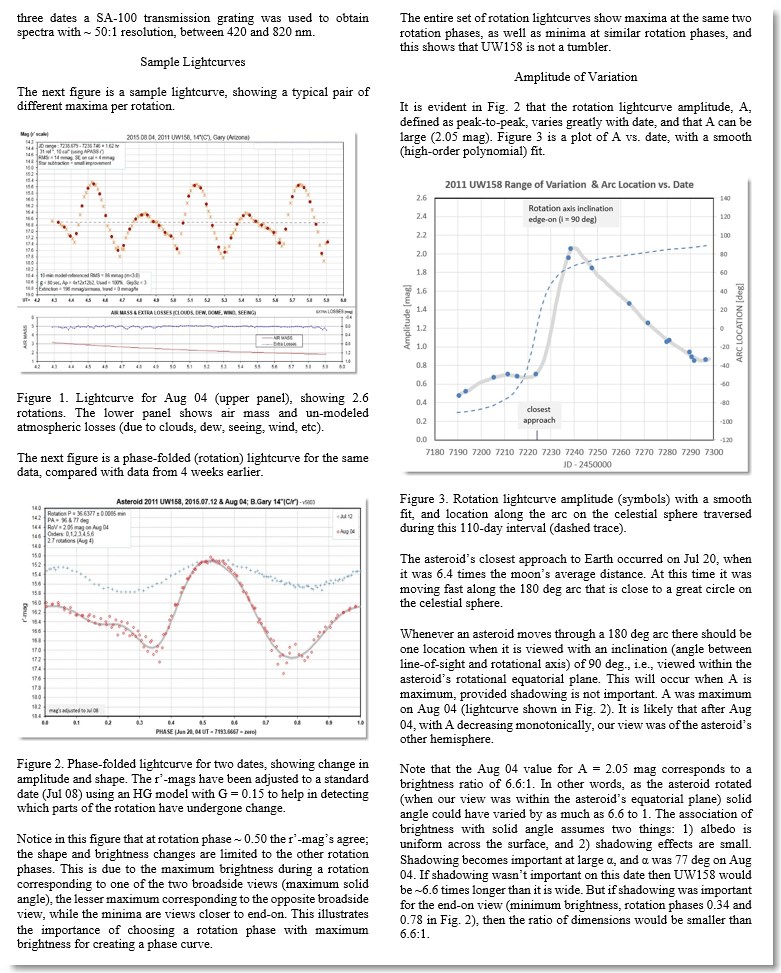
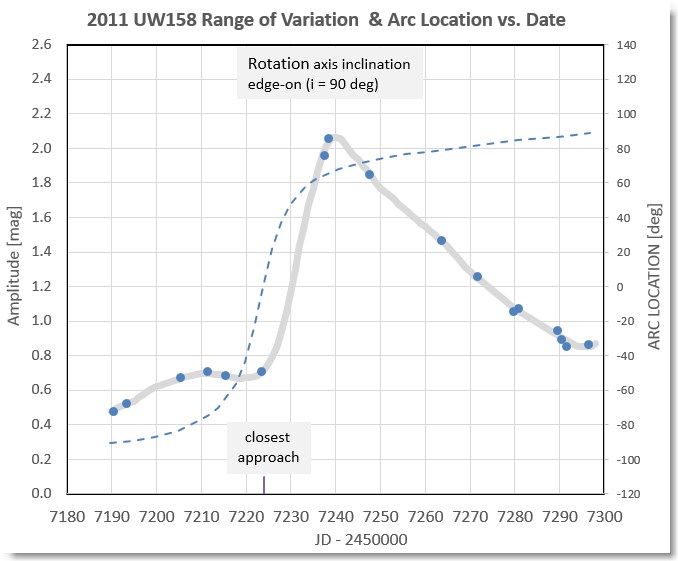
Range of Variation vs. Dateand Spin Axis Orientation
Range of variation vs. JD - 2450000, with smoothed fit
(11th-order), plus location along a 180-deg long arc on the celestial sphere
that the asteroid traversed during the 90 days of observations
(dashed trace). [I'm using the term "inclination" in the way it is
used by the exoplanet community.]
The first observation of this 2015 apparition had the smallest range
of variation, so this is when we must have been viewing it closest
to pole-on. The range of variation changed fast after closest
approach, when the asteroid's motion brought it into an equatorial
view on about Aug 05. The Earth's sub-latitude changed more slowly
after then because the asteroid moved more slowly along it's
celestial sphere arc.
In order to determine the spin axis orientation we must consider the
fact that UW158 resembles an ellipsoid that is much longer than it
is wide. The 2.05 mag range of variation on Aug 05 means that the
solid angles varied during rotation with a maximum to minimum ratio
= 6.6 (assuming uniform albedo across the surface). An ellipsoid is
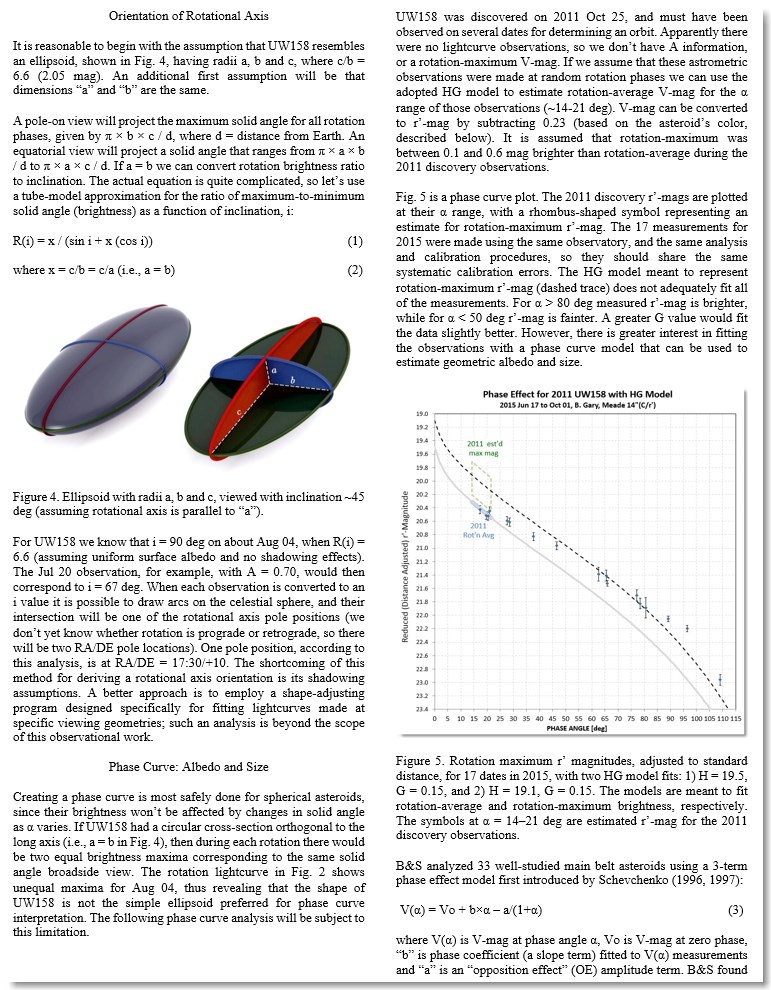
defined by 3 radii, a, b and c, as illustrated by the following
figure.
Ellipsoid with radii a, b and c, viewed from an inclination of ~
45 deg (assuming that the rotational axis is parallel to "a").
A pole-on view will project the maximum solid
angle for all rotation phases, given by π× b × c / d, where d =
distance from Earth. An equatorial view will project a solid angle
that ranges from π× a × b / d to π× a × c / d. If we could
assume that a = b then we could convert rotation brightness ratio
to inclination. The actual equation is quite complicated, but an
approximation for the ratio of brightness (maximum / minimum) as a
function of inclination, i, is:
R(i) = x / (sin i + x (cos
i))
where x = c/b = c/a (i.e., a
= b).
For UW158 we know that i = 90 deg on Aug 05,
when R(i) = 6.6. The first observation (Jun 17), with R = 1.54
(delta-mag = 0.47), must be at i = 59 deg. When each observation
is converted to an i value in this way it is possible to draw arcs
on the celestial sphere, and where they intersect is one of the
rotational axis pole positions (we don’t yet know whether rotation
is prograde or retrograde, so there will be two RA/DE pole
locations). One pole position is RA/DE = 17:30/+10.
Cucumber
Mmodel #1
Note the extreme range of variation when JD-2450000 = 7238 (Aug
04). This must be an equatorial view (sub-Earth latitude of zero,
inclination = 90 deg). The range of variation is 2.05 +/- 0.10
mag, which corresponds to a brightness ratio of 6.6 +/- 0.6. If we
were dealing with an ellipsoid with uniform albedo across the
surface, and if PA were zero, the 6.6 ratio would correspond to
the solid angle ratio, and this would mean that a x b / c^2 = 6.6.
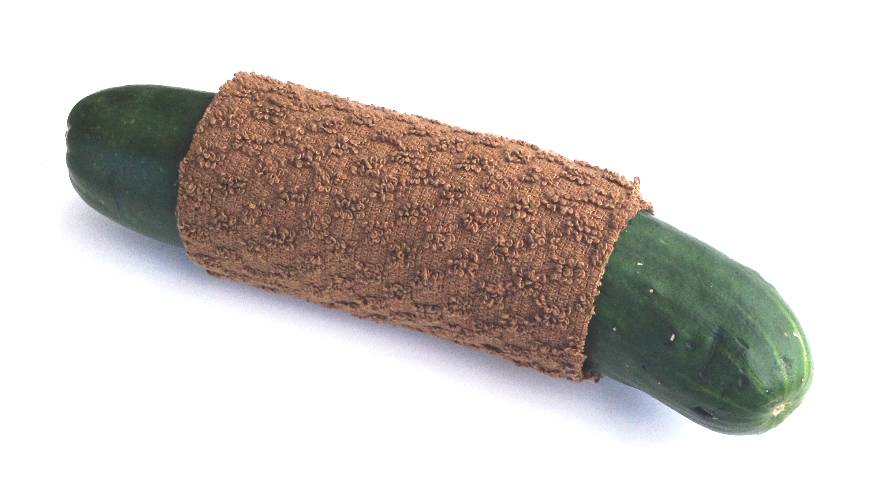
This elongation resembles a cigar. But the radar dimensions call
for a more modest ratio of 3.44 +/- 0.15 (550 / 160). This
elongation resembles a cucumber. What model can produce a much
larger range of variation for a cucumber shape?
Consider that fact that in Fig. 1 the longer dimension exceeds the
250-meter barrier for fast rotaters, and the smaller dimension is
smaller than the 250-meter barrier. This means that loose regolith
will fly off the ends of the asteroid, but will be stable around
the mid-section. In other words, there might be a belt of regolith
around the mid-section. Imagine a cucumber with a cloth wrap
around the middle, as depicted here.
Cucumber wrapped in cloth, resembling a cucumber-shaped
asteroid with regolith covering the mid-section (Cucumber Model
#1).
If the bare rock has a lower albedo than
regolith material, then an end-view will be fainter than the solid
angle argument would predict. This is my Cucumber Model #1.
There's one potential problem with this model. Regolith is usually
darker than the rock that it's made from, not brighter. Throughout
the solar system regolith darkens with time. I'm not completely
abandoning this model, but it does lead to my Cucumber Model #2.
Cucumber Model #2
Consider a cucumber viewed edge-on but illuminated by the sun at
some phase angle, such as 45 deg. If we model the end of the
cucumber as a cone, then it will be apparent that ~ 1/2 of the
cone will be in shadow. Thus, the brightness of an end-on view
will be ~ 1/2 of what the solid angle argument would predict. The
broadside view would be less affected by shadowing. This, in turn,
would cause the ratio of brightnesses during a rotation (as
viewed from the equatorial plane) to approximately double. This is
almost exactly what was observed.
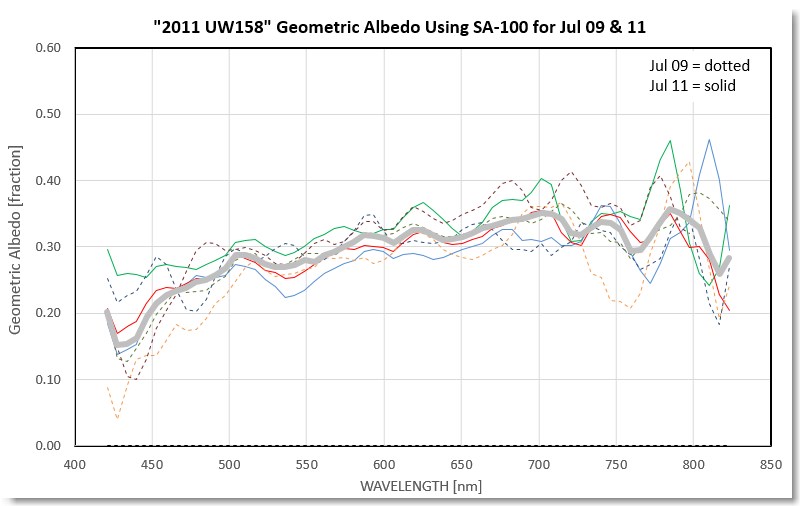
Albedo Spectrum in the Visible
Region
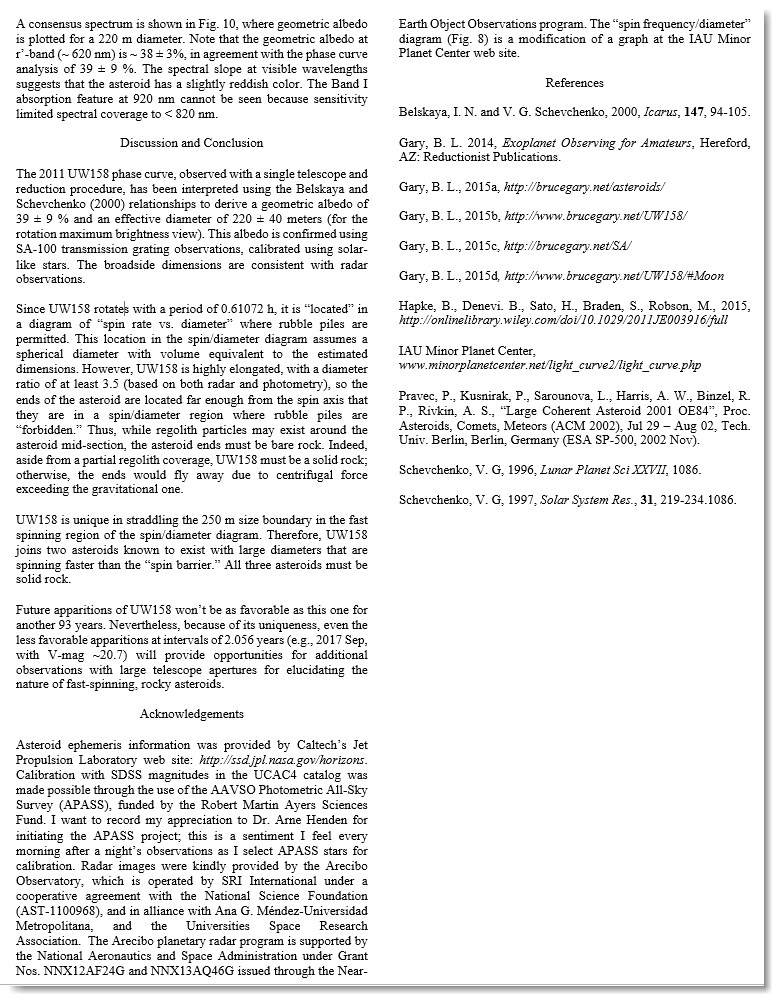
Transmission grating observations on two dates (July 9 & 11)
yield identical results for albedo spectral shape. I have chosen to
present them in the form of "geometric albedo" instead of "relative
reflectivity."
Albedo spectrum for two observing sessions, showing agreement of
overall value and shape (red slope). The overall albedo is highly
uncertain due to inherent shortcomings in attempting to interpret
the phase curve. Because of this uncertainty the albedo scale is
subject to an unknown multiplier; the albedo structure is
unaffected by this uncertainty. Due to low SNR at short and long
wavelengths only data between 420 and 820 nm are shown.
On these dates (and for the rotation phases sampled) UW158 was
slightly red. There is no information about the presence of a 1
micron absorption feature due to the low SNR beyond ~ 820 nm.
Observing Session
Data
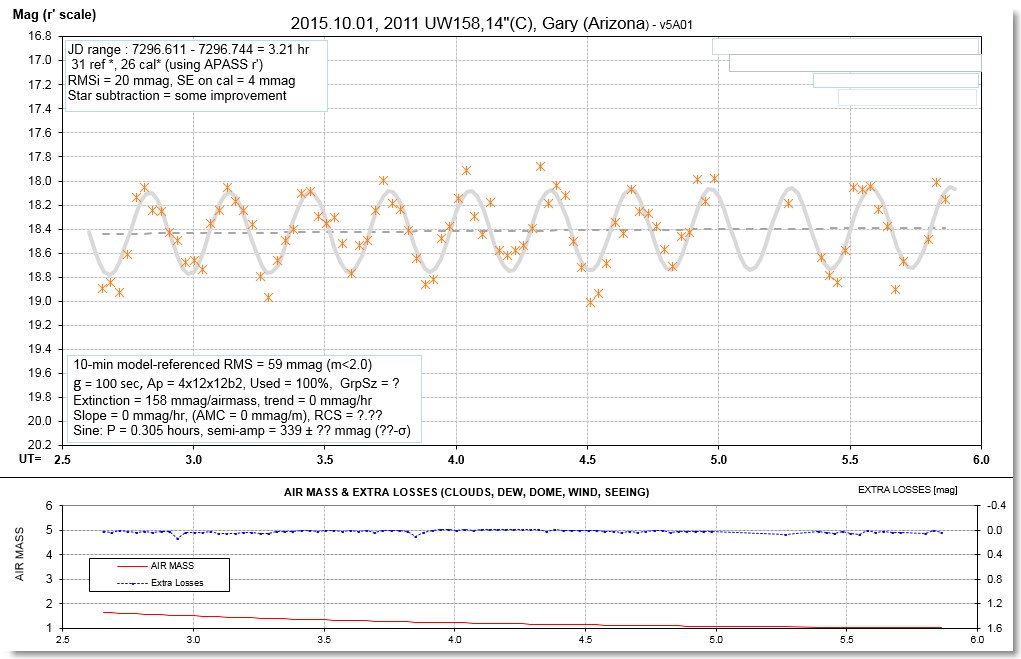
2015.10.01 Observation
This observing session was made using C filter that
included 5.2 rotations, showing slightly smaller "range of
variation" as the day before, 0.86 mag.
2015.09.26 Observation
This observing session was made using C filter that
included 5.3 rotations, showing slightly smaller "range of
variation" as the day before, 0.85 mag.
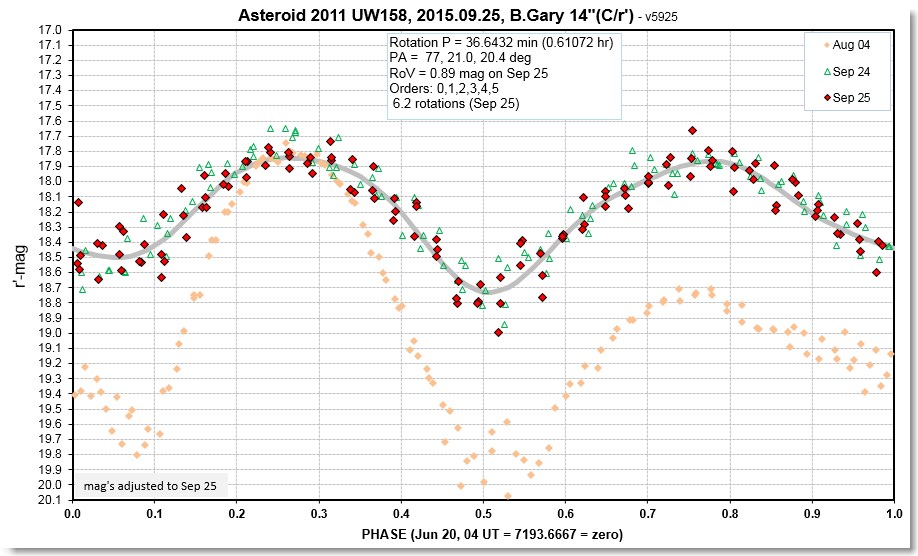
2015.09.25 Observation
This observing session was made using C filter that
included 6.2 rotations, showing slightly smaller "range of
variation" as the day before, 0.89 mag.
2015.09.24 Observation
This observing session was made using C filter that
included 5.9 rotations, showing slightly smaller "range of
variation" as the day before, 0.94 mag.
2015.09.16 Observation
This observing session was made using C filter that
included 5.7 rotations, showing same "range of variation"
as the day before, 1.07 mag.
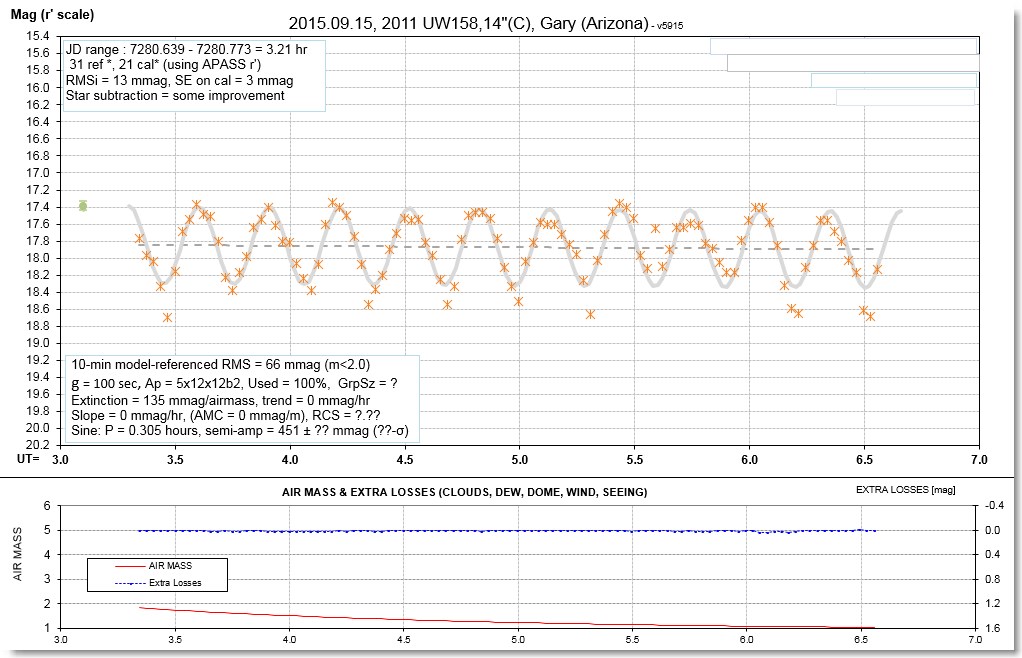
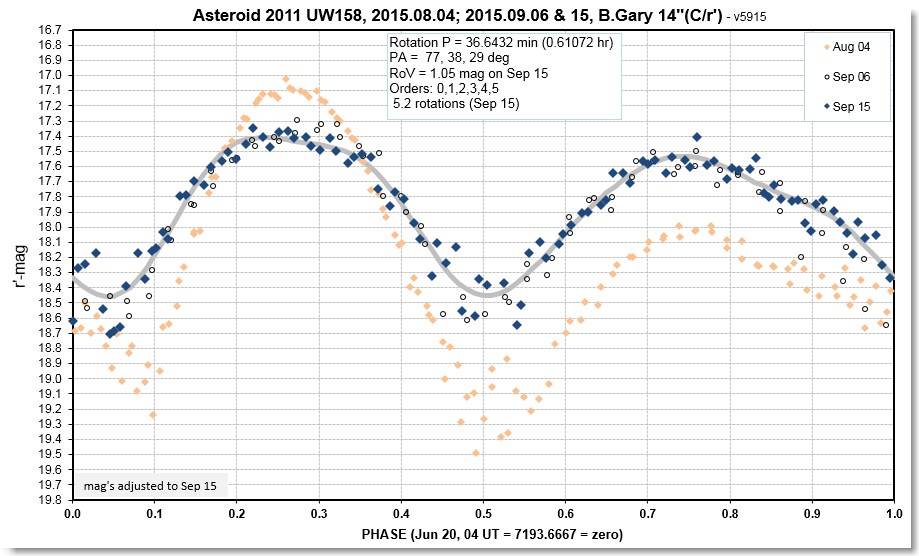
2015.09.15 Observation
This observing session was made using C filter that
included 5.2 rotations, showing slightly smaller "range of
variation" = 1.07 mag.
Model fit is for 2015 Sep 15 data.
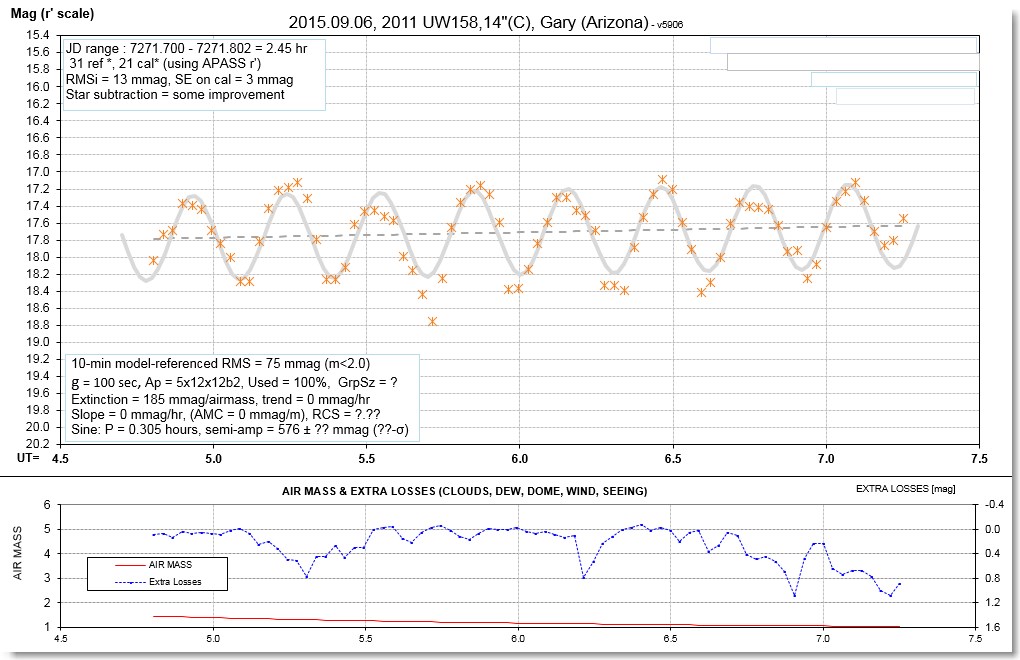
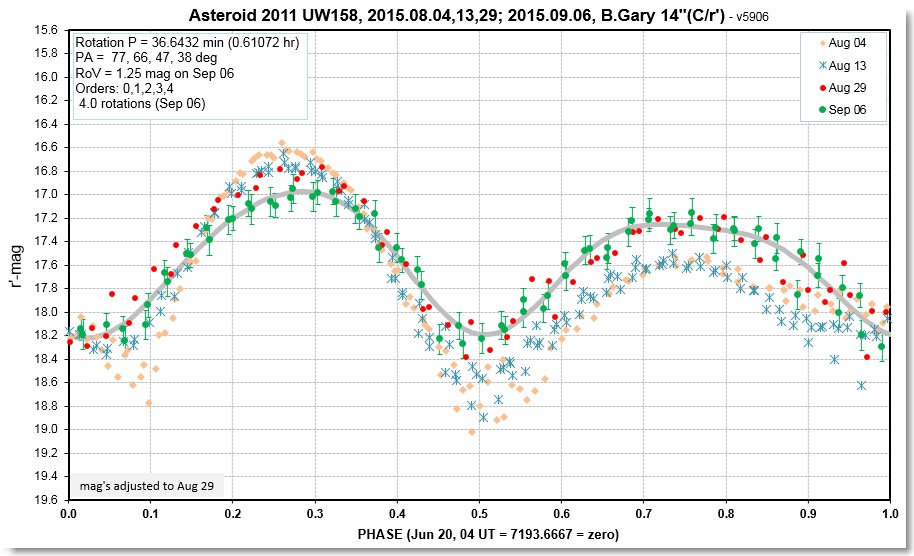
2015.09.06 Observation
An observation was made using C
filter that included 4.0 rotations, showing slightly smaller
"range of variation" = 1.25 mag.
Rotation LC with model fit to Sep 06 data.
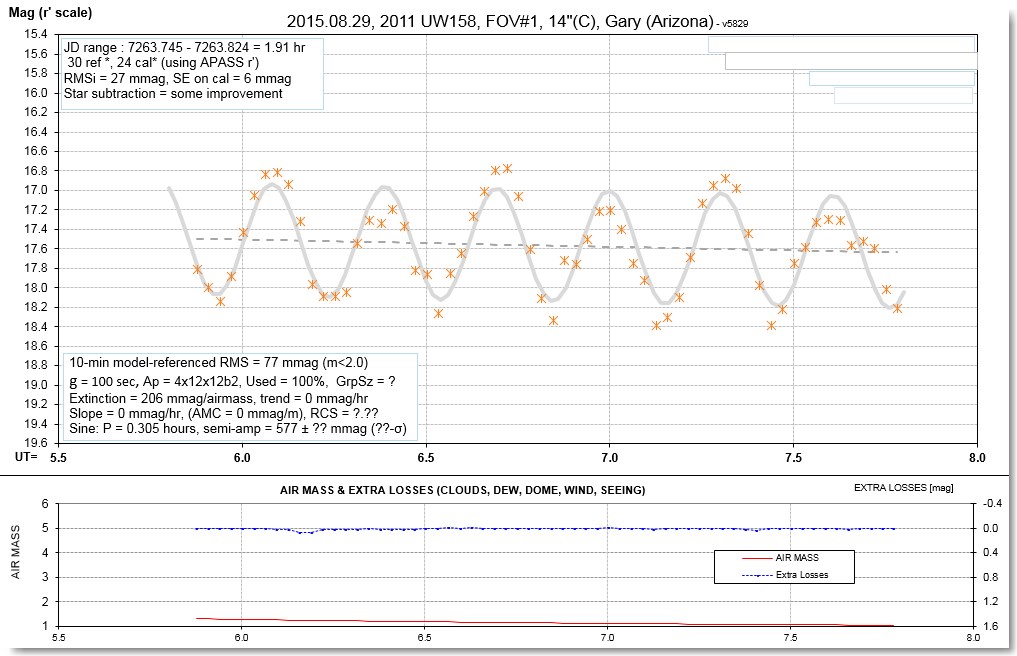
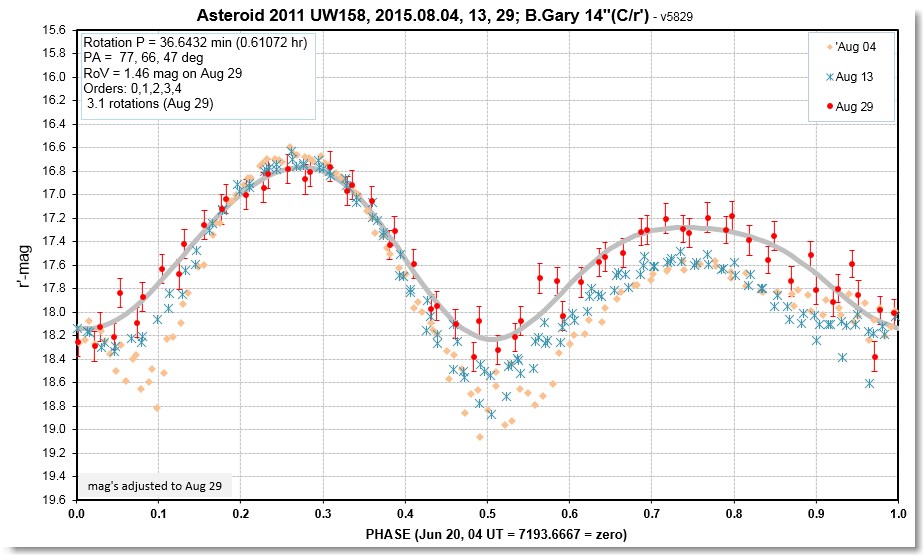
2015.08.29 Observation
An observation was made using C filter that included 3.1 rotations,
showing slightly smaller "range of variation" = 1.46 mag.
Rotation LC with model fit to Aug 29 data.
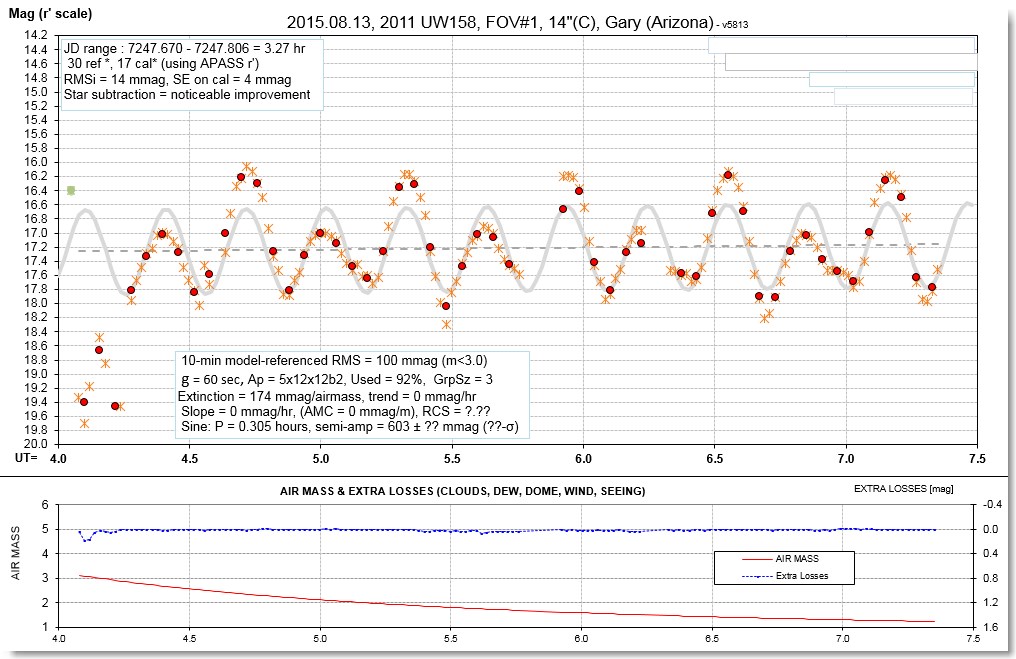
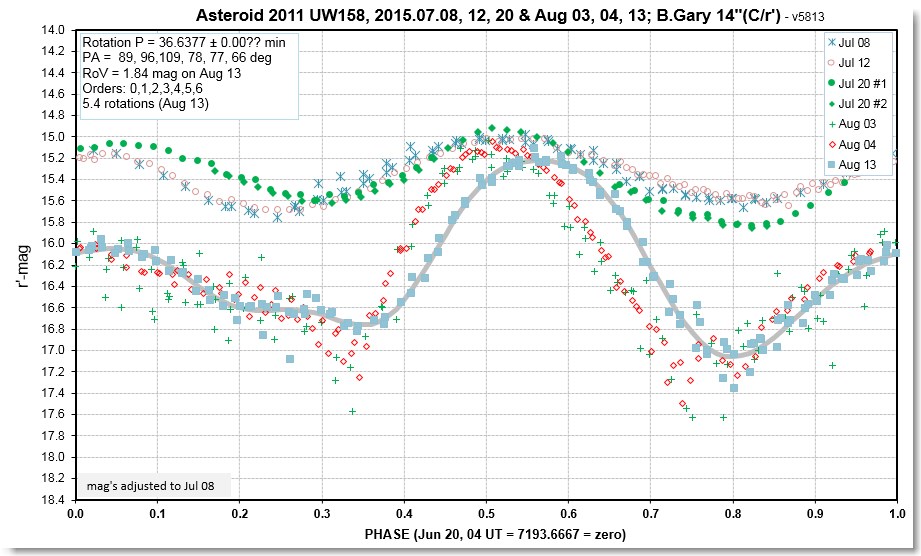
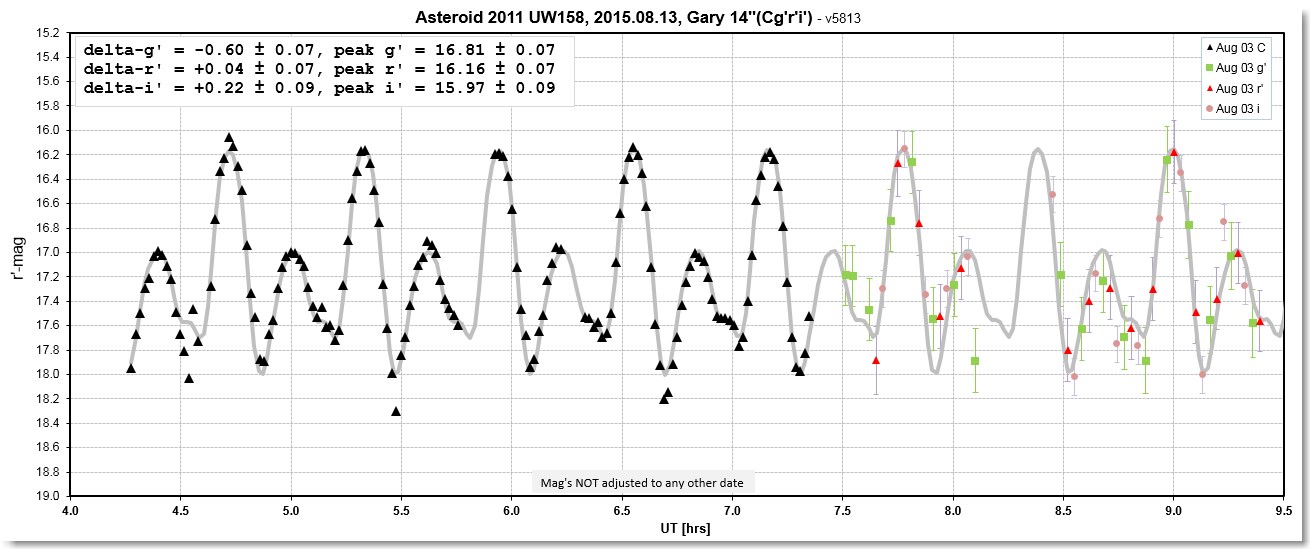
2015.08.13 Observation
An observation was made using C filter that included 5.4
rotations, showing slightly smaller "range of variation" = 1.84 mag.
2.0 hrs of g'r'i' observations were also made (reduction in
progress).
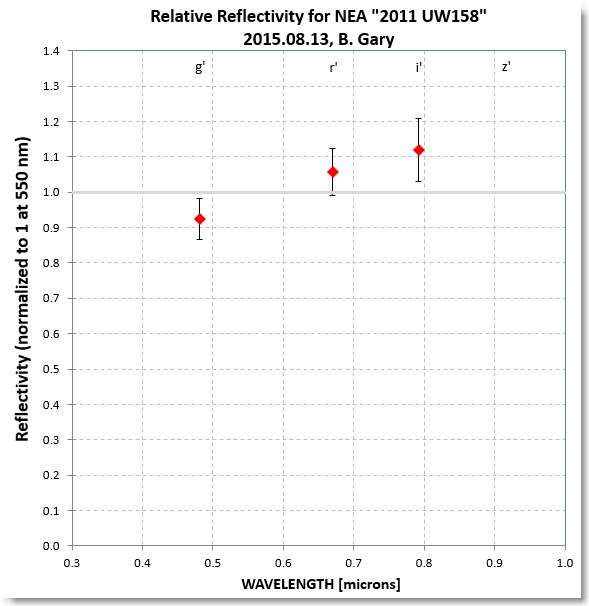
Using the above model fit the g', r' & i' mag's can be forced to
agree, and the required offsets can then be used to determine a
3-band relative reflectivity spectrum.
The black symbols are high SNR unfiltered observations
(calibrated to r' band). After the unfiltered observing
are g'r'i' mag's with offset adjustments that force them
to agree with an extrapolation of the unfiltered data model.
This relative reflectivity spectrum corresponds to a reddish color.
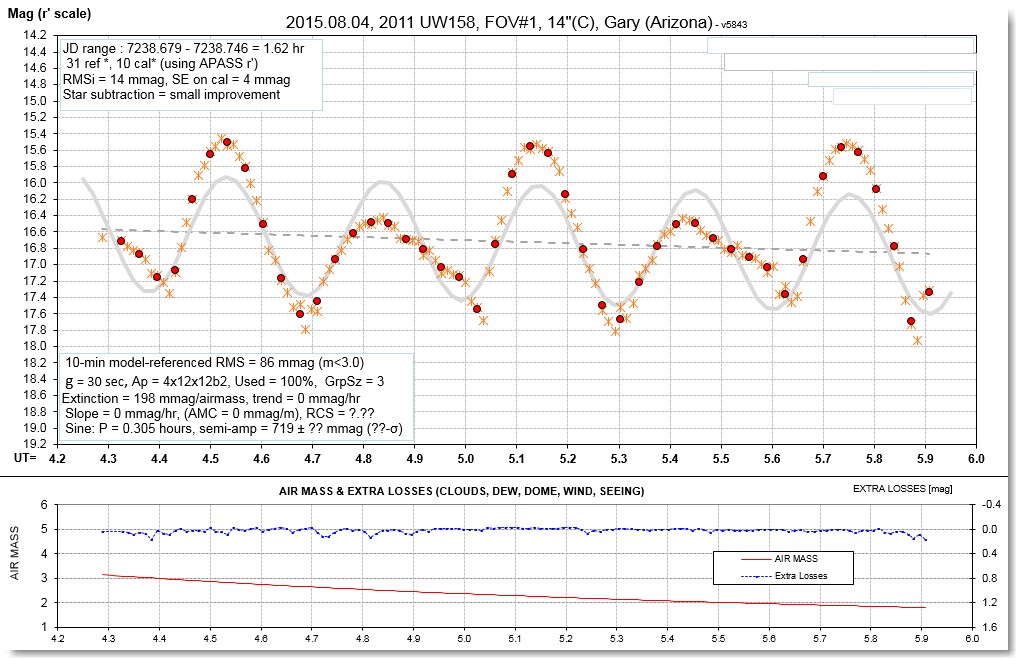
2015.08.04 Observation
An observation was made using C filter that included 2.7
rotations, confirms yesterday's large amplitude variation. The
"range of variation" is now 2.05-mag. The solid angle ratio during a
rotation is 6.6:1.
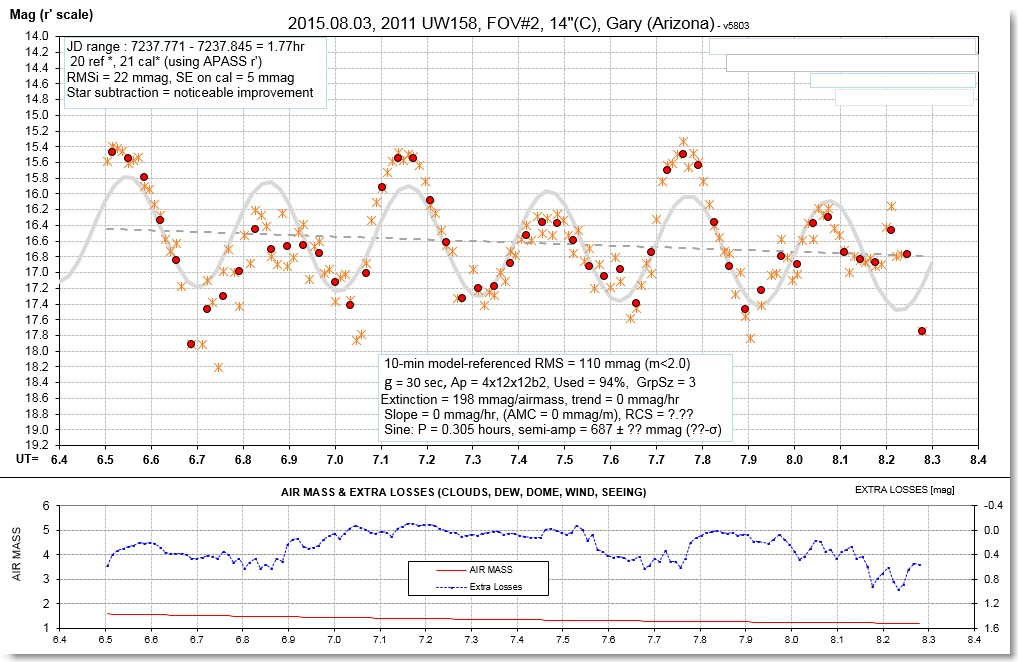
2015.08.03 Observation
This observing session was made using C filter during
conditions of continuous thin cirrus (this is the middle of the
Arizona monsoon). The next LC, showing 2.9 rotations, reveals that
the amplitude of variation has increased dramatically to ~2-mag's.
In addition, the second maximum is almost 1 mag fainter than the
primary maximum.
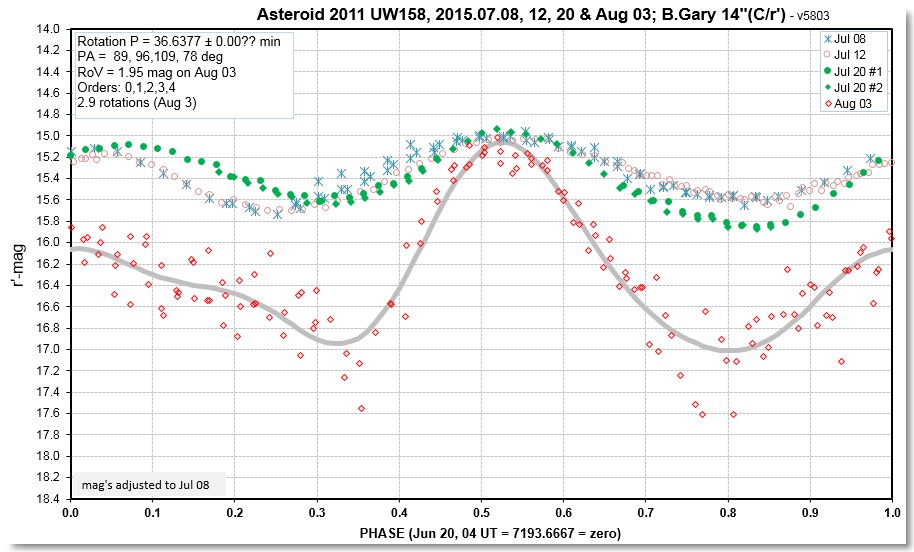
This phase-folded rotation LC shows the dramatic change in "range of
variation" as well as shape during the past 2 weeks (since Jul 20).
The "range of variation" of 1.95 mag implies a solid angle variation
of 6.0:1. The primary maximum, at phase 0.5, appears to be
"well-behaved," which means that this is a broadside view that
should be used for establishing a phase curve. It is obvious that
"rotation-average magnitude" should NOT be used for a phase curve
analysis.
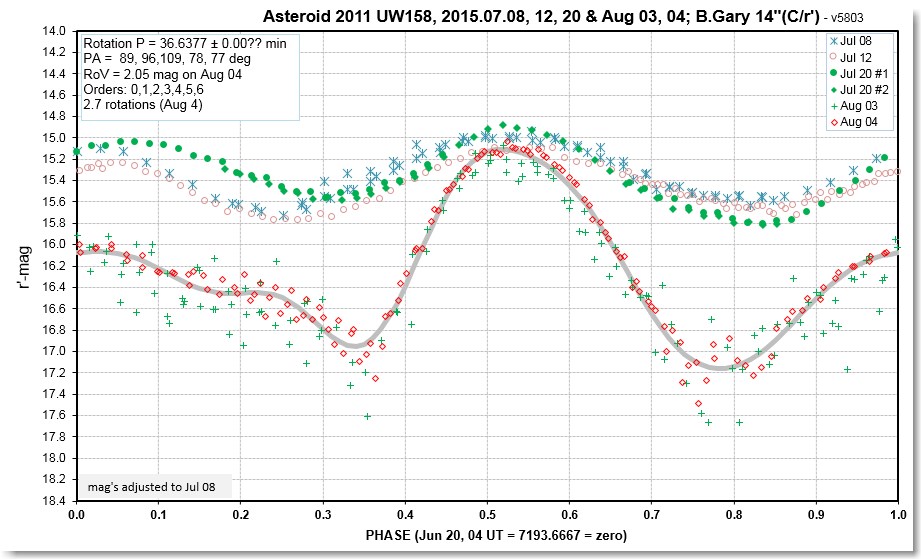
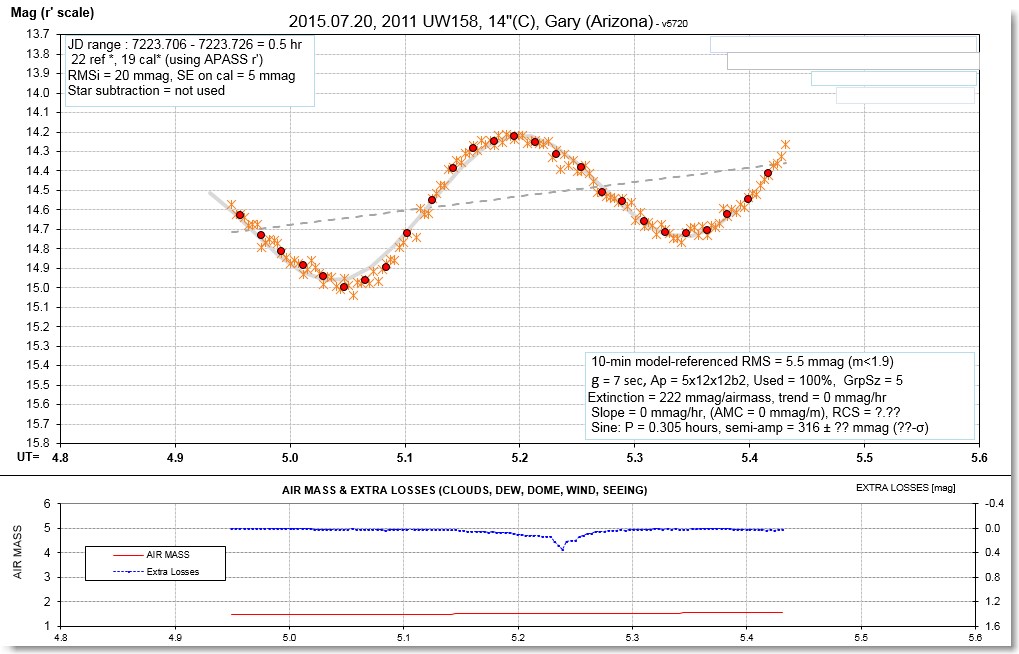
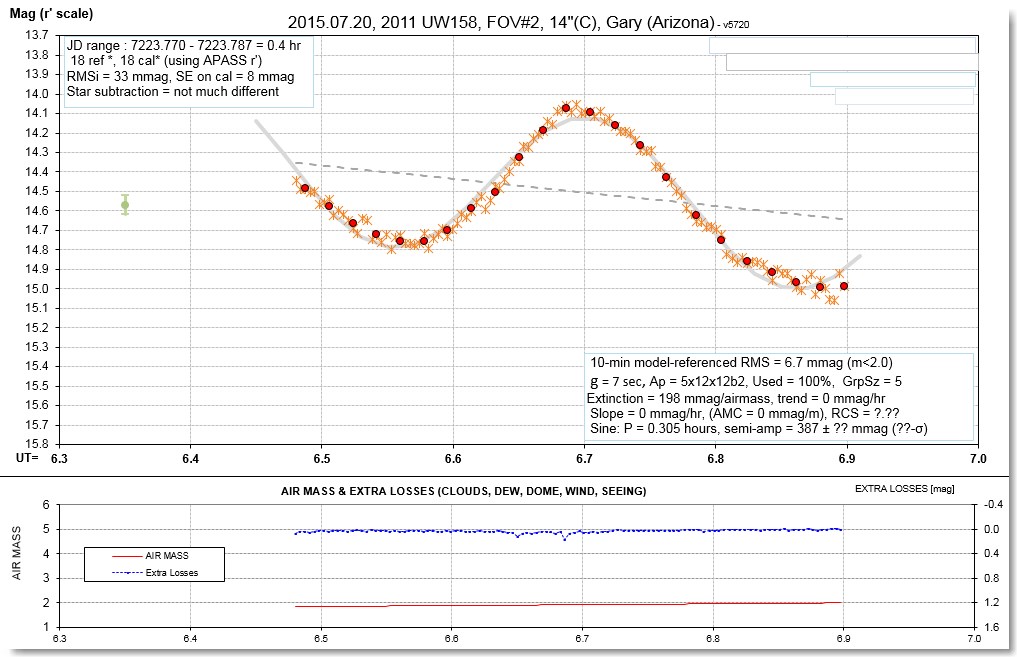
2015.07.20 Observations
After heavy rain just before sunset a clearing occurred, so I
observed unfiltered to establish rotation LC and observed with the
SA-100 transmission grating to determine relative reflectivity. The
rotation LC underwent a change, increasing "range of variation" from
0.7 mag to 0.9 mag, and with increased asymmetry. The C-band
observations (1.2 hrs) are shown as two FOV LCs, below.
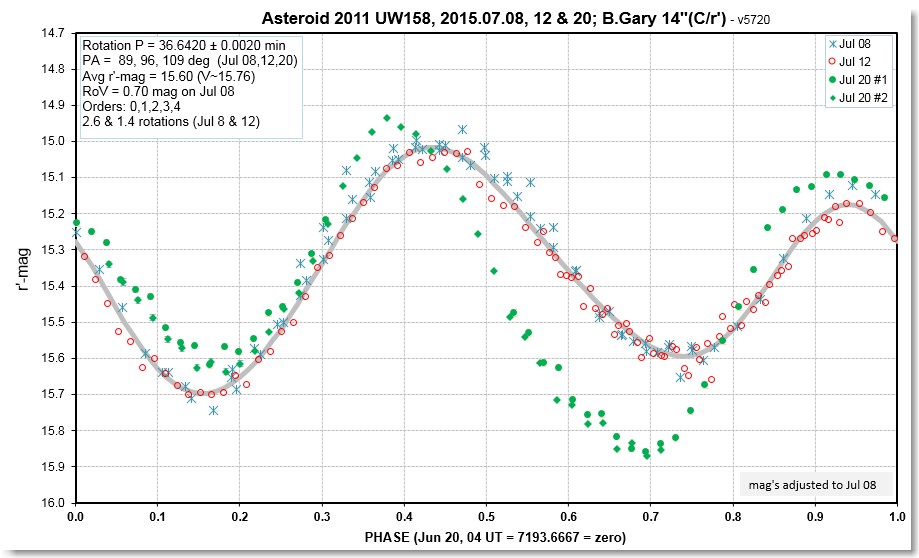
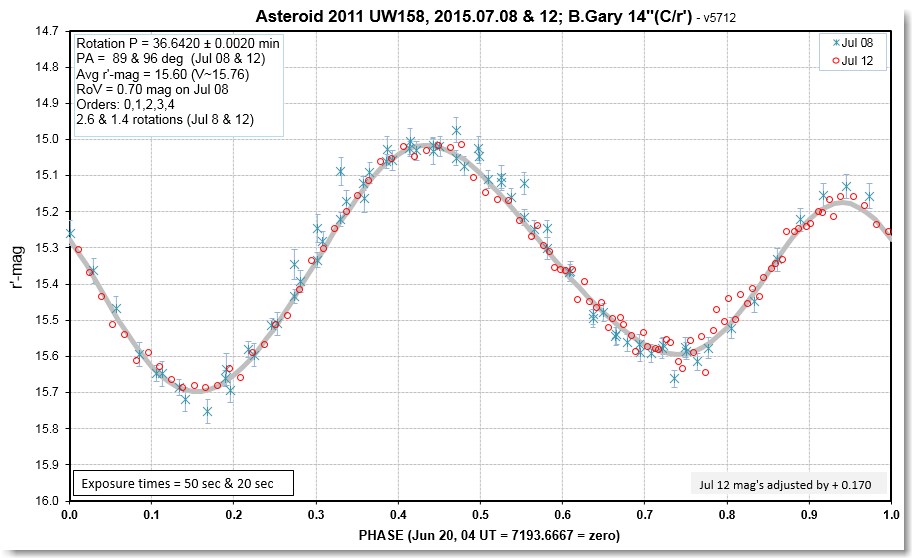
Rotation LCs for July 8 & 12 (very similar, with
model fit) and July 20 (different). TheJul 12 RoV = 0.92
mag.
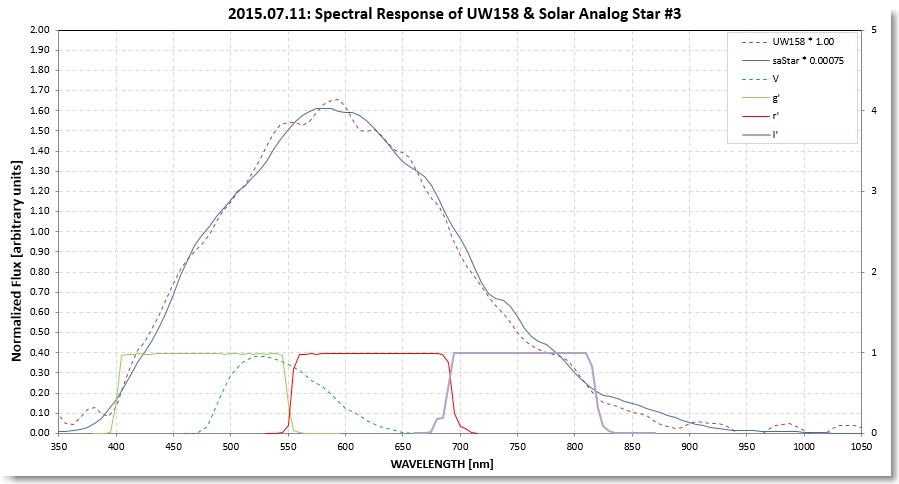
The SA-100 transmission grating response function is defined as
"counts per second per pixel" versus wavelength. It is affected by
CCD QE, telescope optical transmission, focal reducer transmission,
etc, so it goes to zero at short and long wavelengths. However,
since it will be the same for any star or asteroid it is possible to
compare ratios of response functions. When a calibration star is a
"solar analog" then it can serve as a stand-in for the sun. The next
figure shows the response functions for one solar analog star and
UW158.
Response functions for a solar analog star and UW158.
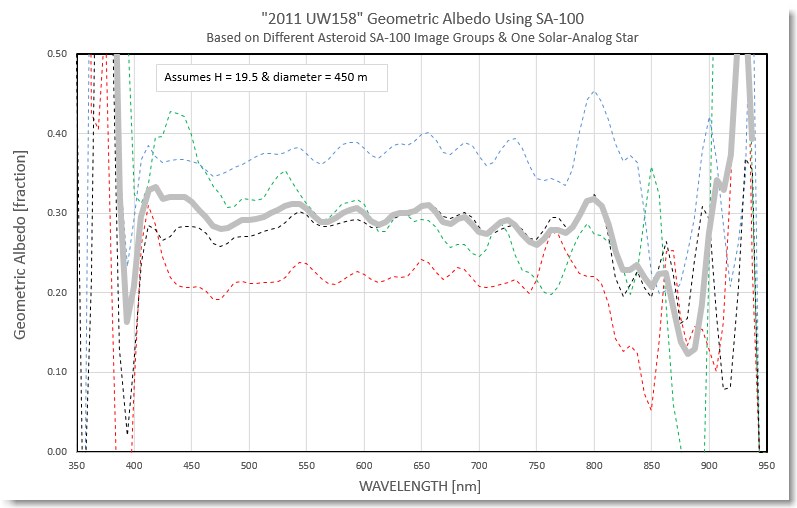
Below is a graph of UW158 albedo vs. wavelength (with a couple
assumptions).
Geoemtric albedo assuming H = 19.5 and diameter = 450 m, for 4
SA1-00 image groups. The thick gray trace is the average.
Since UW158's rotation causes brightness to vary by ~ 0.9 mag the
SA-100 image groups vary in their "response function," leading to an
apparent variation in albedo when the average diameter is adopted.
Data shortward of 410 nm, and longward of ~ 850 nm lack sufficient
SNR to be useful. The subtle fade beyond 800 nm probably isn't real.
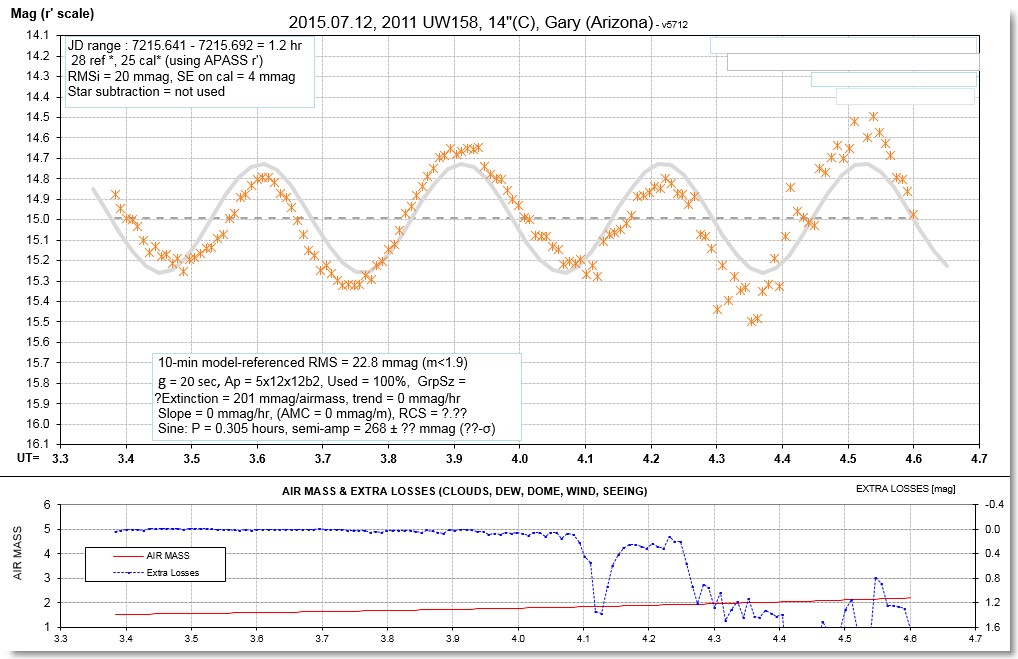
2015.07.12 Observation
A 1-hour observation was made using a C filter, calibrated
using APASS r'-mags, for assessing whether the phase-folded
(rotation) LC has changed since solar phase angle has increased
to its largest value so far, 96 deg. There has been no change in
either shape or amplitude of variation.
Phase-fold of July 8 & 12 data,
showing essentially no change in shape or amplitude between
these two dates (PA = 89 & 96 deg).
The rotation average r'-mag is 14.99, which allows a new
data point to be added to the phase curve (1st figure on this
web page). A revised diameter solution is 256 ± 35/29 meters is
determined, with the caveat that this may be totally meaningless
since it is based on a phase curve restricted to a PA range of
60 to 96 degrees (vs. the 0 to 25 deg range from which the
B&S 2000 relationships were determined).
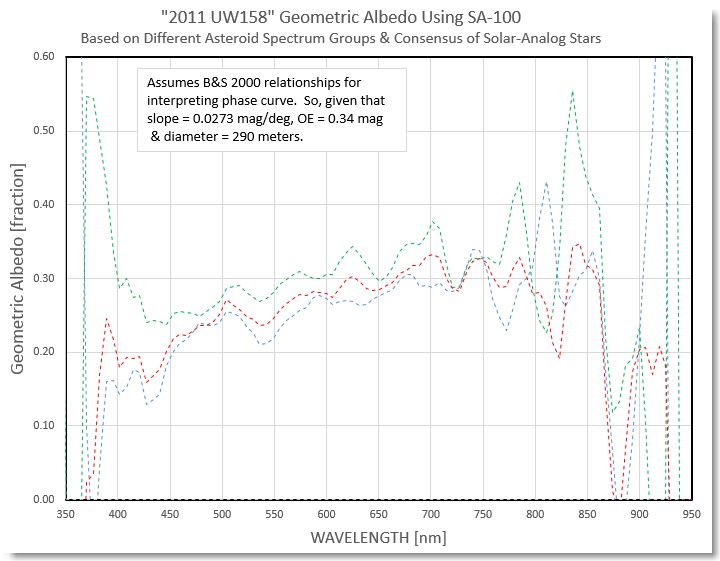
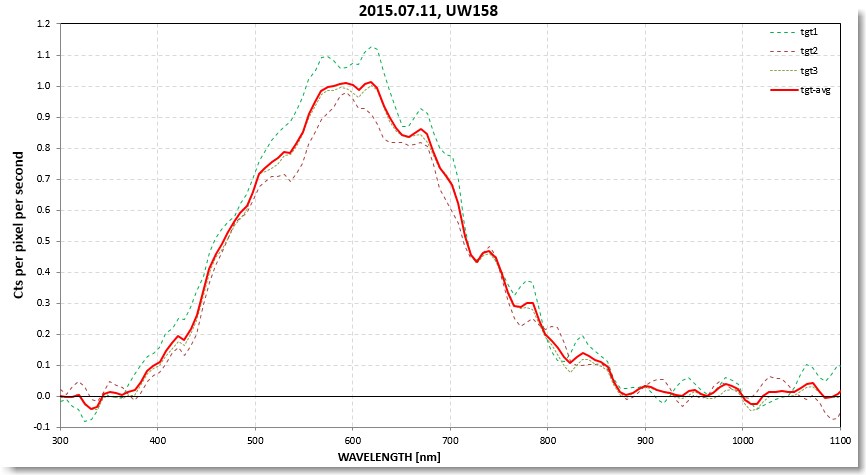
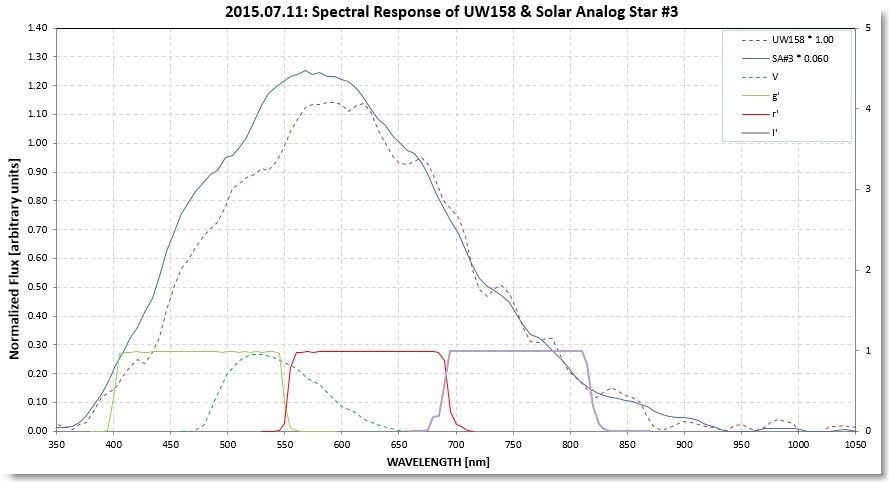
2015.07.11 Observation
A 2-hour observation was made using a SA-100
transmission grating. One solar-analog star was observed at the same
approximate air mass as UW158. The next figure is the geometric
albedo spectrum derived from these observations (subject to the
caveats described below).
Geometric albedo spectrum based on 3 groupings of UW158 images
and a consensus of the solar-analog star spectrum. Due to
SNR data are valid only within the 400 nm to 820 nm region.
As the figure states, I have assumed that the phase curve (as of Jul
08) can be interpreted using the B&S 2000 relationship. This is
a dubious assumption for 2 reasons: 1) B&S 2000 is based on
large asteroids (and it is not known if small ones exhibit the same
relationships), and 2) B&S 2000 is based on phase curves for
phase angles < 25 degrees, and the present UW158 observations are
at much larger phase angles (60 to 90 deg). Nevertheless, the
"shape" of this albedo spectrum should be valid, so the conclusion
that UW158 has a red albedo slope (is slightly redder than the sun)
is valid. The possible presence of a 1 micron absorption feature
should also be unaffected by the B&S 2000 assumption, though
this feature is very uncertain due to SNR limitations (there was too
much water vapor in the atmosphere, producing large extinction at
820 nm & beyond 900 nm). The albedo spectrum for this date is
essentially compatible with the one obtained from Jul 09
observations.
The albedo spectrum (above) was derived from a set of ~ 60 30-second
images that had star effects subtracted (i.e., median of
star-aligned images was subtracted from all individual star-aligned
images, and these were then asteroid-aligned for subsequent
averaging). The resulting asteroid spectrum is essentially devoid of
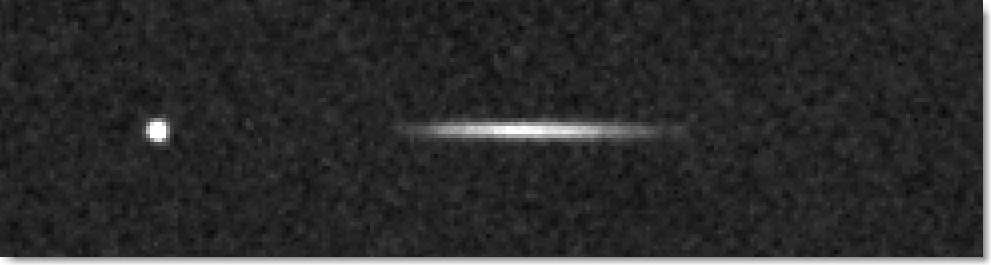
interfering effects of background stars. Here's an example of a
"clean" image of UW158 with its zero- and first-order spectrum.
Average of "star-subtracted" spectra of UW158. The asteroid's
zero-order image is on the left, and the first-order spectrum is
to the right (brightest portion corresponds to ~ 600 nm, and
wavelength to pixel conversion is proportional to distance from
zero-order image location).
Readings of ADU counts vs location from the zero-order image are
entered into a spreadsheet and converted to response functions,
illustrated in the next figure.
Three image groups produced these "response functions" (ADU
counts per second per pixel vs wavelength).
The average response functions for UW158 and a solar-analog star (at
12:44:17-00:27:33) are compared in the next figure.
A re-scaled version of the solar-analog star's response function
is compared with the UW158 response function, showing that UW158
is redder than the solar analog star.
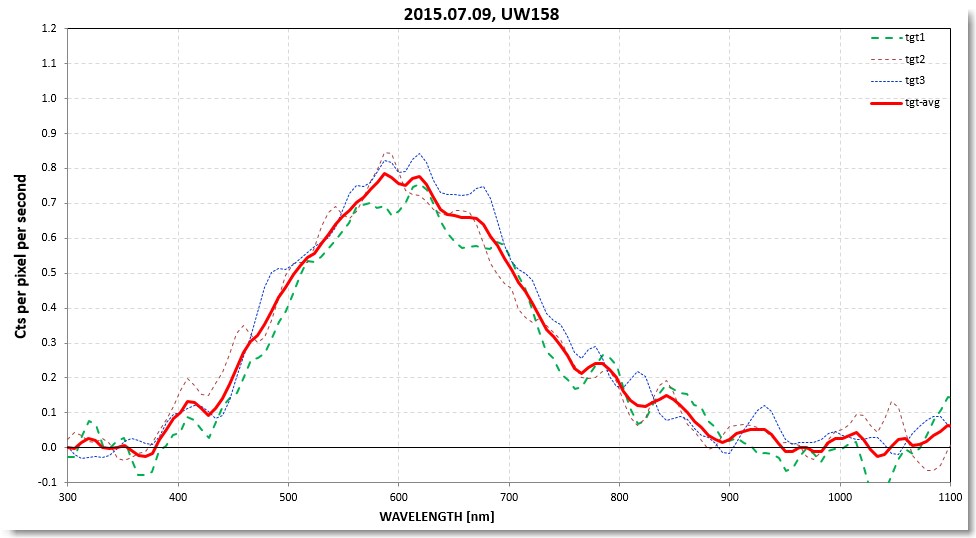
2015.07.09 Observation
A 2-hour observation was made using a SA-100
transmission grating. Five solar-analog stars were observed at the
same approximate air masses as UW158. The ratio of responses can be
used to determine the shape of the reflectivity spectrum.
Response vs. wavelength of UW158 for 9 images (40-sec exposures)
median combined in 3 groups (tgt 1,2,3) and averaged (tgt4).
Atmospheric extinction features in the above spectral response
at 763 nm (oxygen), 820 nm (water vapor) and 920 - 1000 nm (water
vapor).
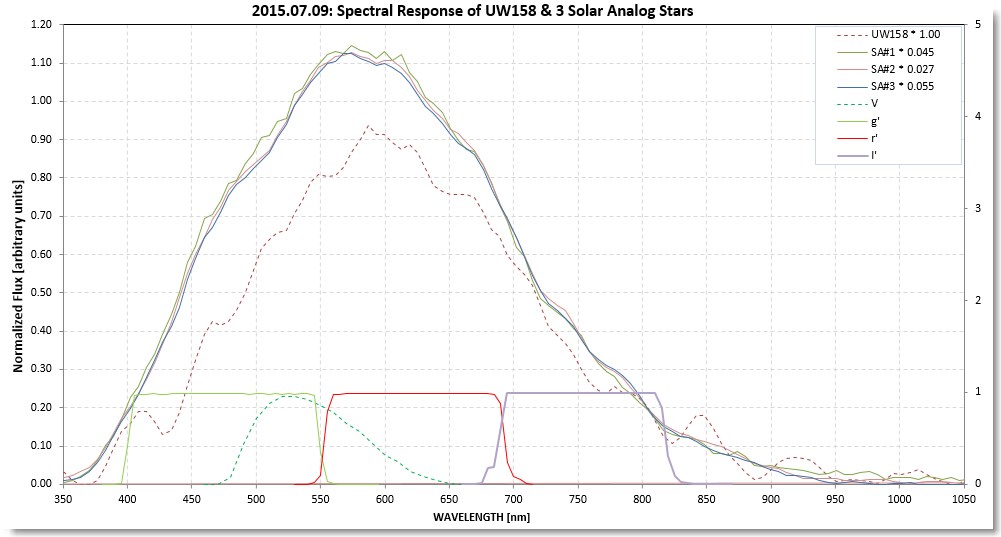
Response of 3 solar-analog stars (rescaled to be same)
& average UW158 response.
From this plot it is apparent that 1) all 3 solar-analog stars have
the same spectral response shape, and 2) UW158 is redder than
solar-analog stars.
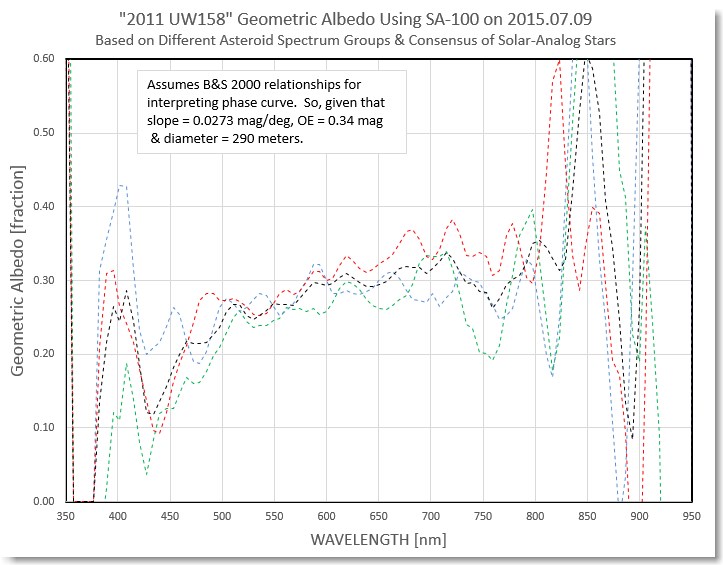
Geometric albedo spectrum of UW158 for groups of 7 images (air
mass ~ 1.9, V-mag ~ 15.7). The phase curve as of Jul 08 was used
to estimate brightness at zero phase, which in turn led to a
diameter of 290 meters, both of which are adopted for calculating
albedo. Due to the uncertainty of interpreting the phase curve
this way the albedo spectrum is subject to an unknown multiplier;
i.e., the slope is valid but no necessarily the overall value.
I conclude that UW158 has an albedo slope that makes it slightly
redder than the sun. I believe this result more than the g'r'i'z'
albedo spectrum (July 02), and will investigate the discrepancy.
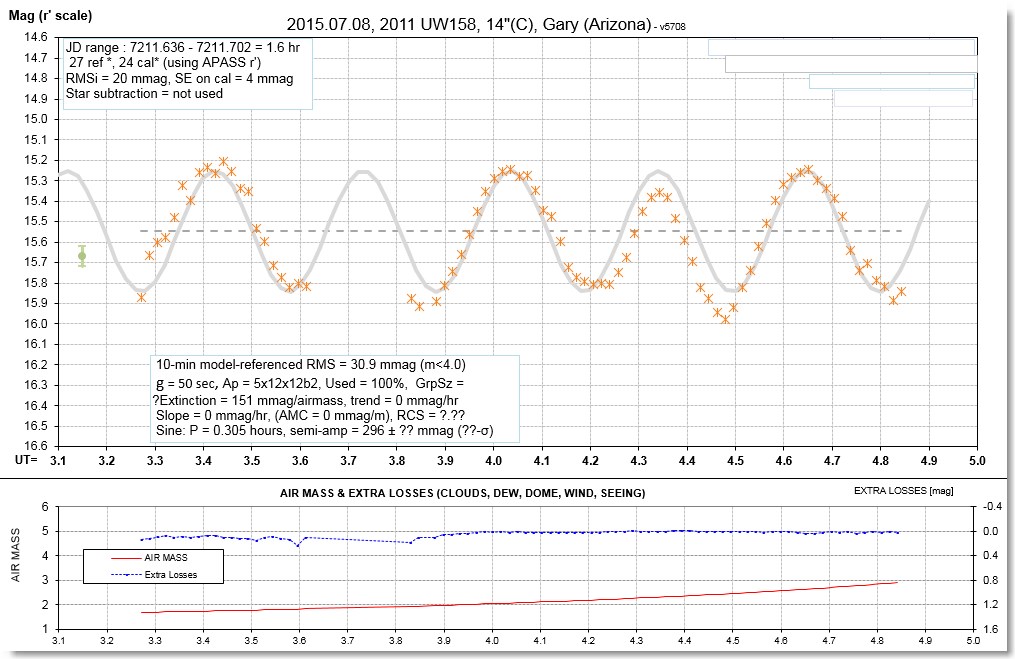
2015.07.08 Observation
A 2-hour observation was made using C filter &
SA-100 transmission grating with exposure times of 50 seconds.
LC for July 8, lasting 2.6 rotations.
Phase-fold of July 8 data, using a period based on data for all
observing sessions.
The "range of variation" is increasing with solar phase angle.
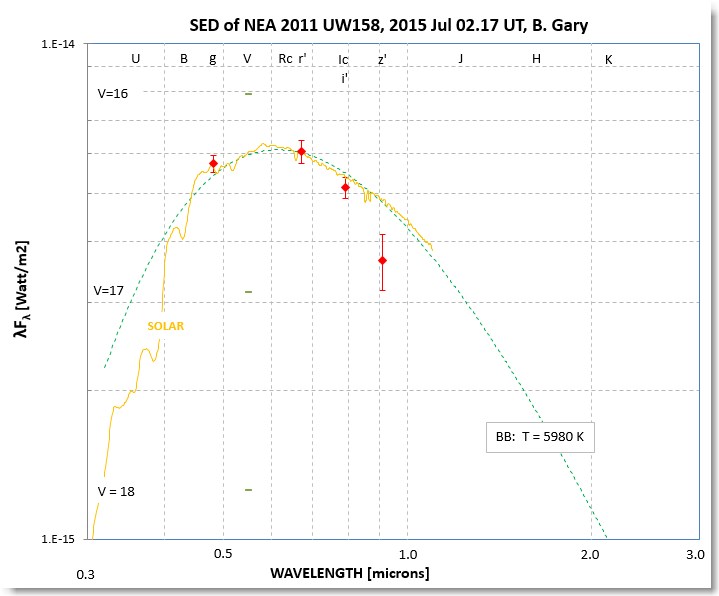
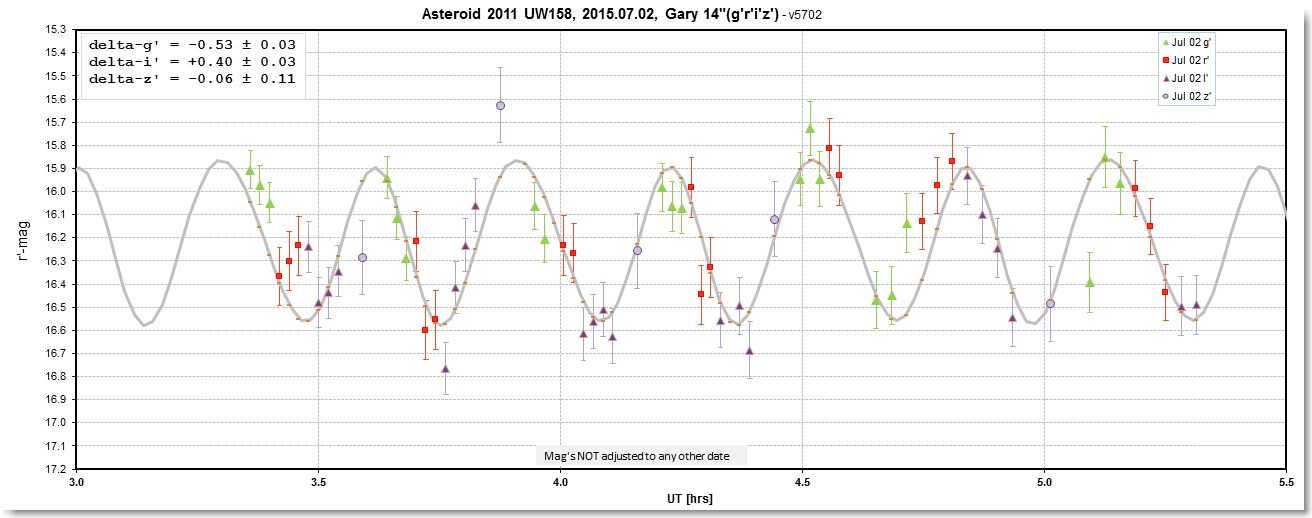
2015.07.02 Observation
A 2-hour observation was made using g'r'i'z' filters in
alternation with exposure times of 60 & 100 seconds.
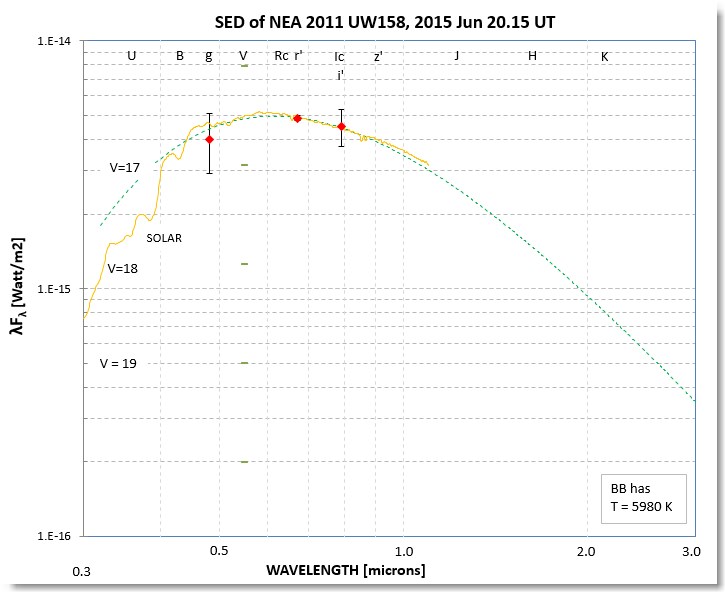
Average g'r'i'z' magnitudes were used to produce the following SED.
This was used to produce a relative reflectivity plot.
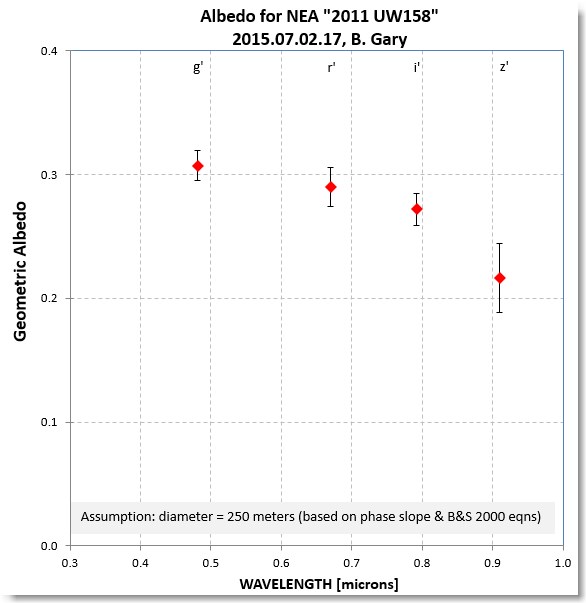
Ratio of asteroid flux to solar flux averaged over the respective
g'r'i'z' bands, normalized so that albedo ~ 30% at V-band (as
derived using the phase slope and B&S 2000 relationships for
albedo & OE, described above).
There is a risk in attempting to determine albedo spectrum from
observations of a large amplitude, fast-rotating asteroid when
filters are used in alternating groups. As the next graph
illustrates, one filter group may occur preferentially at the peak
of the variation (e.g., green symbols, for g'-band), while another
filter group may occur preferentially near the minimum (e.g., purple
symbols, z'-band). If average magnitude is then used to create a
spectrum these biases will distort the spectral shape. I think this
is what happened for these observations. A better procedure is to
keep track of offsets required to fit a model variation, etc. I plan
on doing this.
By adjusting mag's for each band for minimum chi-square agreement
with r'-mag's reveals a LC shape similar to the high SNR LC shape
from unfiltered observations on previous date (Jun 20).
The r' images had sufficient SNR for adding to the unfiltered
rotation LC solution. An improved rotation period was obtained. So
far the G=0.15 phase curve model is OK.
Rotation (phase-folded) LC combining early unfiltered
observations with r' observations on Jul 02.
2015.06.24 Observations
I observed UW158 for an hour on this date, using g'r'i'z' filters in
alternation, using 60-second exposures. The goal was to obtain a
Spectral Energy Distribution (SED), from which an albedo spectrum
can be derived. A specific goal was to see if a Band I absorption
feature at 920 nm was present; its presence would indicate a surface
with olivine and pyroxene. Intermittent mid-level clouds were
present, but during a 15 minute clearing useable observations for
all filter bands were obtained. Only 3 or 4 images were available
for each filter band, so the results are noisy. APASS magnitudes of
background stars were used to calibrate each image. The next figure
is my SED for these data.
Spectral Energy Distribution (SED) for UW158 on Jun 24.
A SED that has the same shape as the sun indicates a uniform albedo
versus wavelength. The above SED is too noisy to say much about the
albedo spectrum, except that the data are compatible with a flat
albedo spectrum within the 0.4 to 0.8 nm region. It's unfortunate
that the z' data, centered at ~ 0.92 nm, was too noisy for use.
Future observations should be better.
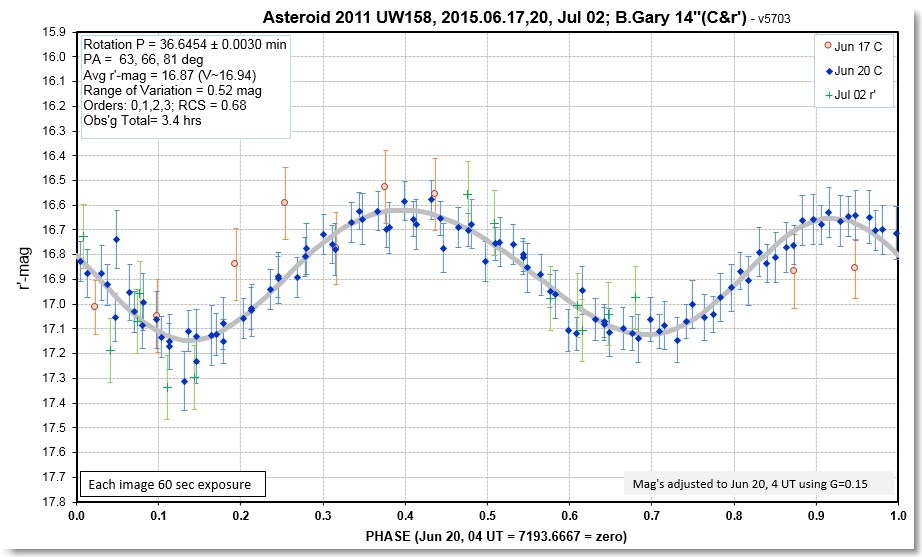
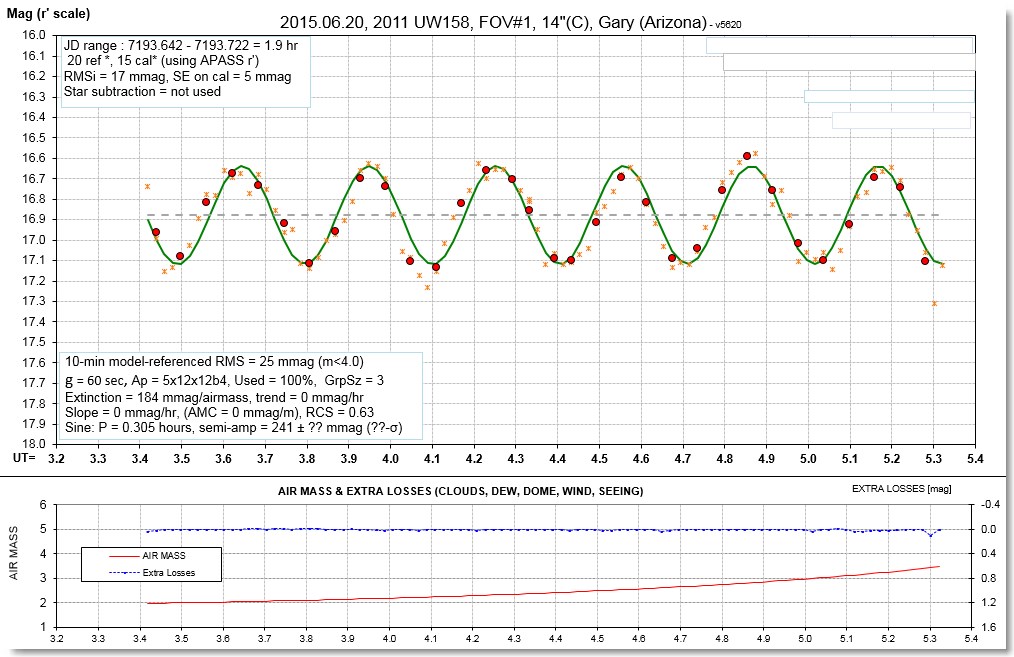
2015.06.20 Observations
A 1.9-hour observation was made on Jun 20. It revealed a definitive
rotation light curve for UW158: P = 36.6 minutes, range of variation
= 0.52 mag.
Light curve (LC) during a 1.9-hour observing session, revealing a
sinusoidal variation with period 0.3 hrs.
The next figure is a phase-folded LC using the same data (above)
with a model solution based on chi-square minimization.
Phase-folded "rotation LC" using a solved-for rotation
period of 36.665 minutes (solution includes some data for Jun 17).
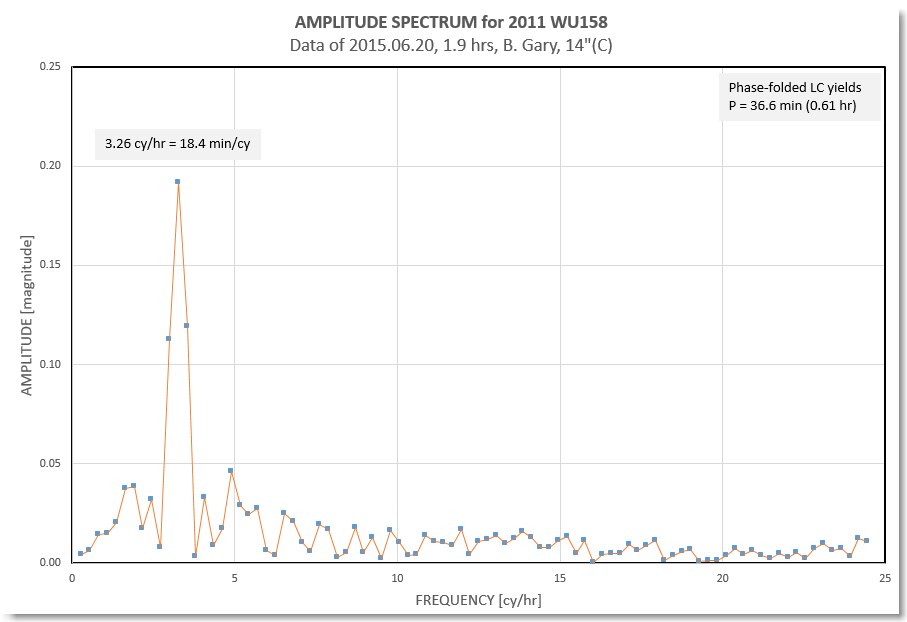
The following is a power spectrum of the Fig. 1 LC data.
Power spectrum (actually square-root of power) showing one main
peak at 3.26 cycles/hour (18.4 minutes).
The above power spectrum has one distinct peak corresponding to half
the rotation period. Power exists at ~ 1/2 of the main frequency,
signifying the presence of slight differences in neighboring peaks
(all odd numbered cycles are the same, as are all even numbered
ones, but odd and even cycles are slightly different from each
other). The power at ~ 5 cycles/hour merely shows that the
variations are not purely sinusoidal. All of these properties can be
discerned by inspection of the first figure for this observing
session.
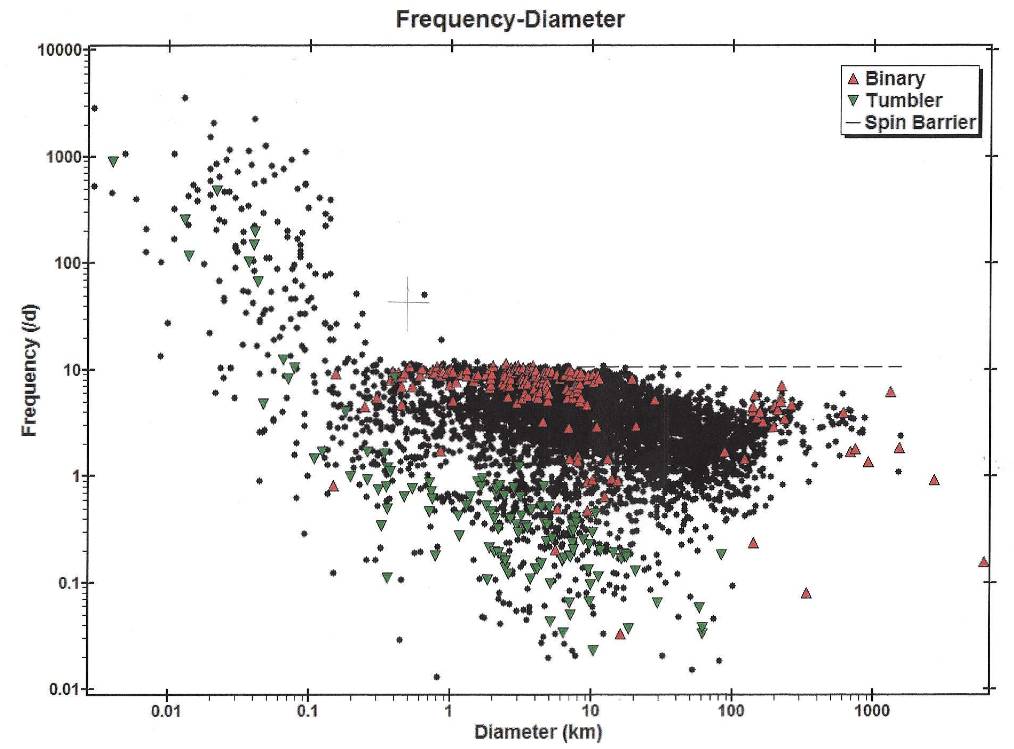
It's rare for asteroids as large as UW158 to rotate this fast, as
the next figure shows.
Plot of asteroid rotation frequency vs. size (as compiled and
displayed at the IAU Minor Planet Center Asteroid Light Curve
Database web site, link below). The cross-hairs show where UW158
would lie if it had a typical albedo (geometric albedo =
12%, H = 19.5, G = 0.15).
In the above plot only two other asteroids lie well above the "spin
barrier" for large asteroids (rotation period = 2.2 hours). Such
asteroids can't be unconsolidated "rubble piles" because such
asteroids would simply fly apart! Only rocks ("monoliths") can spin
this fast (for this size range). If UW158 has an albedo > 30%
then its size would be withing the "permitted" region for high spin
rate. This might constitute a case for believing that UW158 has a
high albedo and is ~ 250 meters in diameter.
2015.06.17 Observation
A brief (1/2-hour) exploratory observation was made with
a 14" telescope on Jun 17. It quickly revealed that UW158 rotates
fast (P ~ 1/2 hr), and exhibiting a large amplitude (~ 0.5 mag).
Future Prospects
UW158 will brighten until ~ Jul 21, according to an assumption of an
HG phase effect model with G = 0.15. It is currently ~ 2 magnitudes
fainter, but it is moving slower, which permits 2 to 3 minute
exposure times for amateur telescopes with ~ 3.2 "arc atmospheric
seeing. At the present time UW158 is observable for only 3 hours,
starting at twilight. For northern hemisphere observers UW158's
increasing declination will permit longer observing times. Fully one
month of observations are feasible for amateur observers.
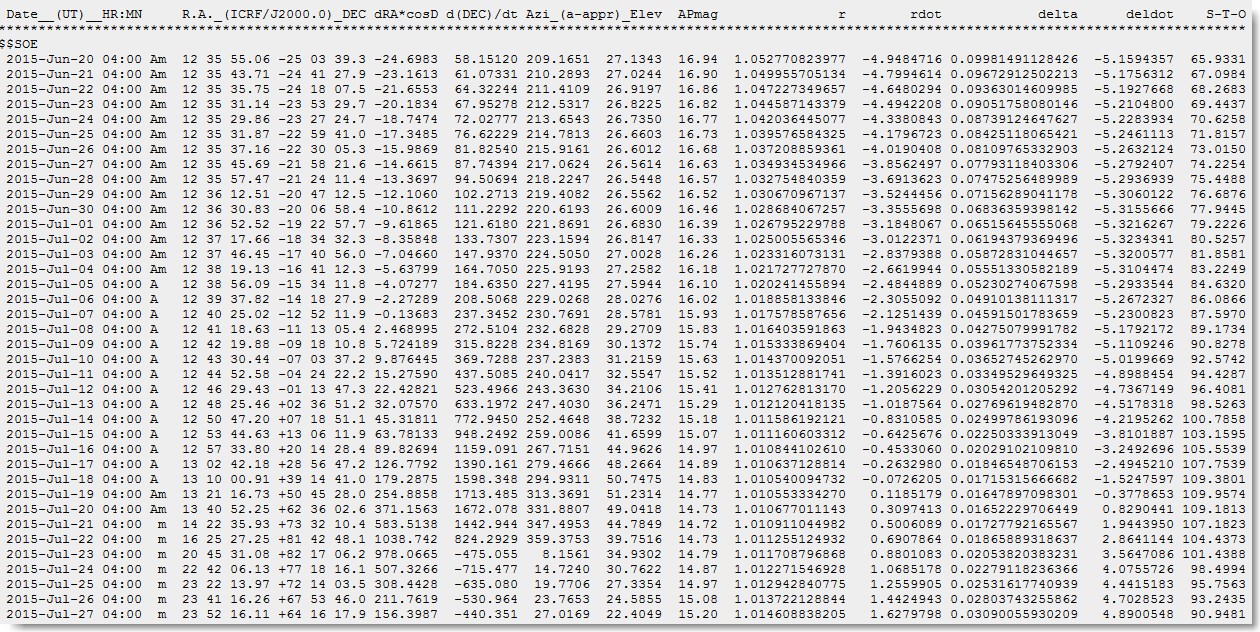
Figure 6.JPL Horizons ephemeris for daily intervals, at
04 UT (and EL at my Southern Arizona observing latitude), showing
that UW158 is observable by amateurs for more than a month.
When UW158 is close to its brightest I plan on observing it with a
SA-100 transmission grating. This should produce a spectrum from ~
450 to 950 nm with ~ 1% spectral resolution. Previous observations
with this hardware has clearly shown the Band I absorption feature
at 920 nm. The exact wavelength of this absorption is affected by
the relative abundances of olivine and pyroxene.
The phase angle (S-T-O, sun-target-observer) varies from 66 deg (Jun
20) to 109 deg at closest approach. This may be adequate for
measuring the phase effect slope [mag/deg]. Knowledge of phase slope
can then be used to infer albedo, as described by
Belskaya
I.
N. & Shevchenko V.G. (2000, Icarus147, 94
). And with albedo it is possible to determine diameter. Of
course, radar observations should provide a better diameter, without
the B&B assumption of phase slope to albedo correlation, so when
the radar diameter is available we can state whether or not the
B&B correlation holds up for an asteroid this small - which is
also a useful check.
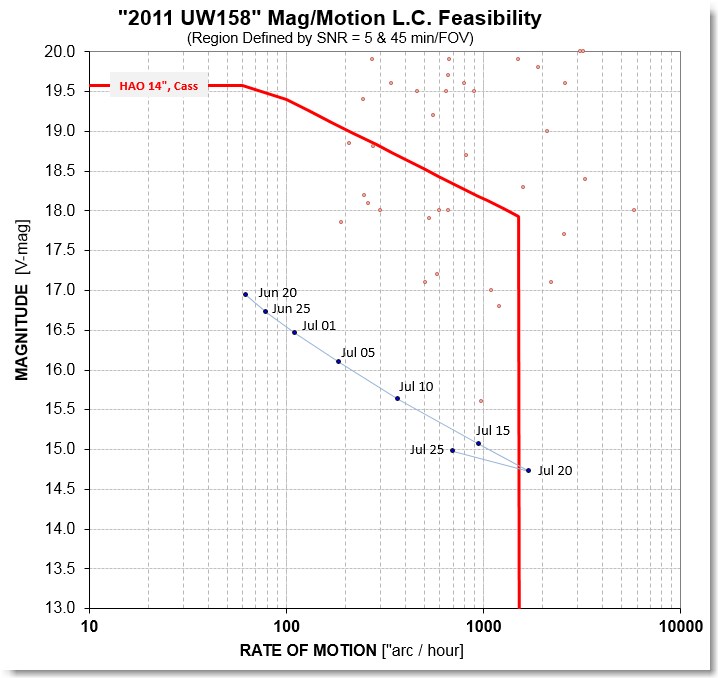
Feasibility Track
Last year I developed a useful way for an observer to learn if it is
feasible to observe a NEA for producing a LC based on the NEA's rate
of motion and brightness. The following graph is for my hardware
(Meade 14", f/5, SBIG ST-10XME, KAF3200E, 80% QE max).
Figure 7.UW158's track in a magnitude/motion diagram for
5 day intervals. The region enclosed by the red boundary shows
what's feasible for a 14" telescope (with a typical CCD in a
Cassegrain configuration). The upper border corresponds to a
brightness yielding SNR > 5, which is a minimum criterion for
producing a LC. The right border corresponds to the assumption
that FOV changes at intervals as short as 45 minutes are
acceptable. Exposure times are set to the PSF crossing time; for
this telescope I have adopted PSF = 3.2 "arc. FOV is 18x27 'arc,
and FOV changes are for 75% track across either FOV dimension.
The above graph shows that for my telescope UW158 is "observable"
during the entire time it is close to Earth. Graphs can be easily
produced for other observers with a different telescope and CCD.
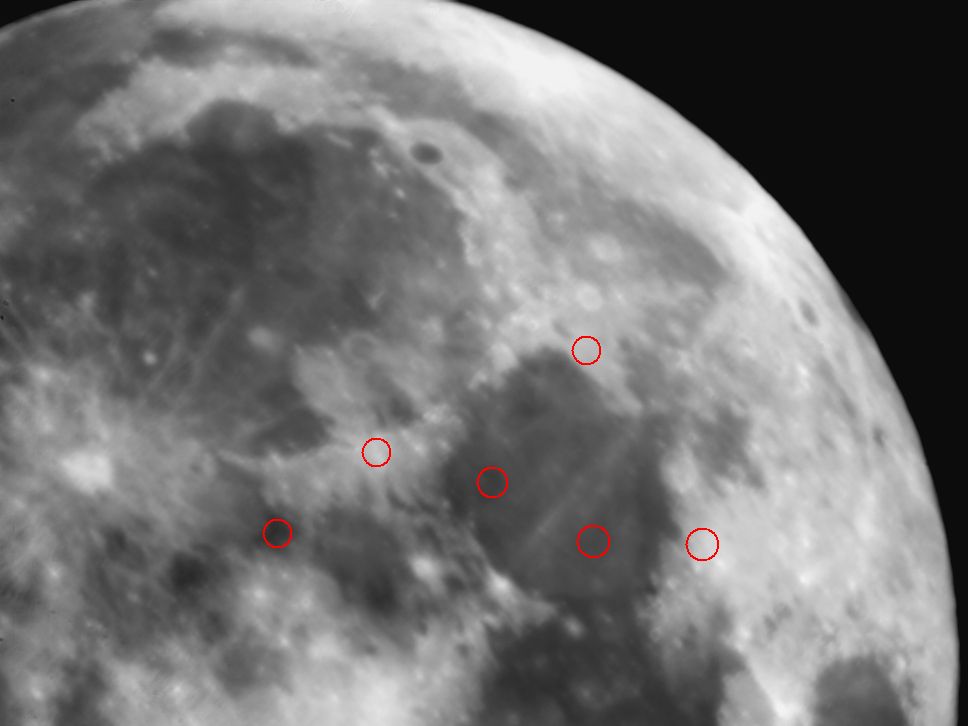
Moon Phase Curve
An eclipse of the moon on 2015 Sep 28 offered an opportunity to
begin observations of the moon's phase curve that would include
small phase angles.
NE quadrant of moon showing 3 maria and 3 highlands used for
phase curve measurement.
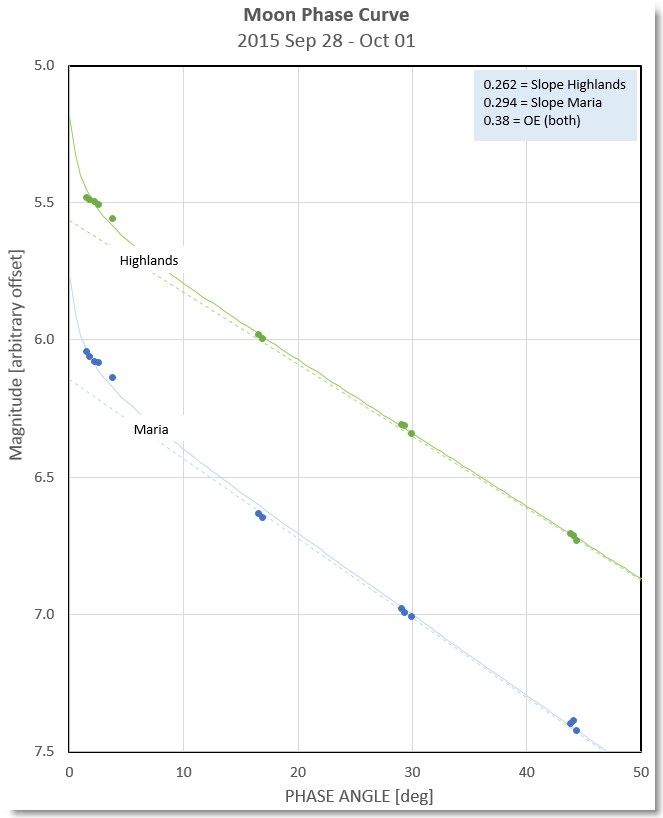
Phase curve for lunar highlands and maria.
Two notable features of the lunar phase curve are: 1) the slope
functions for both maria and highlands are linear out to phase
angles of 45 deg, and 2) the high albedo highland slope is shallower
than the low albedo maria slope. Both features are compatible with
the B&S model, and this provides support to the position that
the B&S model can be used for phase angles > 24 deg.
Bye
I’m probably familiar with the
cultures of more science disciplines than most scientists, based
on 55 years of earning a living in them and dealing with the
principal scientists within those fields. My first exposure (in
the 1950s) was as an undergraduate astronomy student, working my
way through college as a part-time employee of a radio
astronomer. I felt welcomed by everyone in the Astronomy
Department, where I had office space. I was invited to
department Christmas parties and other social gatherings. My
first experience as a professional radio astronomer entailed
studies of Jupiter, the moon and other planets. After a decade I
transitioned to boundary layer meteorology, emphasizing remote
sensing. Then aviation safety, including remote sensing of CAT
(leading to several patents). Then atmospheric science of the
stratosphere; I was a PI for all of NASA's airborne ozone hole
missions, until retirement. A few years into retirement I
became involved with exoplanet transit observing, including a
couple consulting contracts and a how-to book for amateurs.
Finally, during the past 1.5 years I observed asteroids for pay,
characterizing 27 NEAs within 9 months (for a Tucson
astronomer).
Each science discipline has a “culture” which is greatly
influenced by the most experienced and most competent
practitioners. I would characterize the radio astronomy
community (of the 1960s) as welcoming, tolerant and honest. The
boundary layer meteorology community was fast-paced and open to
new ideas, and since I had new ideas using the latest technology
I was welcome. The aviation safety community was the same. The
community of atmospheric scientists studying the stratosphere
was well-organized and adhered to high standards; I became a
welcome fixture for all of NASA's aviation-based ozone hole
investigations. The exoplanet community was young and
fast-growing, and well-disciplined. The scientific discipline
that is most important to me is sociobiology, but I’ve never
had dealings with anyone working in the field – in spite of
the fact that I’ve written a book on the subject. Based on
my attendance at a few conferences, and reading many
articles and books on the subject, I have a sense that
within this field is a welcoming of anyone with new ideas,
but with a requirement that you’d better be able to back
them up. It’s such a controversial field that they are wary
of both public criticism and academics with a social agenda
(i.e., on matters relating to a culture's social fairness)
who want to continue their hijacking of the field that
started 130 years ago; I suspect that everyone in
sociobiology is prepared for controversy regardless of what
they propose.
But it's the asteroid community that still puzzles
me. They are somewhat insular, and resentful of newcomers, and
are prone to bickering as they seem quick to criticize others
(behind their back) as if this will help fend-off competition
for funding. Maybe that’s what happens when NASA funding for a
discipline has a doubling-time of 1 or 2 years: "we can’t let
those idiot newbies get any of our money." (The only time in the
past 55 years that someone questioned my integrity was a couple
months ago, by a well-known asteroid person whose complaint was
totally unfounded, and was done in a way that I was supposed to
not know about it). A few established asteroid workers are
welcoming, but most seem resentful of newcomers.
Each scientific discipline has a different level of discipline,
honesty and welcoming of new people with new ideas. A small
cadre of leaders set the tone for anyone wanting to contribute.
Each discipline resembles a tribe, with tribal elders who pass
on requests for joining. The asteroid tribe has a “No
Trespassing” sign out front and a sign on the door that says
“Stay Out.”
Got it! Time for another transition (after UW158).